Technical analysis by keyvankho about Symbol HBAR: Buy recommendation (10/30/2025)

keyvankho
تحلیل HBAR: حرکت انفجاری، لیکوئید شدنها و نقشه نهنگها برای صعود تا ۰.۴۳ دلار!
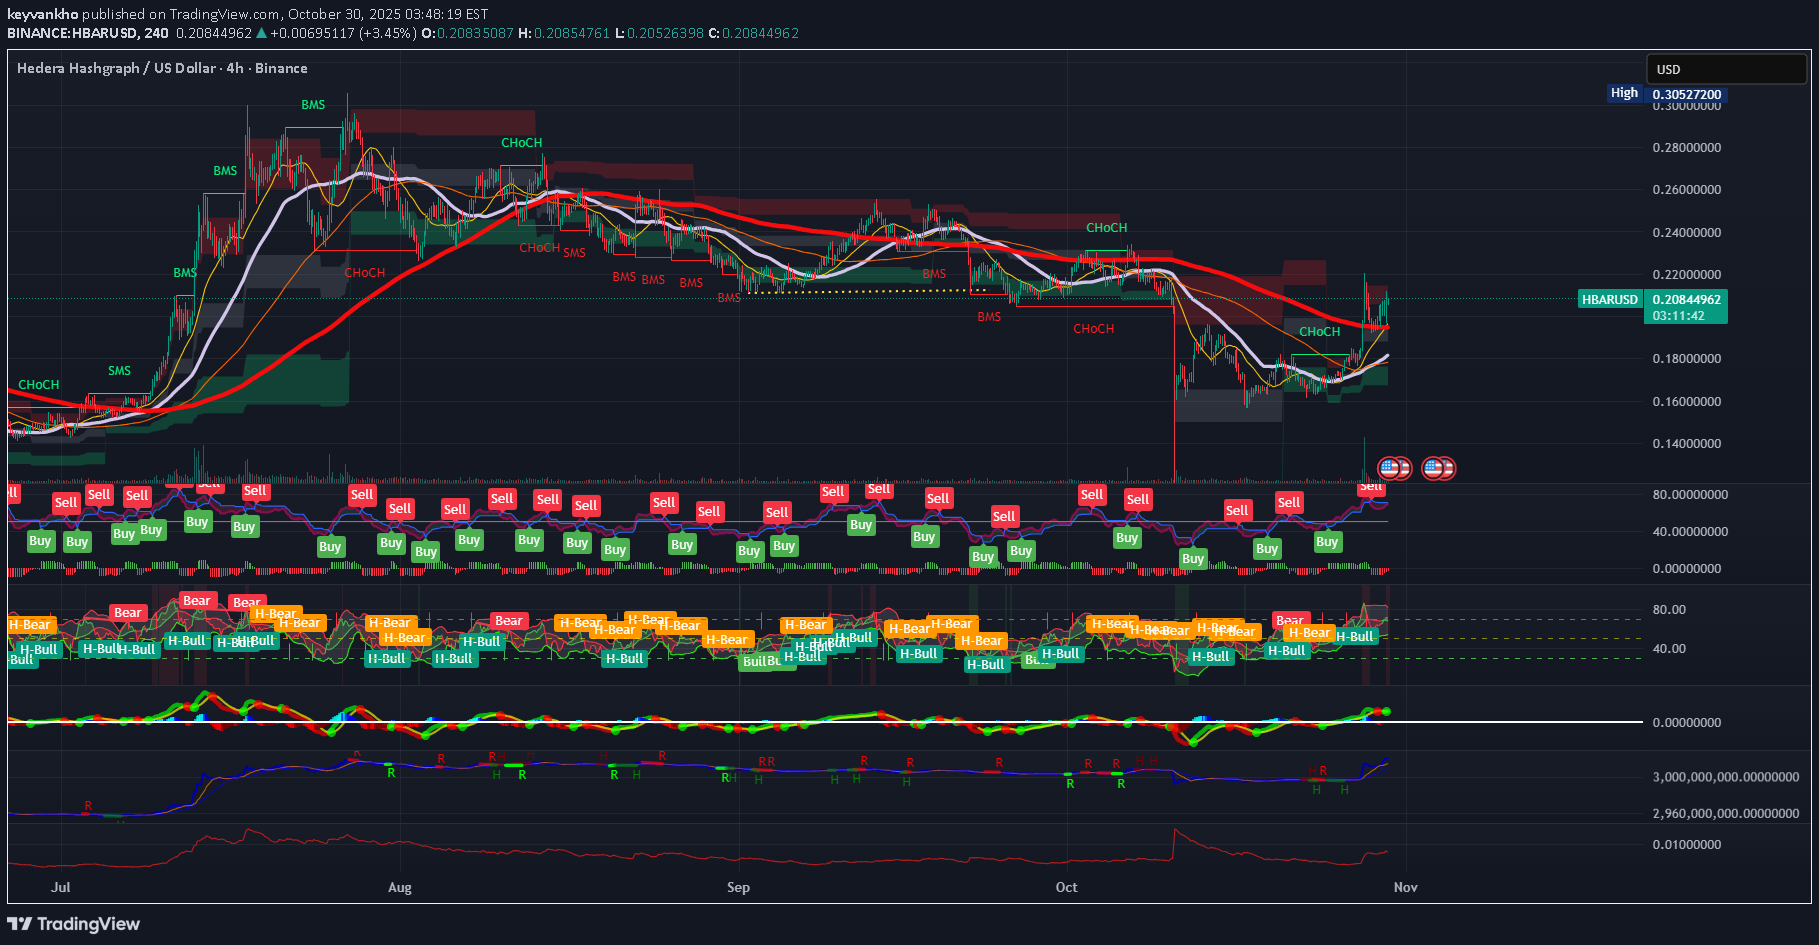
HBAR has completed a clean impulsive breakout structure from the $0.18 base and is now consolidating above the key support band at $0.203–$0.207, which is acting as the first institutional accumulation layer following the smart-money CHoCH and BOS sequence on the 4H. Price continues to print higher-lows on intraday frames, and volume data shows clear spot bid absorption on every dip into VWAP and the 0.382–0.5 retracement pockets. The next immediate move is expected to be a grind-up continuation toward the short-term liquidity cluster at $0.214, where a sweep of short positions and stop-loss liquidations could trigger a fast expansion to $0.223–$0.228, followed by a bullish extension zone targeting $0.235–$0.255 in the medium term. On the downside, liquidation pressure remains stacked below $0.203 and especially at $0.198 and $0.187, meaning if the market wicks aggressively lower, it is likely a liquidity hunt rather than a structural reversal — as long as price reclaims the zone quickly. Whale footprint is firmly bullish: accumulation has been consistent inside $0.182–$0.20 and demand has followed price upward, while distribution levels show passive profit-taking expected near $0.217–$0.223 and heavier sell walls layered into the $0.245–$0.26 range, meaning any breakout into these levels can trigger short-term volatility but should not be interpreted as a cycle top. Accordingly, the optimal execution plan remains buying dips into $0.203–$0.207 with risk defined below $0.198, targeting $0.214 → $0.223 → $0.245+ and scaling profits progressively while keeping a core long position for a potential cycle expansion toward $0.43 and beyond. This setup remains valid as long as HBAR does not close a daily candle below $0.198, and a panic invalidation trigger only activates on a structural failure beneath $0.182, which would temporarily shift structure into a corrective ABC pullback rather than a trend continuation. Until then, market structure, liquidity behavior, momentum indicators, and institutional flow remain aligned to the upside.HBAR Updated Institutional Price Narrative HBAR completed a textbook liquidity-driven correction after the impulsive breakout from the $0.18 zone, dipping below the previously defended $0.203–$0.207 support to sweep liquidity into the deeper demand pocket at $0.192–$0.187, exactly where large delta absorption and spot accumulation re-engaged. This move confirms that the earlier base was not a failure but a controlled liquidity harvest engineered to flush late longs and force inefficient liquidations before the next leg higher. The reaction from the $0.19 handle has been technically clean: order-flow charts show clear bullish CVD divergence, footprint data reveals aggressive passive absorption on red prints, and OBV stabilized instead of breaking trend — classic signs that smart money bought into forced selling. Momentum reset on lower timeframes without breaking HTF structure, which is exactly what healthy mid-trend pullbacks look like during expansion phases. More importantly, structural integrity was never violated: the higher-low sequence remains valid, the 4H cloud held, and price continues to trade inside the corrective box of Wave (4), preparing for a fresh Wave (5) extension leg. This pullback also aligns perfectly with Fibonacci symmetry, tagging the 0.5–0.618 retracement zone of the prior leg, which institutions frequently program bids into during trend continuation phases. Liquidity behavior confirms the next targets: short liquidations remain stacked at $0.204 → $0.214 → $0.223, meaning every micro reclaim is likely to accelerate price via stop-cascade mechanics. Above $0.223, a low-liquidity pocket runs into $0.235–$0.255, where the real breakout battle will happen. Whale maps still show no meaningful distribution at current levels — accumulation clusters remain concentrated between $0.182–$0.20, with supply signals only beginning above $0.245 and more aggressively near $0.26–$0.28**, indicating this pullback was engineered liquidity intake, not a top. From an execution standpoint, the correct play remains buying controlled dips into demand, not chasing green candles. Traders who bought the sweep into $0.19 executed optimally, but opportunity still exists as long as price remains above $0.188–$0.19 and especially above $0.183, the structural line defending the macro bullish bias. Any fast wick below $0.19 again would likely be another liquidity hunt rather than a reversal, provided the reclaim is immediate and accompanied by renewed CVD strength. As long as price holds above $0.183, this remains a continuation cycle.