Technical analysis by keyvankho about Symbol SOL: Buy recommendation (11/20/2025)

keyvankho
پیشبینی دقیق حرکت قیمت سولانا (SOL): اهداف صعودی کوتاهمدت تا بلندمدت
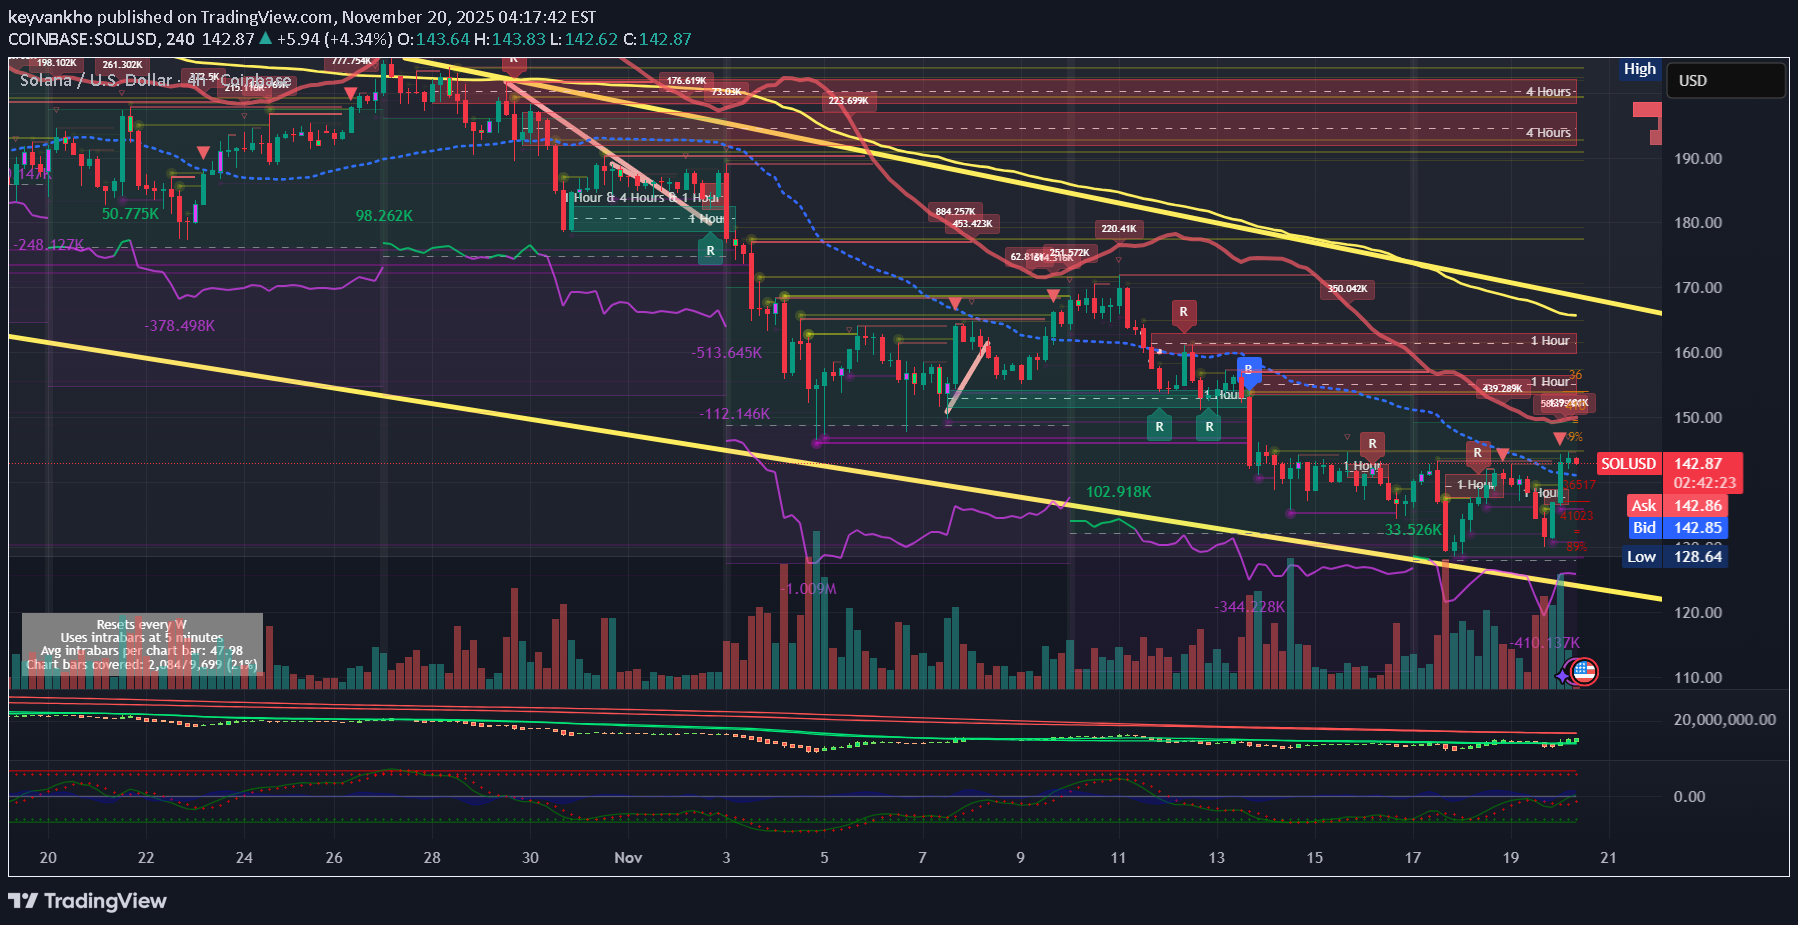
1) SHORT-TERM PRICE MOVEMENT (Next 6–18 hours) SOL is currently consolidating after the breakout from the $136–$138 zone. The short-term structure across 15m/1h shows a healthy cooldown phase, not a reversal. Momentum is still positive, OBV is rising, and delta shows seller absorption around $142–$143. Price is expected to dip into the micro demand zone at $140.2–$141.5, fill remaining liquidity pockets, and then attempt a re-push into the $144.5–$145 range. As long as $139.8–$140.5 holds, the short-term bias is bullish continuation. Short-term expectation: Range → small dip → continuation upward Immediate upside tag: $144.5 → $145.7 2) MID-TERM PRICE MOVEMENT (1–3 days) The current market structure on 1H/4H shows a transition from CHoCH to early SMS. When SOL forms this pattern after a deep liquidity sweep, the next wave usually targets the nearest FVG and inefficiency levels. The next magnets are: $147.5 (first liquidity pool) $150.2–$151.3 (major inefficiency fill) $153.0 (HTF fib cluster + supply touch) Mid-term bias remains bullish unless the $135 OB is broken. Mid-term expectation: $147.5 → $150 → $153 zone in sequence 3) HIGH-TIMEFRAME PRICE MOVEMENT (4–10 days) The daily falling wedge bottom has been tapped. This wedge historically produces a multi-day bullish expansion once mid-structure flips. The next HTF level — and the one that decides the trend — sits at $156–$160, which matches the top wedge boundary, VPVR high-volume node, and macro resistance. If SOL clears this region with strong candle bodies, a full HTF trend reversal will occur, opening the way to: $165–$168 (HTF extension) $178 (1.618 HTF fib) If it rejects the $156–$160 range, it will retrace back to $147–$150 before the next attempt. HTF expectation: Primary target: $156–$160 Break → $165–$168 Full breakout → $178 LIQUIDATION & LEVERAGE MAP (Kingfisher-style projection) Below Price Light clusters at $141.2 Medium shelves at $139.6 Large cluster at $136.8–$137.4 Deep liquidity at $134.5–$135.3 If any bearish wick forms, price will likely stop at the first or second cluster ($140–$139.6). The heavy $135 zone is the “max pain” level and unlikely to be revisited unless Bitcoin breaks structure. Above Price Significant liquidation pool at $145.8–$147.5 Heavy cluster at $150.5 Massive build-up at $153.2–$154.4 Final HTF liquidation pocket at $156.5–$158 These will act as magnets during any bullish breakout. WHALE MAP (CVD & VPVR Projection) Whale behavior (from your delta charts + VPVR): Whales accumulated at $136–$138 (clear delta spikes) Absorption at $141–$143 (sellers trapped) Minimal whale sell walls until $150–$153 Heavy whale resting liquidity at $156 (profit-taking zone) Whale map direction: Upward toward $147 → $153 → $156 TRADE PLAN (Price-Movement Version) Direction: LONG Entry Zones Primary pullback entry: $140.2–$141.5 🔥🔥🔥Deep entry (if swept): $138.8–$139.6 🔥🔥🔥Breakout entry: Above $144.6 with retest 🔥🔥🔥Stop Loss 🔥🔥🔥Below $134.90 (Below OB, below liquidity shelves, below structure) Take Profit 🔥🔥TP1: $147.5 🔥🔥TP2: $150.6 🔥🔥TP3: $153.2 🔥🔥TP4 / Cycle: $156–$160 Risk–Reward 3.1R – 6.2R depending on entry Management 🔥🔥🔥🔥If price stalls at $147.5 → partial exit 🔥🔥🔥🔥If $150 rejects → expect pullback to $147 🔥🔥🔥🔥🔥If $156 is broken with volume → SOL begins macro reversal INVALIDATION 🚨🚨🚨🚨🚨🚨🚨The price-movement expectation becomes invalid if: SOL closes 1H below $134.90 OBV breaks demand-side trend RSI prints H-Bear divergence on 1H & 4H simultaneously BTC loses its mid-range and drops below $59k SOL loses the daily wedge lower boundary (< $128) Let me know what you think in the comments — your feedback helps me improve these analyses, and if you found this useful, a like or share would mean a lot.