
fxbeckz
@t_fxbeckz

What symbols does the trader recommend buying?
Purchase History
پیام های تریدر
Filter
fxbeckz
خرید بیت کوین نهایی شد: دلیل ورود و تحلیل فعال شدن سیگنال BTC
Broke down my reasoning for wanting to BUY BTC at this level in my previous post from yesterday about what I wanted to see happen before pulling the BUY Trade signal. It's now live and active. Let's see how this plays out.
fxbeckz
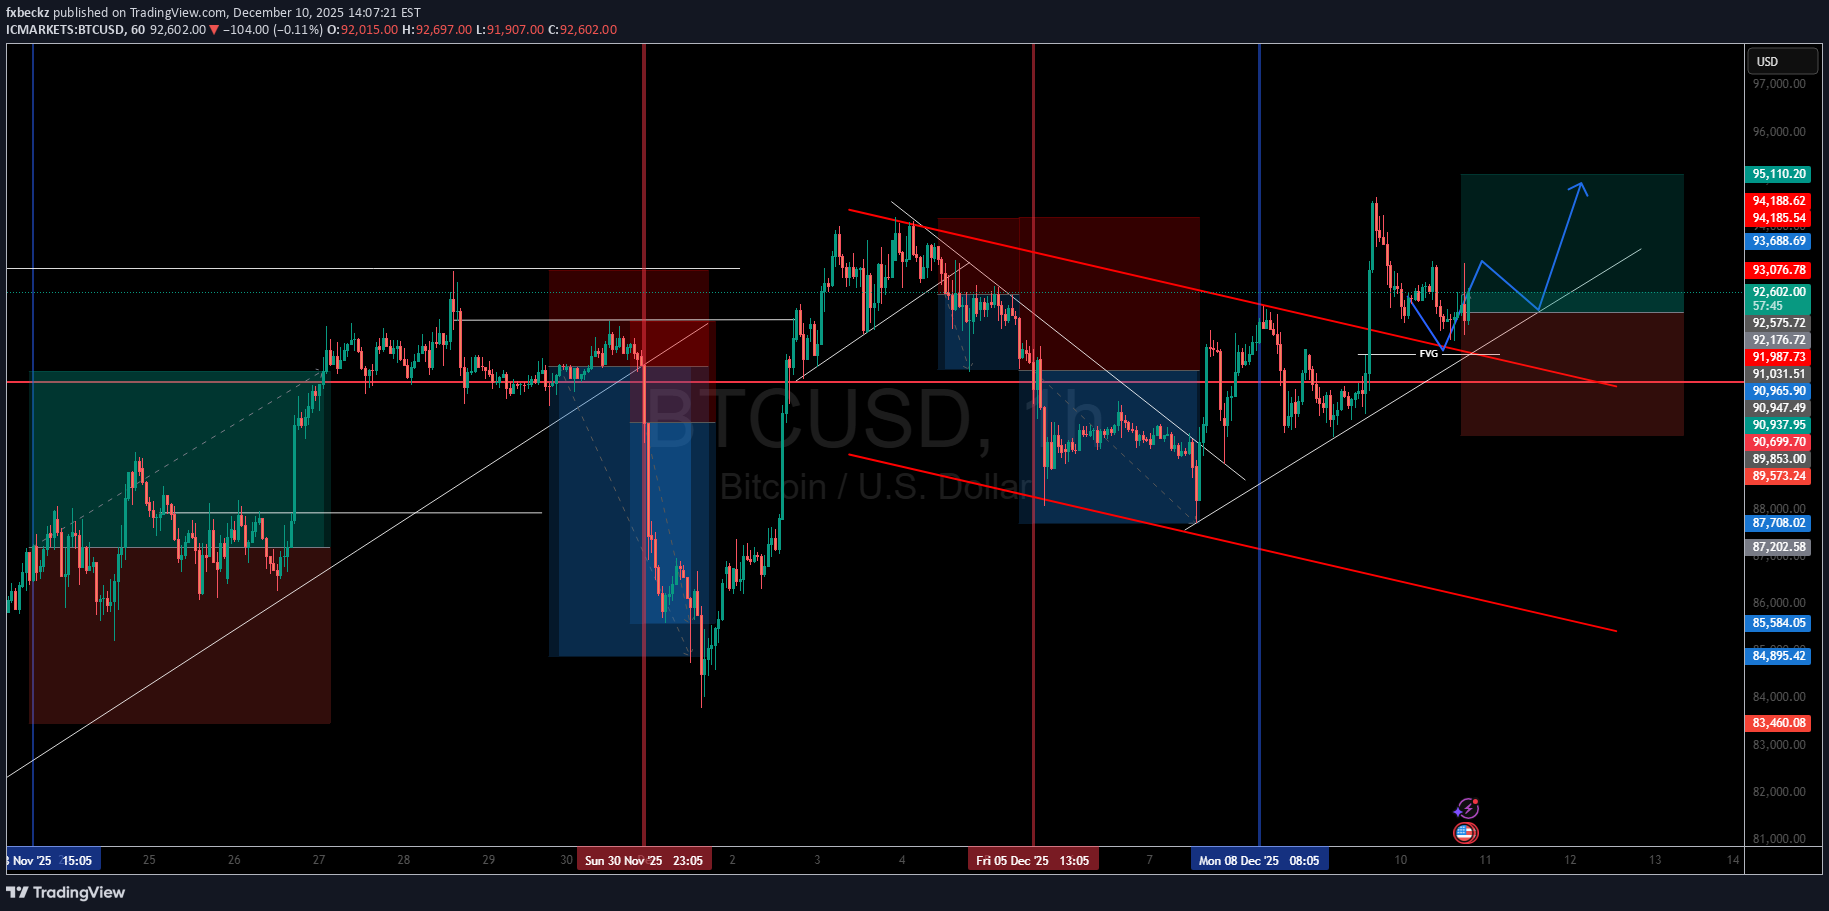
Why I’m Looking for Buys After a Pullback Into the GAP
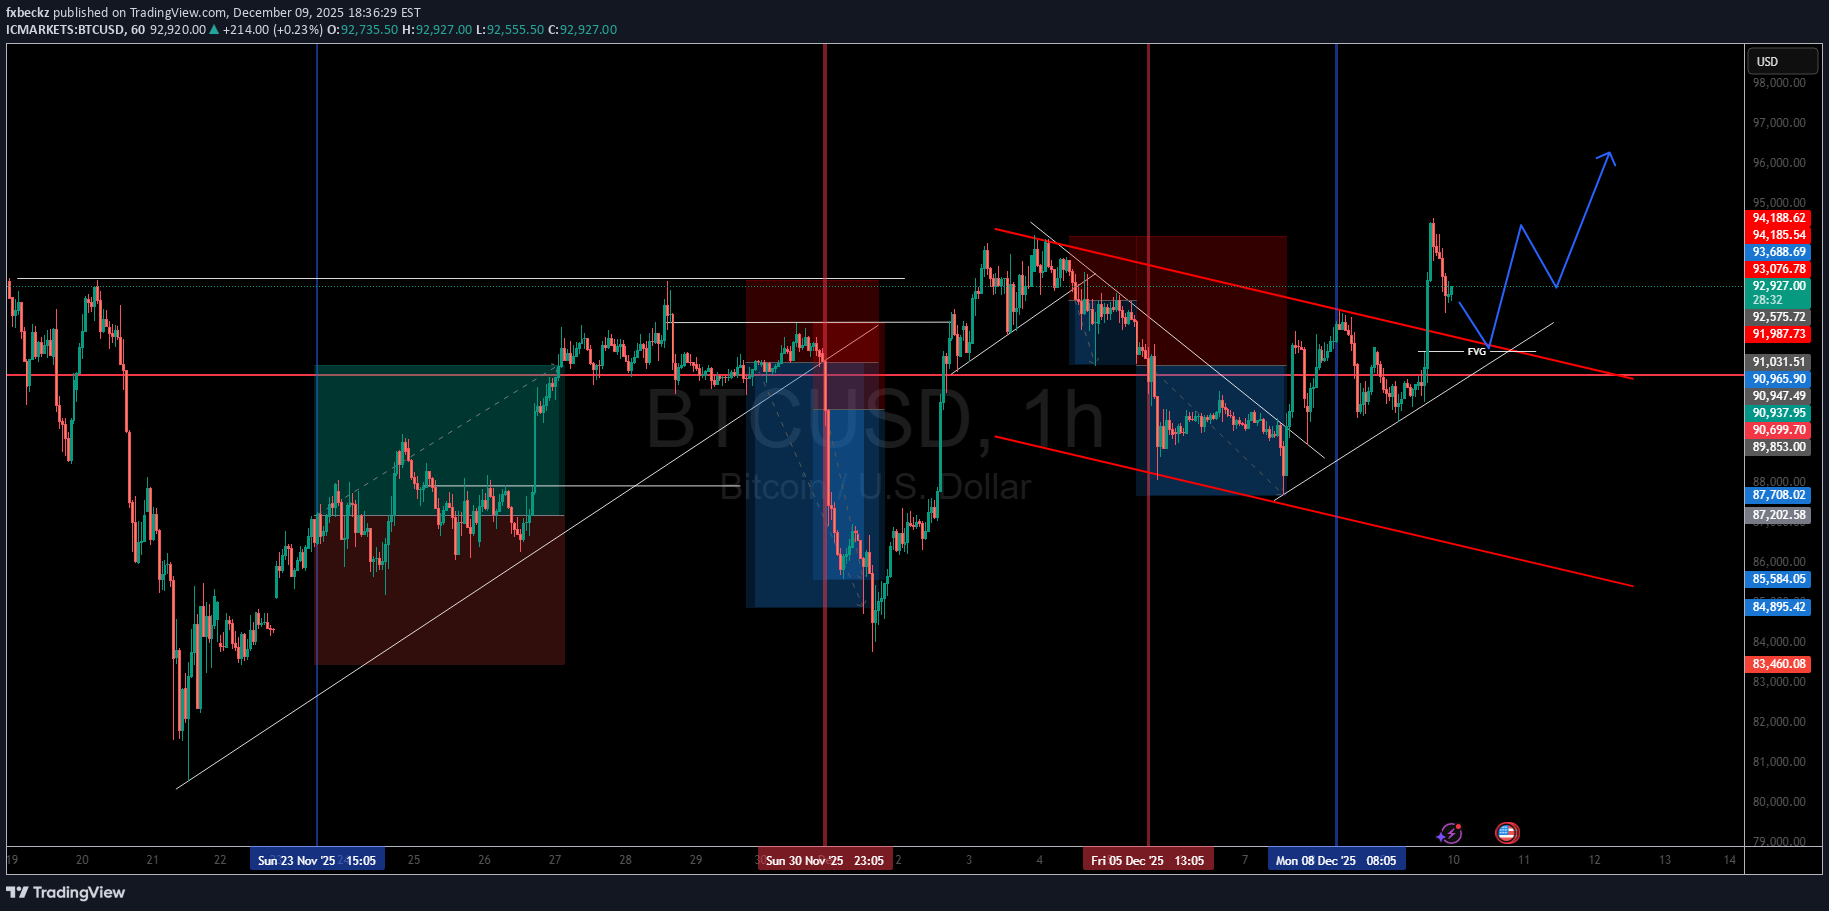
Let me walk you through the reasoning behind my bullish outlook on Bitcoin. The current structure is showing a clear transition from distribution into accumulation, and I want price to pull back into the imbalance before I engage in further longs. 1️⃣ The Market Completed a Full Distribution Cycle The left side of the chart shows a classic distribution: Liquidity engineered above the highs Trendline liquidity taken A decisive sell-off (displacement) down into a deeper discount area Strong reaction from a HTF demand zone This created the foundational low where institutional accumulation began. 2️⃣ Aggressive Reversal + Break of Structure The bullish impulse from the bottom is not retail-driven—it’s institutional. We can see: A massive displacement candle straight out of the lows Break of multiple internal structures on the way up A complete shift in orderflow from bearish to bullish This is the exact footprint of algorithmic repricing. Once that BOS printed, the market clearly signaled its intention to move higher. 3️⃣ Re-Accumulation Inside the Falling Channel After the initial breakout, BTC formed a falling channel—this is one of the cleanest re-accumulation patterns: Lower highs and lower lows designed to build liquidity Price respecting channel boundaries Final sweep toward the channel low before expansion This tells me institutions were accumulating long exposure while retail was selling the “bearish” channel. 4️⃣ Breakout Above the Channel = Confirmation of Bullish Expansion As soon as price broke above the descending structure, we saw: A bullish BOS A reclaim of previous support levels A run on buy-side liquidity above minor highs This breakout confirms that the re-accumulation is complete and expansion is underway. 5️⃣ Why I Want a Pullback Into the FVG (Fair Value Gap) Although price is bullish, I do not want to buy at the highs. I want to see: ➡️ A pullback into the M15/H1 imbalance (FVG) ➡️ Retest of the ascending structure ➡️ A reaction showing that demand is still active The gap represents: The origin of the displacement A discounted price zone for institutions The most efficient level for mitigation before continuation This is where smart money usually returns to rebalance before pushing higher. It’s not about chasing the move—it's about letting price come back to where the algorithm left unfilled orders. 6️⃣ Liquidity Path → Higher Targets Above current price, we have: Untapped buy-side liquidity Equal highs A clean inefficiency window The next premium pricing zone Everything above price is clean—and clean means magnet-like. This aligns perfectly with the projected bullish continuation path illustrated on your chart. 7️⃣ Summary — What I’m Expecting Next Here’s the sequence I want to see: Pullback into the FVG Respect for the ascending MS trendline Bullish reaction confirming accumulation Continuation toward the next liquidity pool above I’m not buying the breakout. I’m buying the retracement into imbalance, where smart money re-enters the market.
fxbeckz
چرا معاملهگران بزرگ روی خرید اتریوم (ETHUSD) شرط بستهاند؟ (راز ساختار بازار)
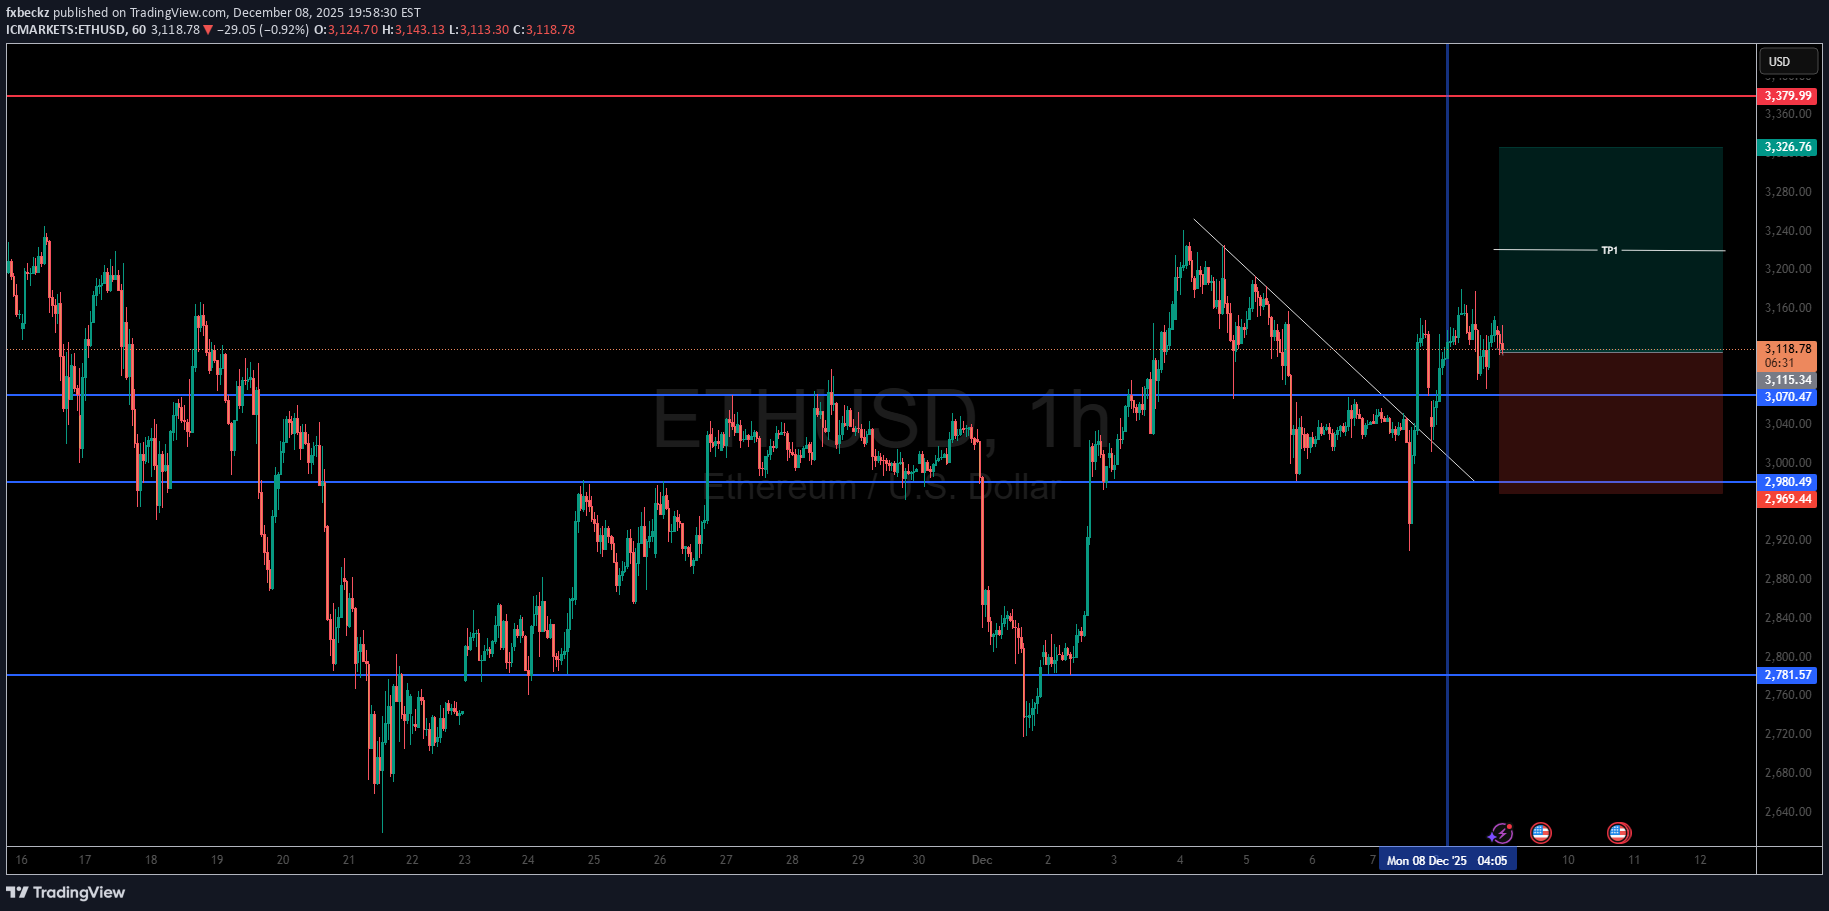
Let me walk you through why I’m positioned for buys on ETHUSD, and how the structure aligns with the institutional price-delivery model I’ve used for over a decade. 1️⃣ Higher-Timeframe Context — The Range Is Defined ETH is currently trading within a well-defined HTF range, with: A major supply zone above A clear liquidity shelf below Clean mid-range levels that are being actively traded Price has shown multiple rejections from the lower parts of the range, confirming that institutions are accumulating positions rather than distributing. 2️⃣ The Sell-Off Into Discount Was an Accumulation Phase The sharp drop you see on the left side wasn’t random — that was engineered liquidity, pulling price into a discount zone. Inside that drop, we see: A liquidity sweep of the equal lows A mitigation of a previous inefficiency A strong displacement candle back upward This is a textbook model of institutional accumulation before expansion. 3️⃣ Break of Structure ⇒ Transition Into a Bullish Cycle Once price completed the sweep of the lows, it immediately delivered: A strong BOS (Break of Structure) A shift from corrective pullbacks to impulsive bullish delivery Displacement candles clearing internal liquidity This is the exact transition signature that confirms the bearish phase has ended and the bullish phase is beginning. 4️⃣ The Trendline Break + Retest Confirms Institutional Buy-Side Delivery On your chart, the downward trendline acted as: A liquidity magnet A retail-based bearish structure trap An engineered point of interest for institutions to gather liquidity Price broke through this trendline aggressively, then pulled back to retest the underside of it. This retest wasn’t random — it was: A mitigation of the origin of the impulse A validation that sell-side liquidity below the trendline has been collected A high-probability higher-low formation This is exactly the kind of confluence I wait for in my own trades — break, retest, confirm. 5️⃣ Internal Structure Shows Clear Bullish Re-Accumulation After the breakout, the internal structure demonstrates: Higher highs and higher lows Bullish re-tests of key horizontal levels Reduced selling momentum after each pullback Imbalances being filled before continuation Everything about this structure suggests smart money is supporting the move upward. 6️⃣ Liquidity Pools Are Above Current Price — A Magnet for Continuation Above your entry zone, price has: Untapped buy-side liquidity Equal highs Clean inefficiency pockets A large unmitigated supply zone These areas represent targets for bullish delivery. Institutions don’t leave liquidity behind — they go collect it. 7️⃣ TP1 Matches Institutional POI Targeting TP1 lines up almost perfectly with: A prior structural high A liquidity pool A breaker block that price previously used as a reaction point This TP placement isn’t random — it’s aligned with the exact levels institutions target during expansions. It’s the first logical take-profit point before price reaches the major HTF supply above. 8️⃣ Summary — Why I’m Bullish on ETHUSD Here’s the institutional reasoning shaping my bias: HTF range defined → price trading near discount Lows swept → liquidity collected Strong BOS → bullish transition confirmed Trendline broken & retested → confluence for continuation Internal structure bullish → accumulation, not distribution Liquidity above → strong magnet for upward delivery TP1 aligns with liquidity + structural POI This is the same setup I’ve taken hundreds of times: accumulation → structural shift → breakout → retest → expansion.
fxbeckz
رمزگشایی طلای جهانی (XAUUSD): چرا برای یک حرکت صعودی بزرگ آماده میشوم؟
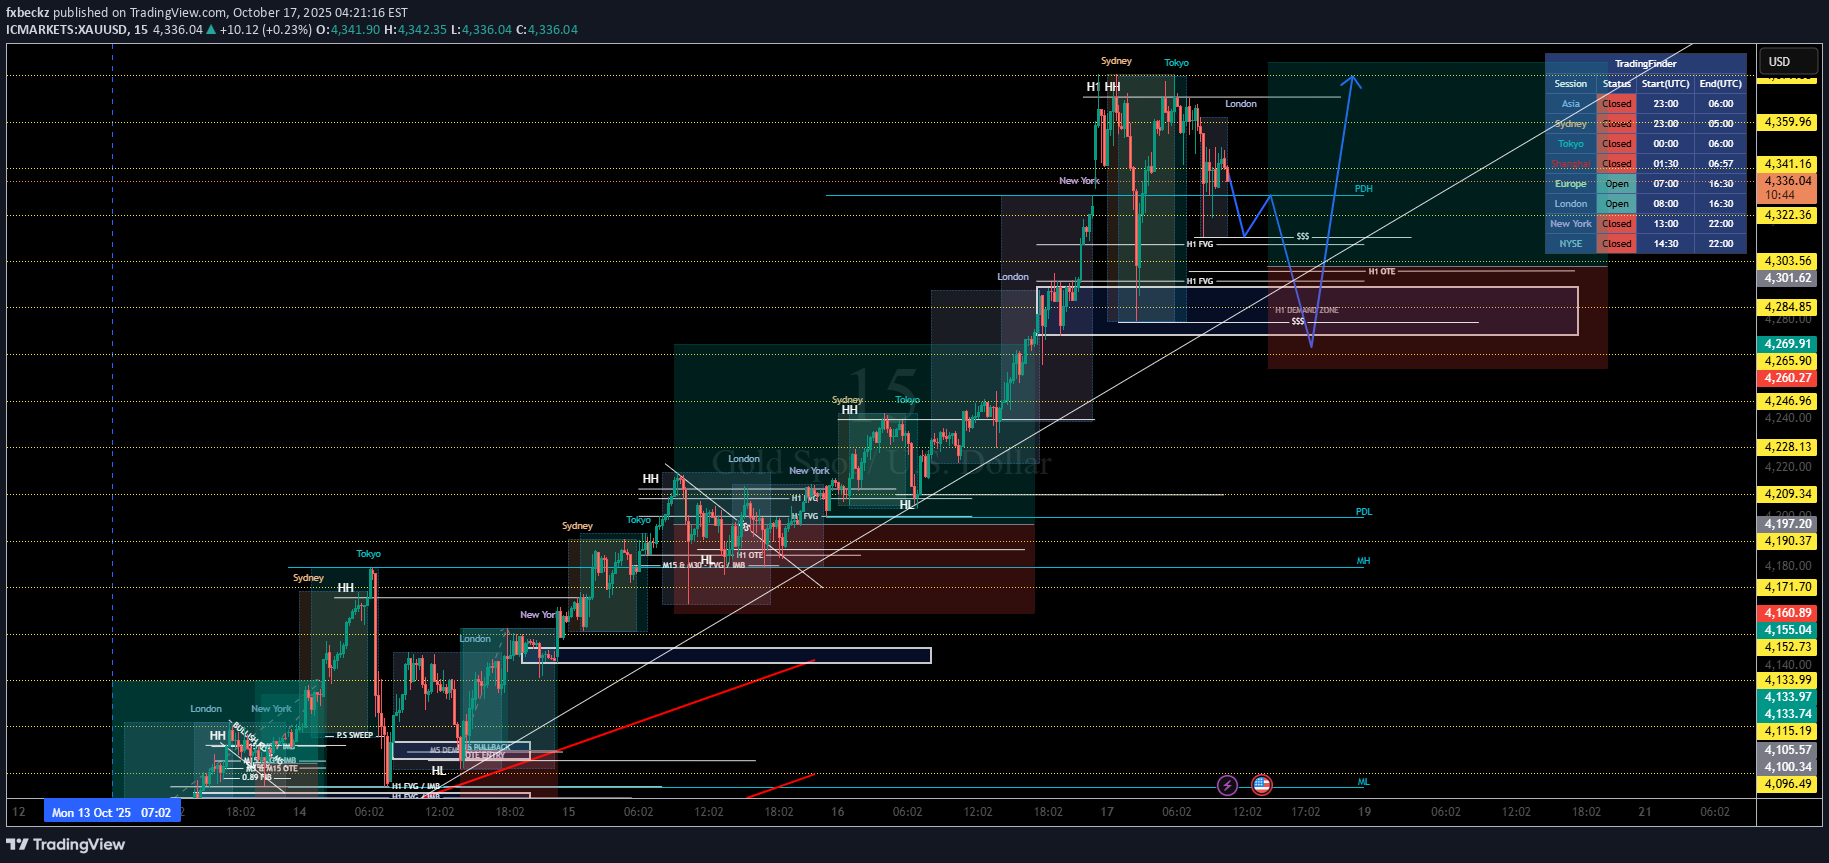
I’m not randomly calling buys here — the chart is clearly building the case for another bullish leg. Let me walk you through the logic behind the anticipation: 🔹 1. Overall Trend Structure Is Still Bullish Price has been consistently printing: Higher Highs (HH) Higher Lows (HL) Respecting the ascending trendline cleanly Until there’s a confirmed break of structure to the downside, my bias remains bullish. 🔹 2. Liquidity Sweep Above the Highs We’ve just seen a session-based liquidity sweep above the recent highs: No bearish follow-through Price is reacting but not reversing aggressively That sweep gives the algorithm liquidity to push higher once price rebalances. 🔹 3. Clean Pullback Zones Are Lined Up I’m not chasing price — I’m waiting for price to retrace deeper into: H1 Imbalance OTE Discount Zone Demand / Reaccumulation Block Previous structure support The red zone you marked aligns with: 61–79% retracement Structural demand Stop raid liquidity below That’s the kind of area smart money loves to load longs. 🔹 4. Still Untapped Buy-Side Liquidity Above Look at what rests above: Previous daily high (PDH) Session highs not fully cleared External liquidity pools waiting to be targeted The bullish delivery objective hasn’t been satisfied. 🔹 5. No Bearish Displacement or BOS Even after the sweep: No strong bearish displacement No market structure break Just corrective price action Until we see a clean shift down, the pullback is treated as accumulation. 🔹 6. Projected Delivery Model Your blue projection shows the exact logic: Liquidity grab ✅ Retracement into demand ✅ Reaction + continuation ✅ Final target = buy-side liquidity above ✅ This is textbook smart money buildup. ✅ Summary for Followers “The overall structure is still bullish, price has swept liquidity without breaking structure, and I’m waiting for a retracement into the H1 OTE/demand zone. Once price dips into that zone, I’ll be looking to take a long toward the external buy-side liquidity around and above PDH.”
fxbeckz
خرید طلا (XAUUSD): راز نگهداری و افزایش حجم در پوزیشن خرید بر اساس ساختار بازار
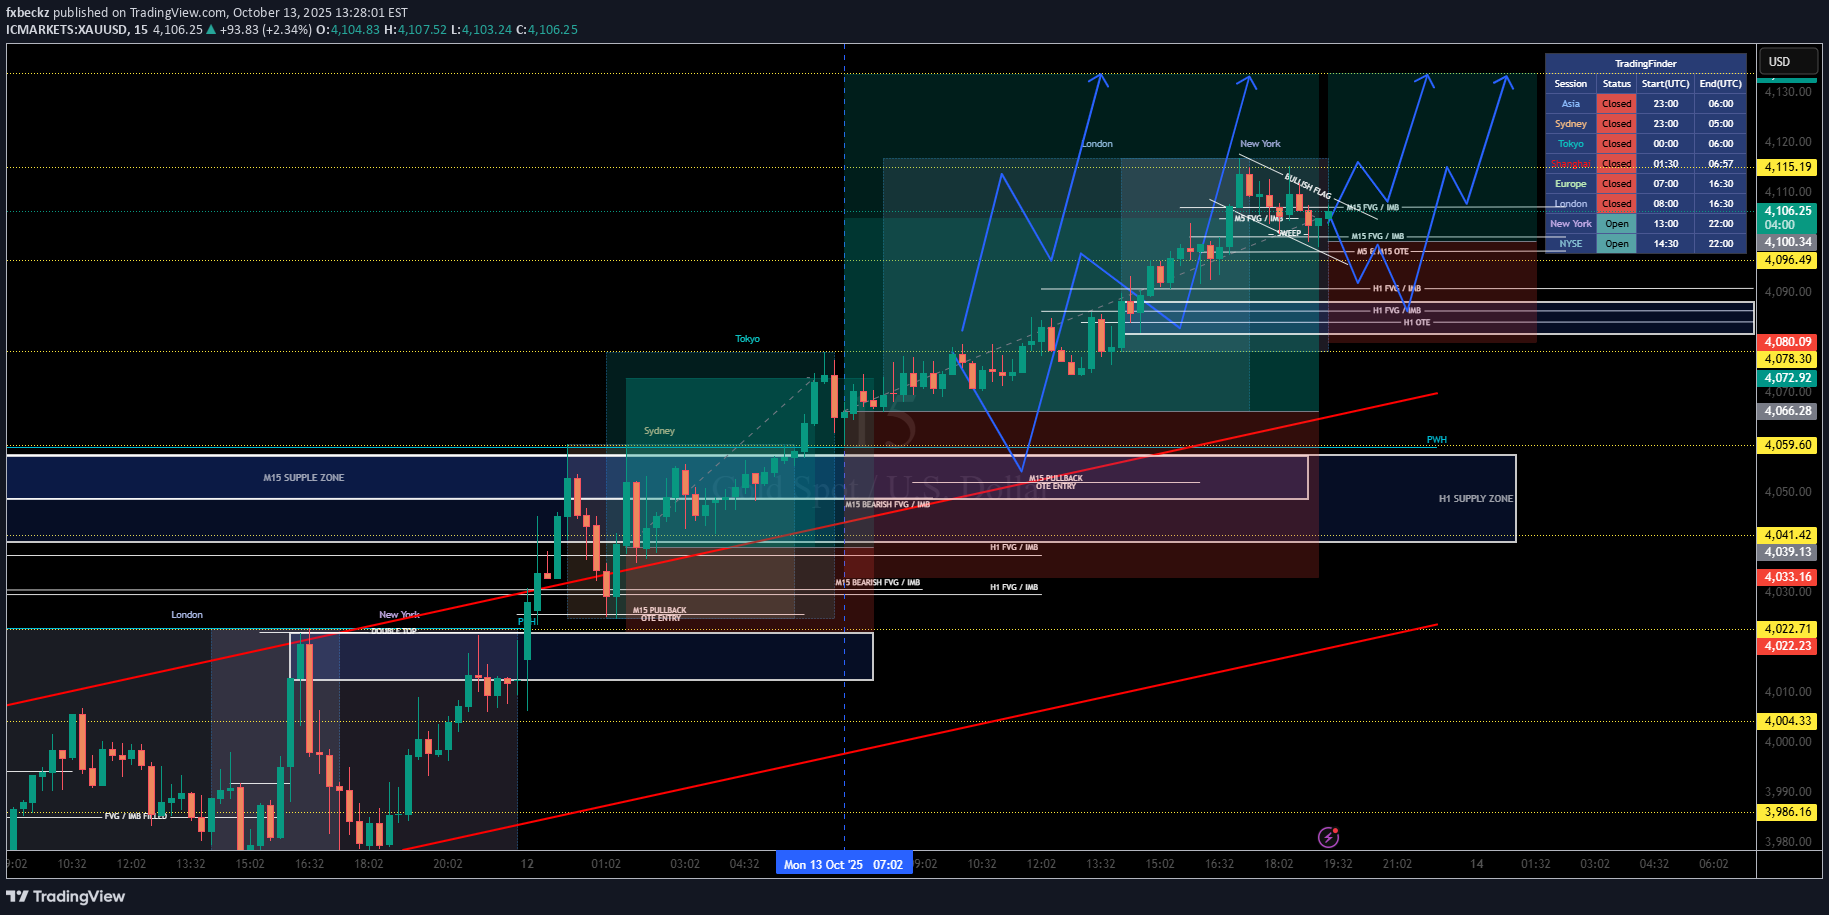
I’m currently still in this buy position on Gold and I’ve just scaled in again. Here’s exactly why I’m holding and adding to the trade based on structure, liquidity, and session behavior: 🔹 1. Market Structure is Still Bullish Price continues to respect higher-highs and higher-lows on the lower timeframe while maintaining alignment with the bullish higher timeframe narrative. Every pullback has been corrective, not impulsive — meaning buyers are still in control and there’s no structural break to the downside. 🔹 2. Multiple Layered OTE Entries (5m, 15m, H1) I scaled in because price tapped back into a confluence zone made up of: ✅ M5 OTE + IMB/FVG ✅ M15 OTE + Imbalance ✅ H1 OTE inside unfilled imbalance ✅ Prior supply flipped to demand This is not a random pullback — it's a premium entry inside a bullish leg. 🔹 3. Liquidity Sweeps Are Fueling Buyside Expansion Each session has been providing liquidity for continuations: Previous session highs/lows have been swept, not defended The latest internal sweep gave my trigger to scale in No meaningful rejection — just inducement for the next leg up The market keeps running engineered lows and building clean highs — that's a classic continuation model. 🔹 4. Bull Flag / Consolidation Before Expansion Price is currently forming a bullish flag structure just under liquidity. The internal corrective channel is holding bullish order flow, not signaling reversal. I’m not exiting because: No displacement to the downside No BOS against my direction Buyers are accumulating, not exiting 🔹 5. Untapped Buy-Side Liquidity Above I’m still holding and scaling because price hasn't cleared: Session highs The swing equal highs above Higher timeframe liquidity pools My projected path (blue arrows) outlines the delivery — not randomness, but algorithmic targeting of external liquidity. 🔹 6. My Stop and Risk Are Already Protected I’m not scaling emotionally — the stop sits below: The last valid swing low Multi-timeframe OTE/FVG confluence Bullish structure floor I’m only adding where my invalidation point doesn’t change. ✅ Why I'm Holding + Scaling In “The bullish structure hasn’t broken, liquidity is still being engineered to the upside, every pullback is an OTE into imbalanced areas, and the flag is a continuation pattern. Until we break below the key invalidation zone, I’m staying in and compounding.”
fxbeckz
تحلیل طلا (XAUUSD): ورود به معامله خرید با پتانسیل سود ۱.۶۶٪
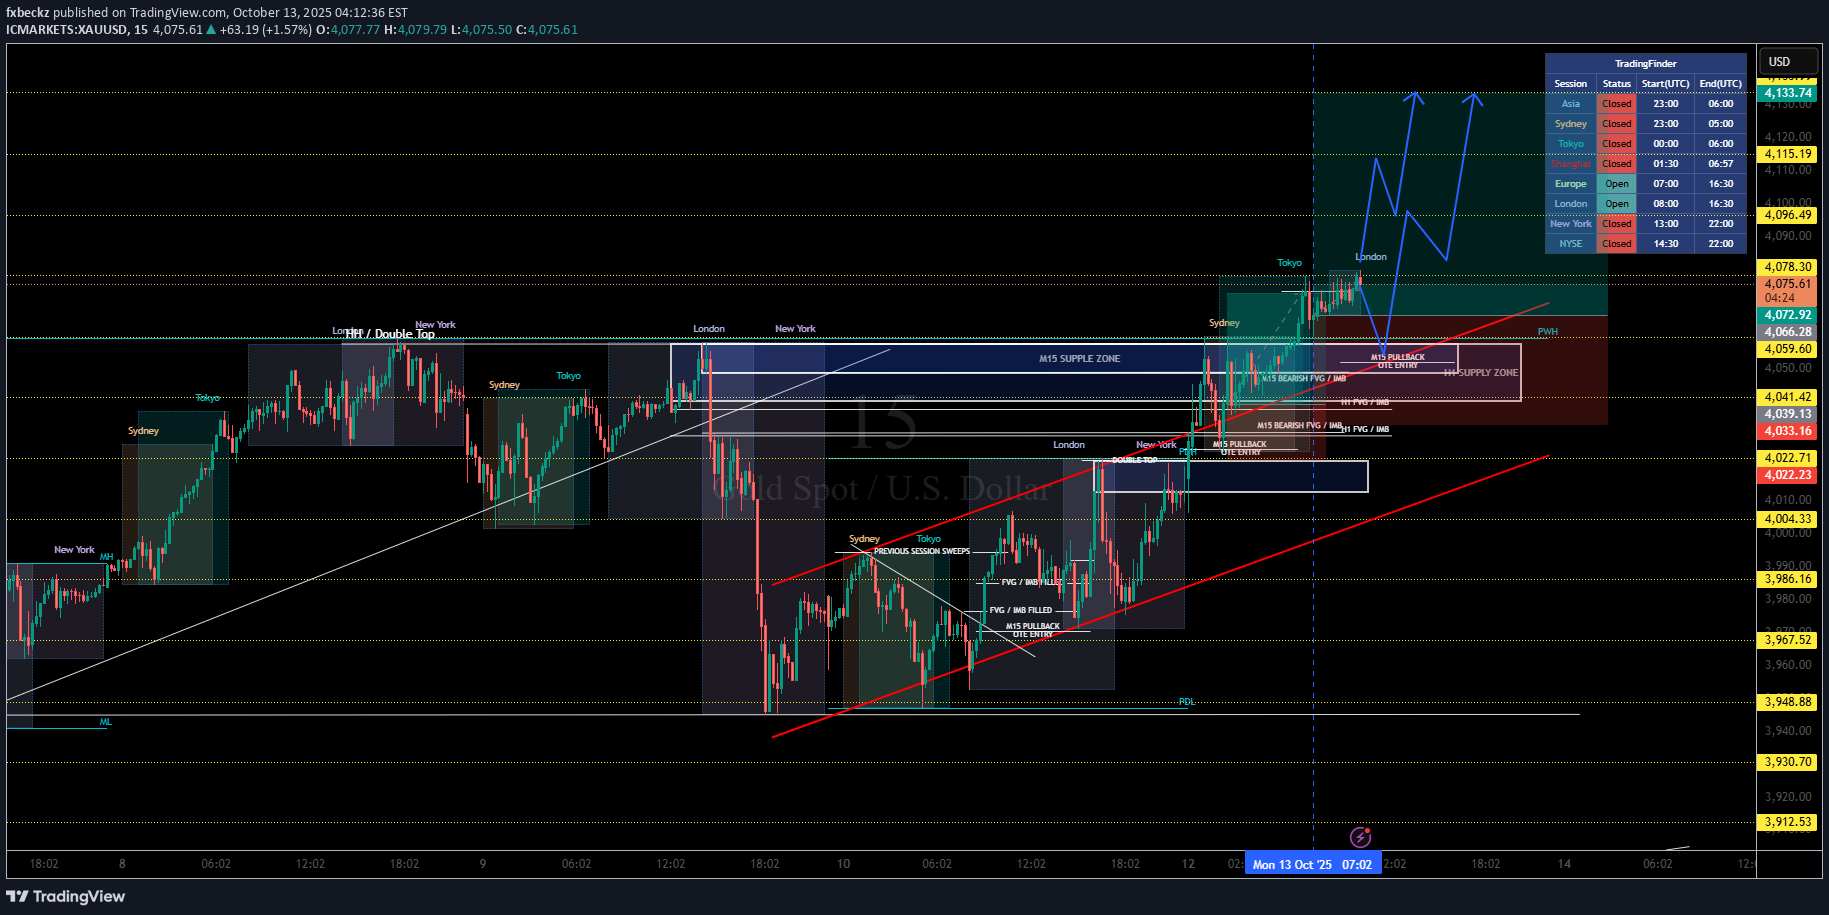
✅ 1. Major Market Context Previous High Liquidity Sweep There was a London/New York double top near the top of the chart. Price swept that liquidity and then dumped impulsively. This forms a strong M15 supply zone (highlighted in blue). That zone is where price has since reacted and retraced down before forming a new structure. ✅ 2. Bullish Structure Shift After the Drop After the liquidity grab and dump: Price began forming higher highs and higher lows inside a rising channel (drawn in red trendlines). Multiple FVGs and IMBs (Imbalances) filled during the climb. I’ve clearly marked: M15 pullback OTE entries (optimal trade entries). Previous session sweeps (Sydney, Tokyo, London). This entire structure supports a bullish continuation narrative. ✅ 3. Key Bullish Confluences Here’s why the long bias makes sense: 🔹 PDL Sweep Price swept the Previous Day Low before reversing up. Classic liquidity grab before trend continuation. 🔹 Trendline Support The red ascending trendline is acting as dynamic support. Multiple taps, confirming buyer presence. 🔹 FVG + IMB Rejections Several fair value gaps + imbalances have been filled and respected. These align with your entry zones. 🔹 M15 Supply Tested & Reclaimed Price dipped into the former supply zone and broke above it. That old supply now acts as demand on retests. ✅ 4. Active Trade Details I'm currently in a long position, and here are the key stats shown on chart: Risk-to-Reward Ratio: 2.04 Stop Loss: ~33.12 points (0.81%) This trade aligns with: Structure Imbalances Session liquidity behavior Trend direction ✅ 5. Target Zones 🎯 Target Zone (Marked in Green Box) Price projection is split into two impulsive legs (blue path illustration). The labeled target is: 67.46 points (1.66%) This aligns with: PWH (Previous Week High) Clean buy-side liquidity Unresolved imbalances above ✅ 6. Bearish Risk Area (Red Zone) Marked below my entry: M15 bearish FVG / IMB Supply zone retest If price breaks and closes below trendline + that red block, structure shifts bearish. The SL is correctly placed below: Trendline Last accumulation Key IMB + OTE entry area This keeps your setup protected without overcrowding risk. ✅ 7. Final Outlook Bias: Bullish continuation As long as: Trendline holds Price respects the reclaimed supply-turned-demand No clean break below SL zone
fxbeckz
آماده کسب سود؟ راز فروش طلا (XAUUSD) در این ساختار معاملاتی مخفی شد!
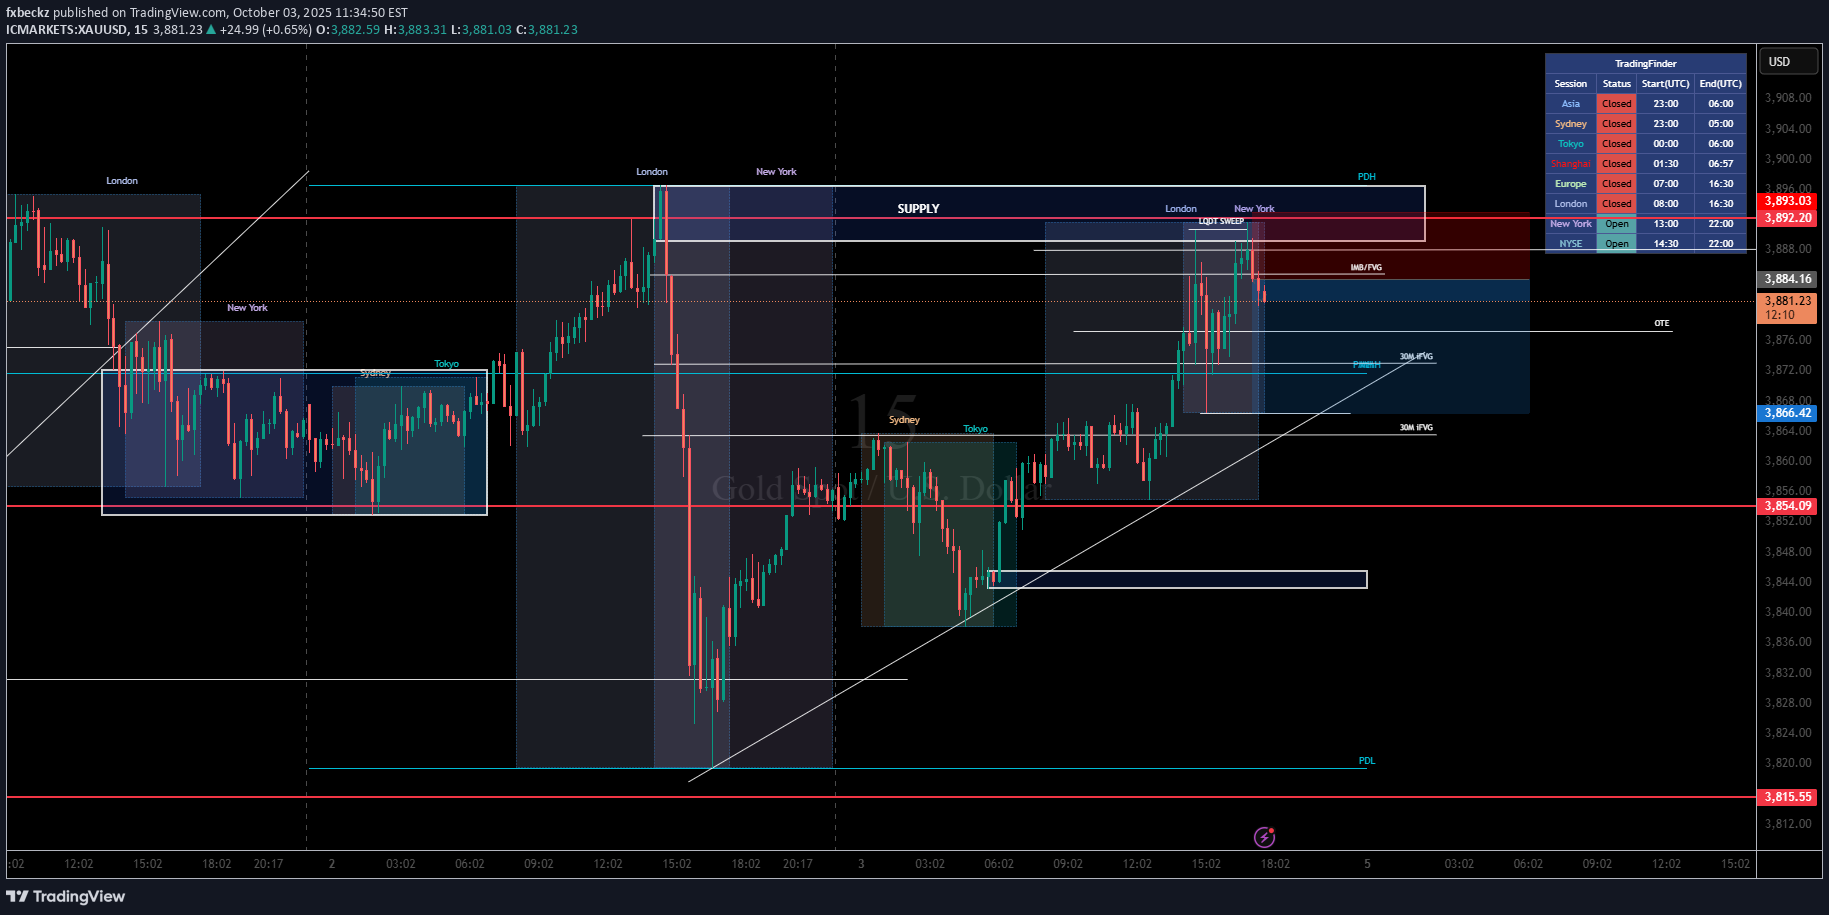
1. Supply Zone Clearly marked supply zone at the top of the chart (where price is currently reacting). Context: This area was created after a strong move down, making it a valid institutional supply area. Reaction: Price has tapped into that zone and is showing rejection — a great signal that smart money could be distributing here. ✅ Lesson: Always sell from premium zones when HTF context supports it. 🔁 2. Liquidity Sweep (LO/NY Highs Taken) I've labeled a "LQDT SWEEP", which shows price ran the liquidity (equal highs) formed during London/New York session. Why it matters: This is classic smart money behavior — run the highs to induce breakout buyers, then reverse. Consequence: After liquidity is taken, smart money often repositions in the opposite direction. ✅ Lesson: Never chase breakouts blindly. When liquidity is swept near a key supply zone, it’s time to think reversal. 🟥 3. Market Structure Shift (MSS) After the sweep, price makes a lower high and begins forming lower lows — a shift from bullish to bearish structure on this 15M TF. I’ve marked an imbalance/FVG just below the supply — acting as a key entry point for institutional sells. ✅ Lesson: Combine structural shifts with supply zones and liquidity sweeps for a high-probability short setup. ⛽ 4. Entry at Premium (FVG + OTE Confluence) I've got FVGs marked out (30M & 15M) and my Optimal Trade Entry (OTE) zone aligns perfectly below price. Price is rejecting this premium area, offering you the best risk-to-reward entry. ✅ Lesson: Never sell in the middle of a range. Wait for price to come into a premium (above equilibrium), then confirm. 📊 5. Session Context (Time of Day Matters) I'm tracking sessions smartly — price swept the highs during London/early New York, the most liquid and manipulative time. Why it matters: This is when banks and algos move the market. Reversal setups during this window — especially after liquidity grabs — are more reliable. ✅ Lesson: Not all setups are equal — the time of day adds major weight to your bias. 📉 6. Clean Targets Below Imbalance below Demand zone / FVG PDL (Previous Day’s Low) These are perfect draw-on-liquidity targets for this short. ✅ Lesson: Know where the market is likely to go, not just where to enter. 🔥 Final Tip: If price breaks below the FVG and closes under the OTE zone with momentum, consider adding to the position or moving SL to breakeven. If it reclaims the highs again, cut the loss quickly — no stubborn trading.
fxbeckz
سیگنال فروش طلا (XAUUSD): دام اسمارت مانی برای ریزش بزرگ!
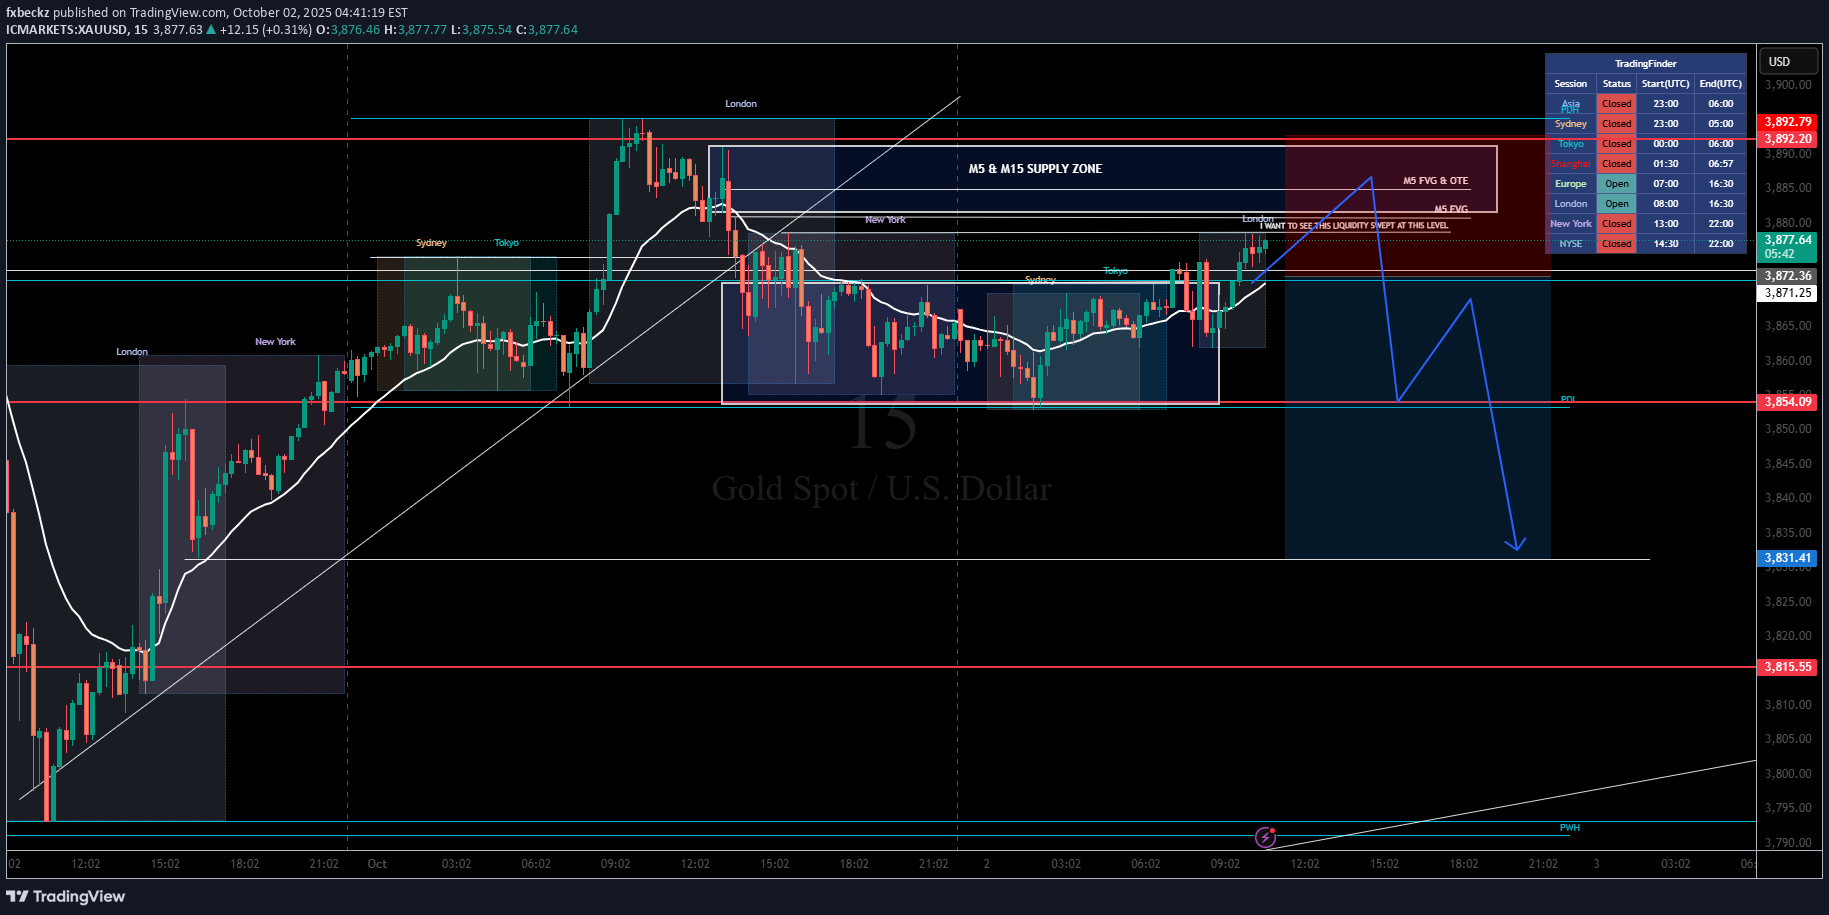
✅ Key Reasons for Expecting a SELL: 1. M5 & M15 Supply Zone Confluence The price is entering a strong supply zone marked by M5 and M15 confirmations, which shows prior aggressive selling. These zones are historically where institutions or smart money have entered large sell positions. A return to this zone often leads to a reaction as new sell orders are triggered and previous positions are reloaded. Note: “I WANT TO SEE IF HIS LIQUIDITY IS SWEPT AT THIS LEVEL” — and it has been. Liquidity above previous highs (buy stops) to be swept, trapping breakout buyers. Liquidity grab often precedes a market reversal — it’s a classic smart money move to engineer liquidity for better short entries. 3. Fair Value Gap (FVG) + Optimal Trade Entry (OTE) There's an M5 Fair Value Gap (FVG) within the supply zone, indicating imbalance. Price filled this FVG (inefficiency corrected), and is now expected to reverse. OTE (Optimal Trade Entry) in the premium zone supports this as a high-probability short area. 4. Displacement + Lower Timeframe Structure Break If you zoom in, you’ll see micro breaks of structure (BOS) forming. These breaks suggest weakening bullish momentum and early signs of bearish pressure building. 5. Trading Session Timing (London + NY Open) High volatility sessions (London/NY overlap) are ideal for smart money moves. Institutions love to reverse price during these windows to catch traders offside. Chart shows this pattern repeating during previous sessions. 6. Projected Move Based on Liquidity Targets The drawn-out blue arrow shows a projection toward: 3,854.09 (intraday support) Then 3,831.41 (deeper liquidity pool) Eventually toward 3,815.55, where previous demand sits. This projection aligns with liquidity engineering principles — price often seeks out where the most orders are stacked (liquidity pools). 🧠 Professional Insight "Don't chase the move, anticipate the trap." I expect price to manipulate up into premium pricing, sweep liquidity, and then deliver downside movement — classic smart money reversal behavior. 📌 Entry, Stop, and Target (Ideal Setup) Entry: Within M5/M15 Supply Zone after sweep and rejection Stop Loss: Just above the supply zone / last swing high Targets: First TP: 3,854.09 (structure support) Second TP: 3,831.41 (liquidity zone) Final TP: 3,815.55 (demand re-entry or continuation point) Final Note: If price breaks and closes above SUPPLY ZONE, the SELL will be invalid and also keep an eye if theres any upcoming fundamentals that may disrupt trade entry.
fxbeckz
XAUUSD H4 TF BULLISH
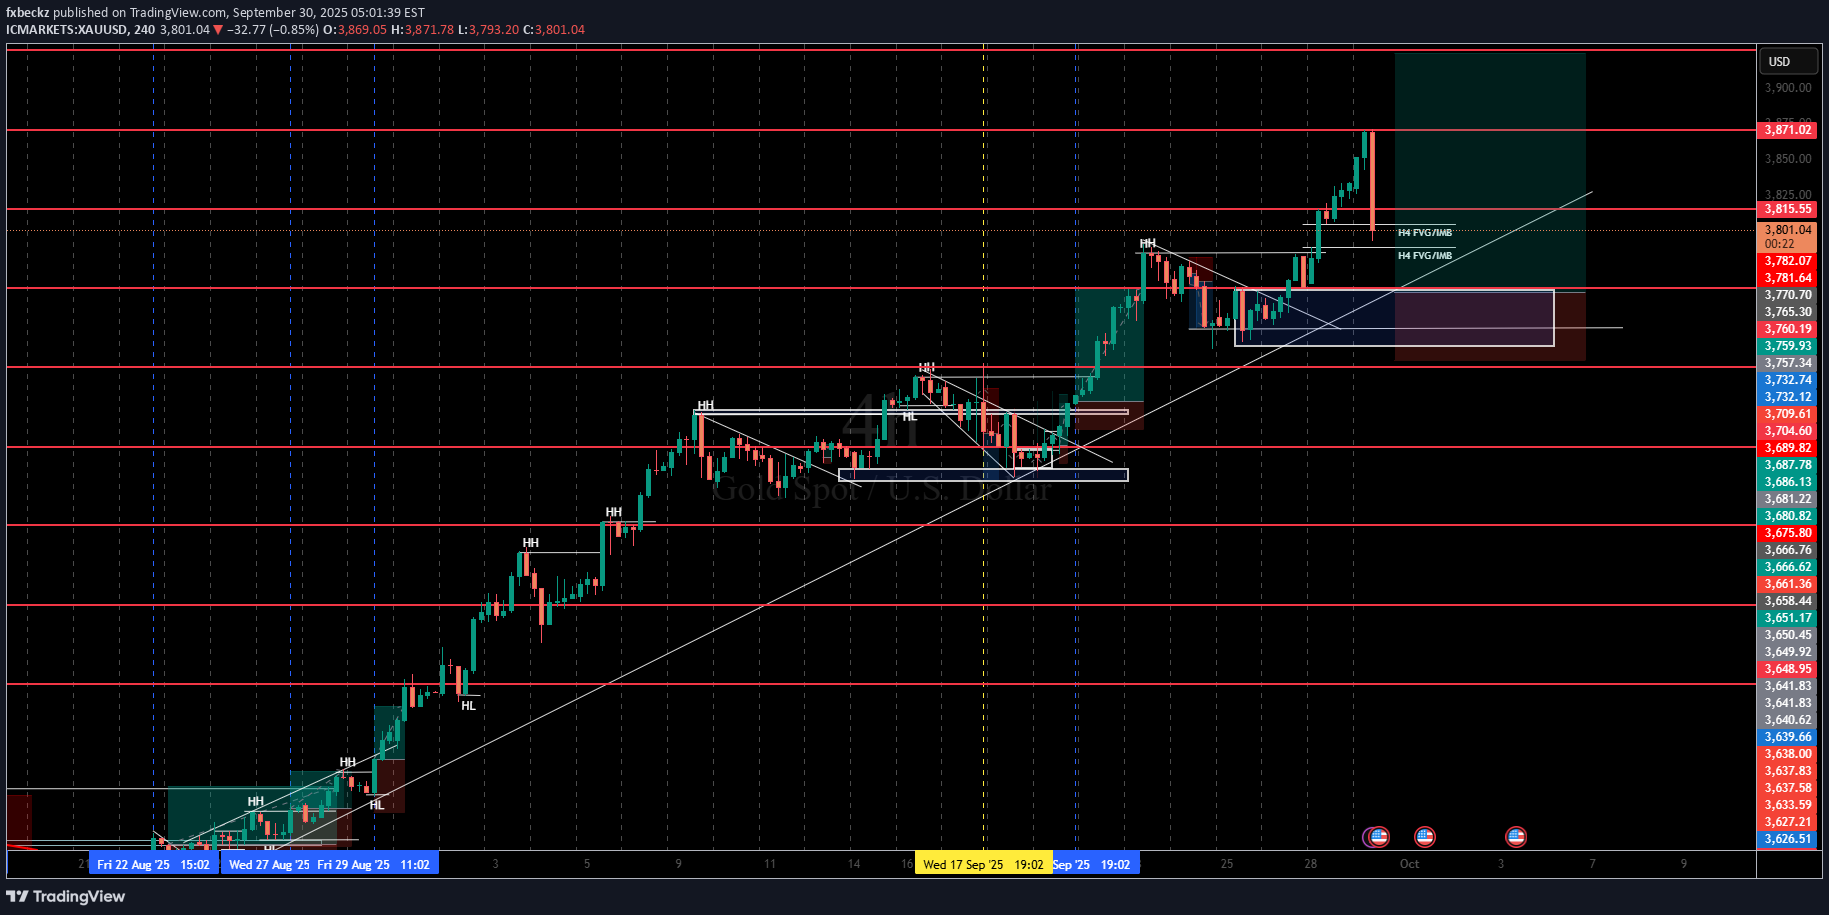
🧭 1. Directional Bias: Bullish Higher timeframe (HTF) structure is clearly in a strong uptrend: Consistent Higher Highs (HH) and Higher Lows (HL) are printed on the chart. Pice has respected ascending trendlines. The most recent break of structure confirms bullish momentum continuation. This is the first thing I look at: "Am I trading with the trend, or against it? I don't argue with structure." ✅ I'm trading with the dominant HTF momentum — smart move. 🧱 2. Demand Zone + Fair Value Gap (FVG)/Imbalance Confluence A clear H4 FVG/Imbalance between ~3765 and ~3787 That overlaps with a structural support zone / demand area Trendline support is also sloping up into this zone i'm not buying into extended price, i'm waiting for a discounted entry into demand, where: Buyers previously stepped in aggressively Liquidity (sells into demand) can be used to fuel longs Thought Process: “If I were an institution, I’d want to accumulate in this FVG at a discount after breaking structure — and that’s exactly where I’ll position myself.” 🔍 3. Break of Structure = Confirmation of Intent Price previously consolidated, then: Broke above a previous HH Left behind imbalance and demand Now retracing back for a retest This is classic market maker behavior: Break structure Create imbalance Retrace to demand Continue the move I'm planning to enter on the retrace, not chasing the breakout. 🛡 4. Risk Defined Precisely Stop-loss is placed below the demand zone and FVG, outside the “noise zone” My take profit is well above — at a clear level (potentially ATH or next resistance) I'm giving the trade room to breathe, while keeping R:R healthy — a minimum 2:1 looks likely here. Note: “If the trade fails, it means structure is invalidated, not just noise. I don’t want to be stopped on wicks.” 🔺 5. Liquidity Logic I'm showing you clear understanding of liquidity, not just technical levels: I'm not longing after impulsive moves — I'm waiting for liquidity to be built up and swept I'm entering after stop hunts, not before I'm thinking institutionally, not retail. Thought Process: “Where are weak hands positioned? Where are stops sitting? Where would smart money enter against them?”
fxbeckz
XAUUSD M15 BUY SETUP?
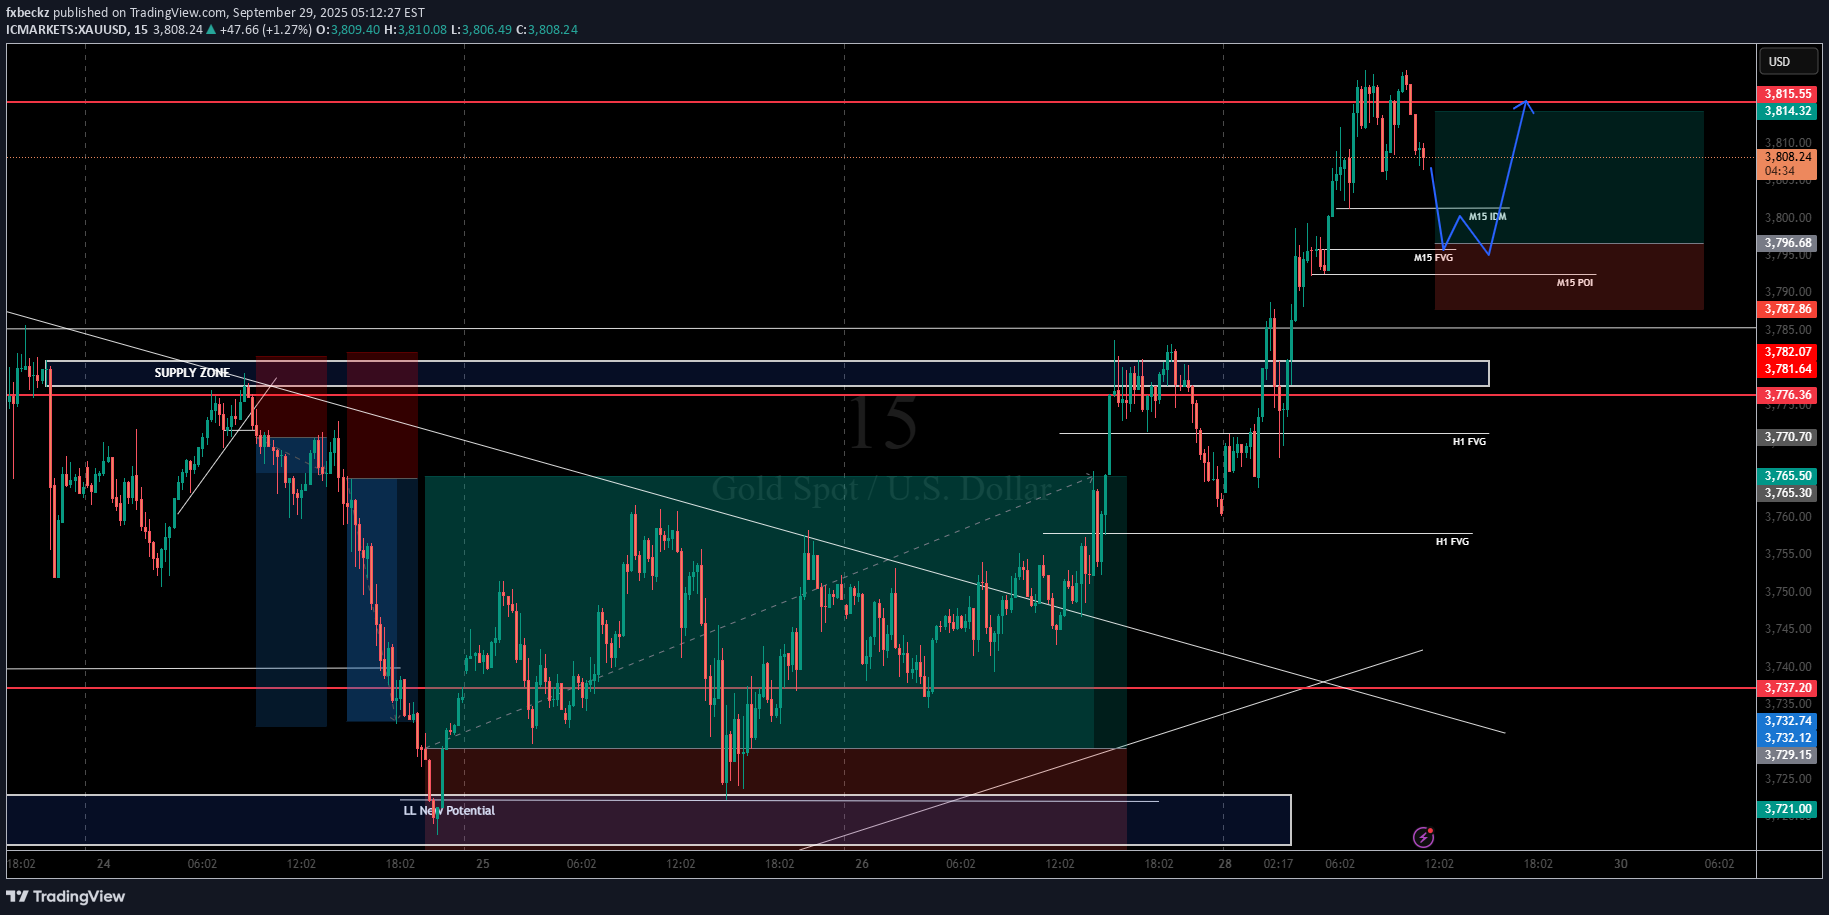
The market formed higher highs and higher lows, a hallmark of a bullish trend. Price pulled back after a strong bullish leg, and i'm aiming to buy the dip. Entry Around POI (Point of Interest) M15 FVG (Fair Value Gap) M15 IDM This indicates you're entering at a key demand zone or imbalance fill, expecting buyers to step in. Favorable Risk/Reward Setup Risk/Reward Ratio: 2:1 Entry is low in the retracement leg. Stop-loss is below the M15 POI and imbalance, protecting against deeper retracement. Target is set just before recent highs (3,814.32) — smart to exit before liquidity gets swept. Multiple H1 FVGs (Fair Value Gaps) below the current price could act as additional support. If price dips further, these could absorb selling and drive price back up — giving confluence for long bias. Previous Resistance Turned Support The broken supply zone could now act as support, creating a strong S/R flip. Price already tested it, suggesting demand is holding.
Disclaimer
Any content and materials included in Sahmeto's website and official communication channels are a compilation of personal opinions and analyses and are not binding. They do not constitute any recommendation for buying, selling, entering or exiting the stock market and cryptocurrency market. Also, all news and analyses included in the website and channels are merely republished information from official and unofficial domestic and foreign sources, and it is obvious that users of the said content are responsible for following up and ensuring the authenticity and accuracy of the materials. Therefore, while disclaiming responsibility, it is declared that the responsibility for any decision-making, action, and potential profit and loss in the capital market and cryptocurrency market lies with the trader.