Technical analysis by fxbeckz about Symbol ETH: Buy recommendation (12/9/2025)

fxbeckz
چرا معاملهگران بزرگ روی خرید اتریوم (ETHUSD) شرط بستهاند؟ (راز ساختار بازار)
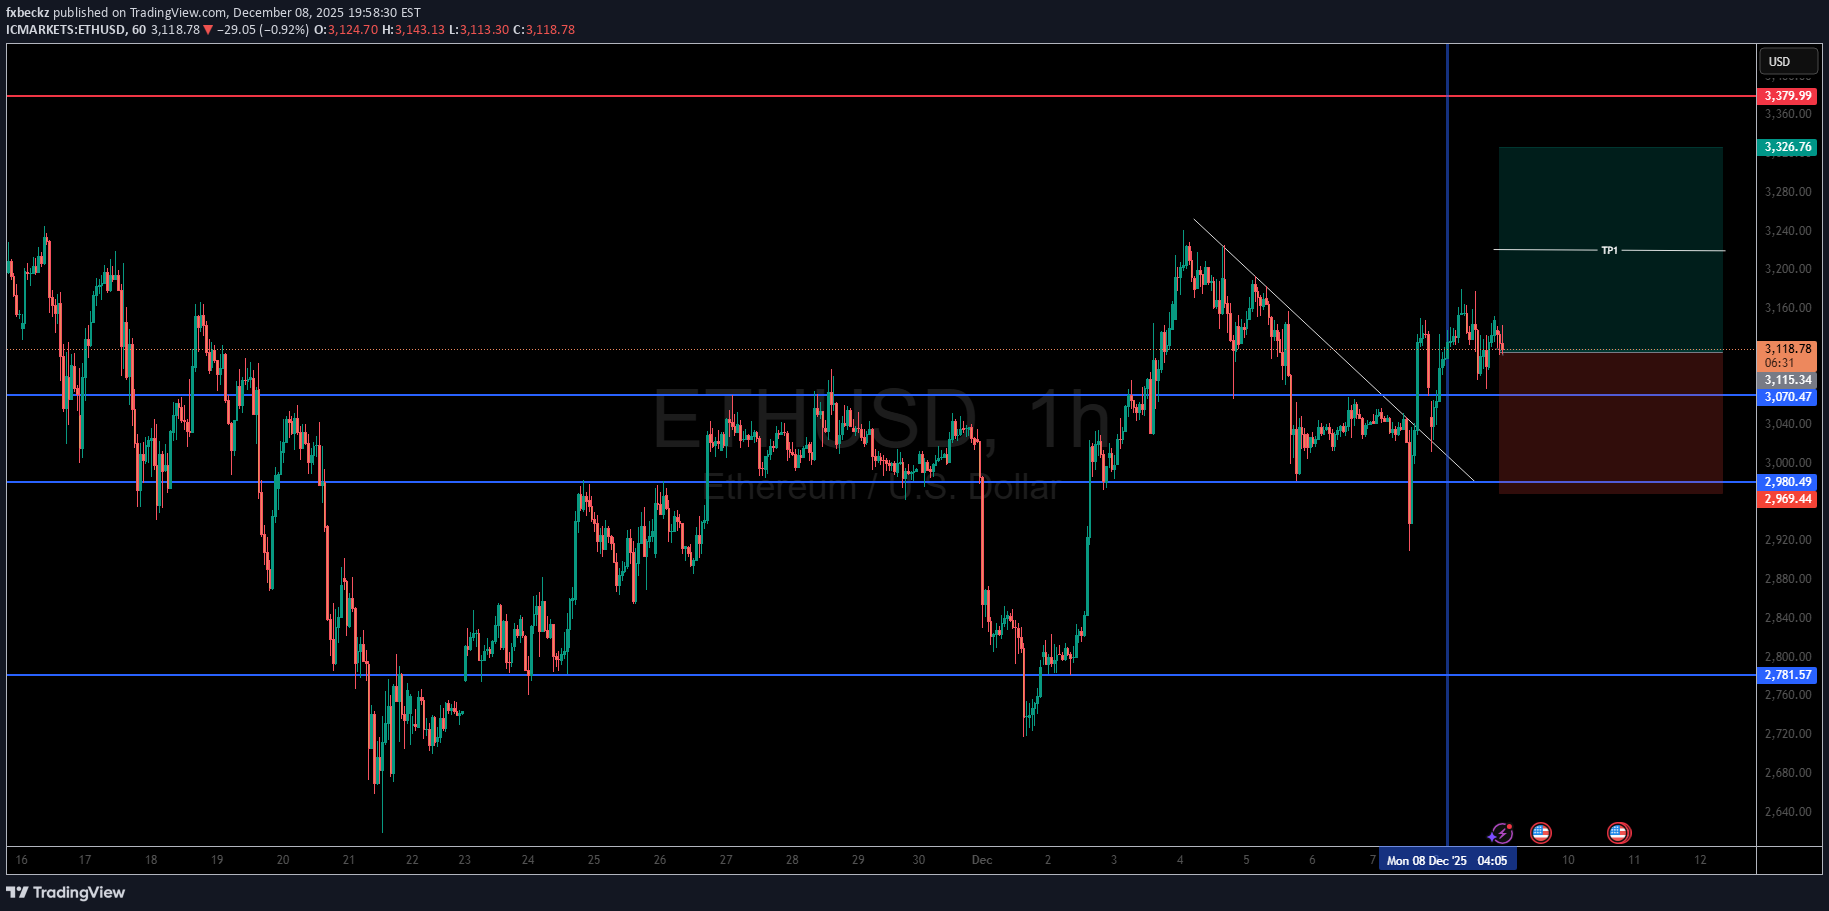
Let me walk you through why I’m positioned for buys on ETHUSD, and how the structure aligns with the institutional price-delivery model I’ve used for over a decade. 1️⃣ Higher-Timeframe Context — The Range Is Defined ETH is currently trading within a well-defined HTF range, with: A major supply zone above A clear liquidity shelf below Clean mid-range levels that are being actively traded Price has shown multiple rejections from the lower parts of the range, confirming that institutions are accumulating positions rather than distributing. 2️⃣ The Sell-Off Into Discount Was an Accumulation Phase The sharp drop you see on the left side wasn’t random — that was engineered liquidity, pulling price into a discount zone. Inside that drop, we see: A liquidity sweep of the equal lows A mitigation of a previous inefficiency A strong displacement candle back upward This is a textbook model of institutional accumulation before expansion. 3️⃣ Break of Structure ⇒ Transition Into a Bullish Cycle Once price completed the sweep of the lows, it immediately delivered: A strong BOS (Break of Structure) A shift from corrective pullbacks to impulsive bullish delivery Displacement candles clearing internal liquidity This is the exact transition signature that confirms the bearish phase has ended and the bullish phase is beginning. 4️⃣ The Trendline Break + Retest Confirms Institutional Buy-Side Delivery On your chart, the downward trendline acted as: A liquidity magnet A retail-based bearish structure trap An engineered point of interest for institutions to gather liquidity Price broke through this trendline aggressively, then pulled back to retest the underside of it. This retest wasn’t random — it was: A mitigation of the origin of the impulse A validation that sell-side liquidity below the trendline has been collected A high-probability higher-low formation This is exactly the kind of confluence I wait for in my own trades — break, retest, confirm. 5️⃣ Internal Structure Shows Clear Bullish Re-Accumulation After the breakout, the internal structure demonstrates: Higher highs and higher lows Bullish re-tests of key horizontal levels Reduced selling momentum after each pullback Imbalances being filled before continuation Everything about this structure suggests smart money is supporting the move upward. 6️⃣ Liquidity Pools Are Above Current Price — A Magnet for Continuation Above your entry zone, price has: Untapped buy-side liquidity Equal highs Clean inefficiency pockets A large unmitigated supply zone These areas represent targets for bullish delivery. Institutions don’t leave liquidity behind — they go collect it. 7️⃣ TP1 Matches Institutional POI Targeting TP1 lines up almost perfectly with: A prior structural high A liquidity pool A breaker block that price previously used as a reaction point This TP placement isn’t random — it’s aligned with the exact levels institutions target during expansions. It’s the first logical take-profit point before price reaches the major HTF supply above. 8️⃣ Summary — Why I’m Bullish on ETHUSD Here’s the institutional reasoning shaping my bias: HTF range defined → price trading near discount Lows swept → liquidity collected Strong BOS → bullish transition confirmed Trendline broken & retested → confluence for continuation Internal structure bullish → accumulation, not distribution Liquidity above → strong magnet for upward delivery TP1 aligns with liquidity + structural POI This is the same setup I’ve taken hundreds of times: accumulation → structural shift → breakout → retest → expansion.