Technical analysis by fxbeckz about Symbol PAXG: Buy recommendation (10/13/2025)

fxbeckz
تحلیل طلا (XAUUSD): ورود به معامله خرید با پتانسیل سود ۱.۶۶٪
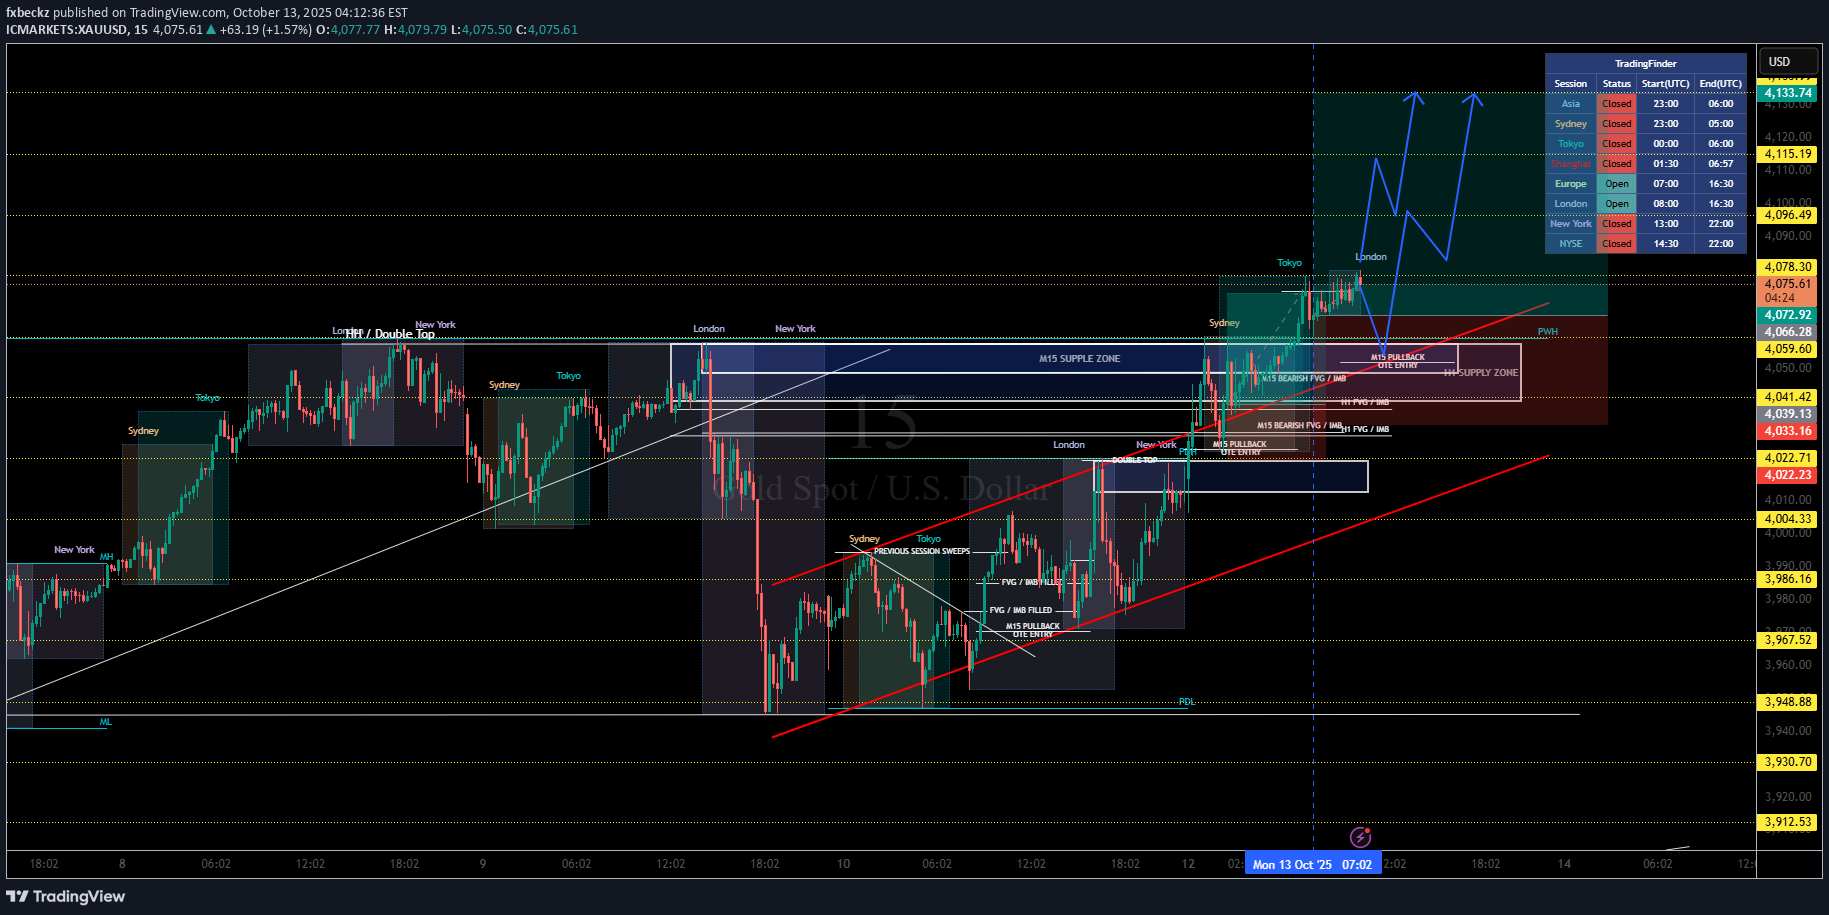
✅ 1. Major Market Context Previous High Liquidity Sweep There was a London/New York double top near the top of the chart. Price swept that liquidity and then dumped impulsively. This forms a strong M15 supply zone (highlighted in blue). That zone is where price has since reacted and retraced down before forming a new structure. ✅ 2. Bullish Structure Shift After the Drop After the liquidity grab and dump: Price began forming higher highs and higher lows inside a rising channel (drawn in red trendlines). Multiple FVGs and IMBs (Imbalances) filled during the climb. I’ve clearly marked: M15 pullback OTE entries (optimal trade entries). Previous session sweeps (Sydney, Tokyo, London). This entire structure supports a bullish continuation narrative. ✅ 3. Key Bullish Confluences Here’s why the long bias makes sense: 🔹 PDL Sweep Price swept the Previous Day Low before reversing up. Classic liquidity grab before trend continuation. 🔹 Trendline Support The red ascending trendline is acting as dynamic support. Multiple taps, confirming buyer presence. 🔹 FVG + IMB Rejections Several fair value gaps + imbalances have been filled and respected. These align with your entry zones. 🔹 M15 Supply Tested & Reclaimed Price dipped into the former supply zone and broke above it. That old supply now acts as demand on retests. ✅ 4. Active Trade Details I'm currently in a long position, and here are the key stats shown on chart: Risk-to-Reward Ratio: 2.04 Stop Loss: ~33.12 points (0.81%) This trade aligns with: Structure Imbalances Session liquidity behavior Trend direction ✅ 5. Target Zones 🎯 Target Zone (Marked in Green Box) Price projection is split into two impulsive legs (blue path illustration). The labeled target is: 67.46 points (1.66%) This aligns with: PWH (Previous Week High) Clean buy-side liquidity Unresolved imbalances above ✅ 6. Bearish Risk Area (Red Zone) Marked below my entry: M15 bearish FVG / IMB Supply zone retest If price breaks and closes below trendline + that red block, structure shifts bearish. The SL is correctly placed below: Trendline Last accumulation Key IMB + OTE entry area This keeps your setup protected without overcrowding risk. ✅ 7. Final Outlook Bias: Bullish continuation As long as: Trendline holds Price respects the reclaimed supply-turned-demand No clean break below SL zone