
artemfedorov
@t_artemfedorov

What symbols does the trader recommend buying?
Purchase History
پیام های تریدر
Filter
artemfedorov
بررسی هفتگی رمز ارز: آیا بیت کوین وارد زمستان کریپتو میشود؟ (تحلیل کلان و کوتاهمدت نزولی)
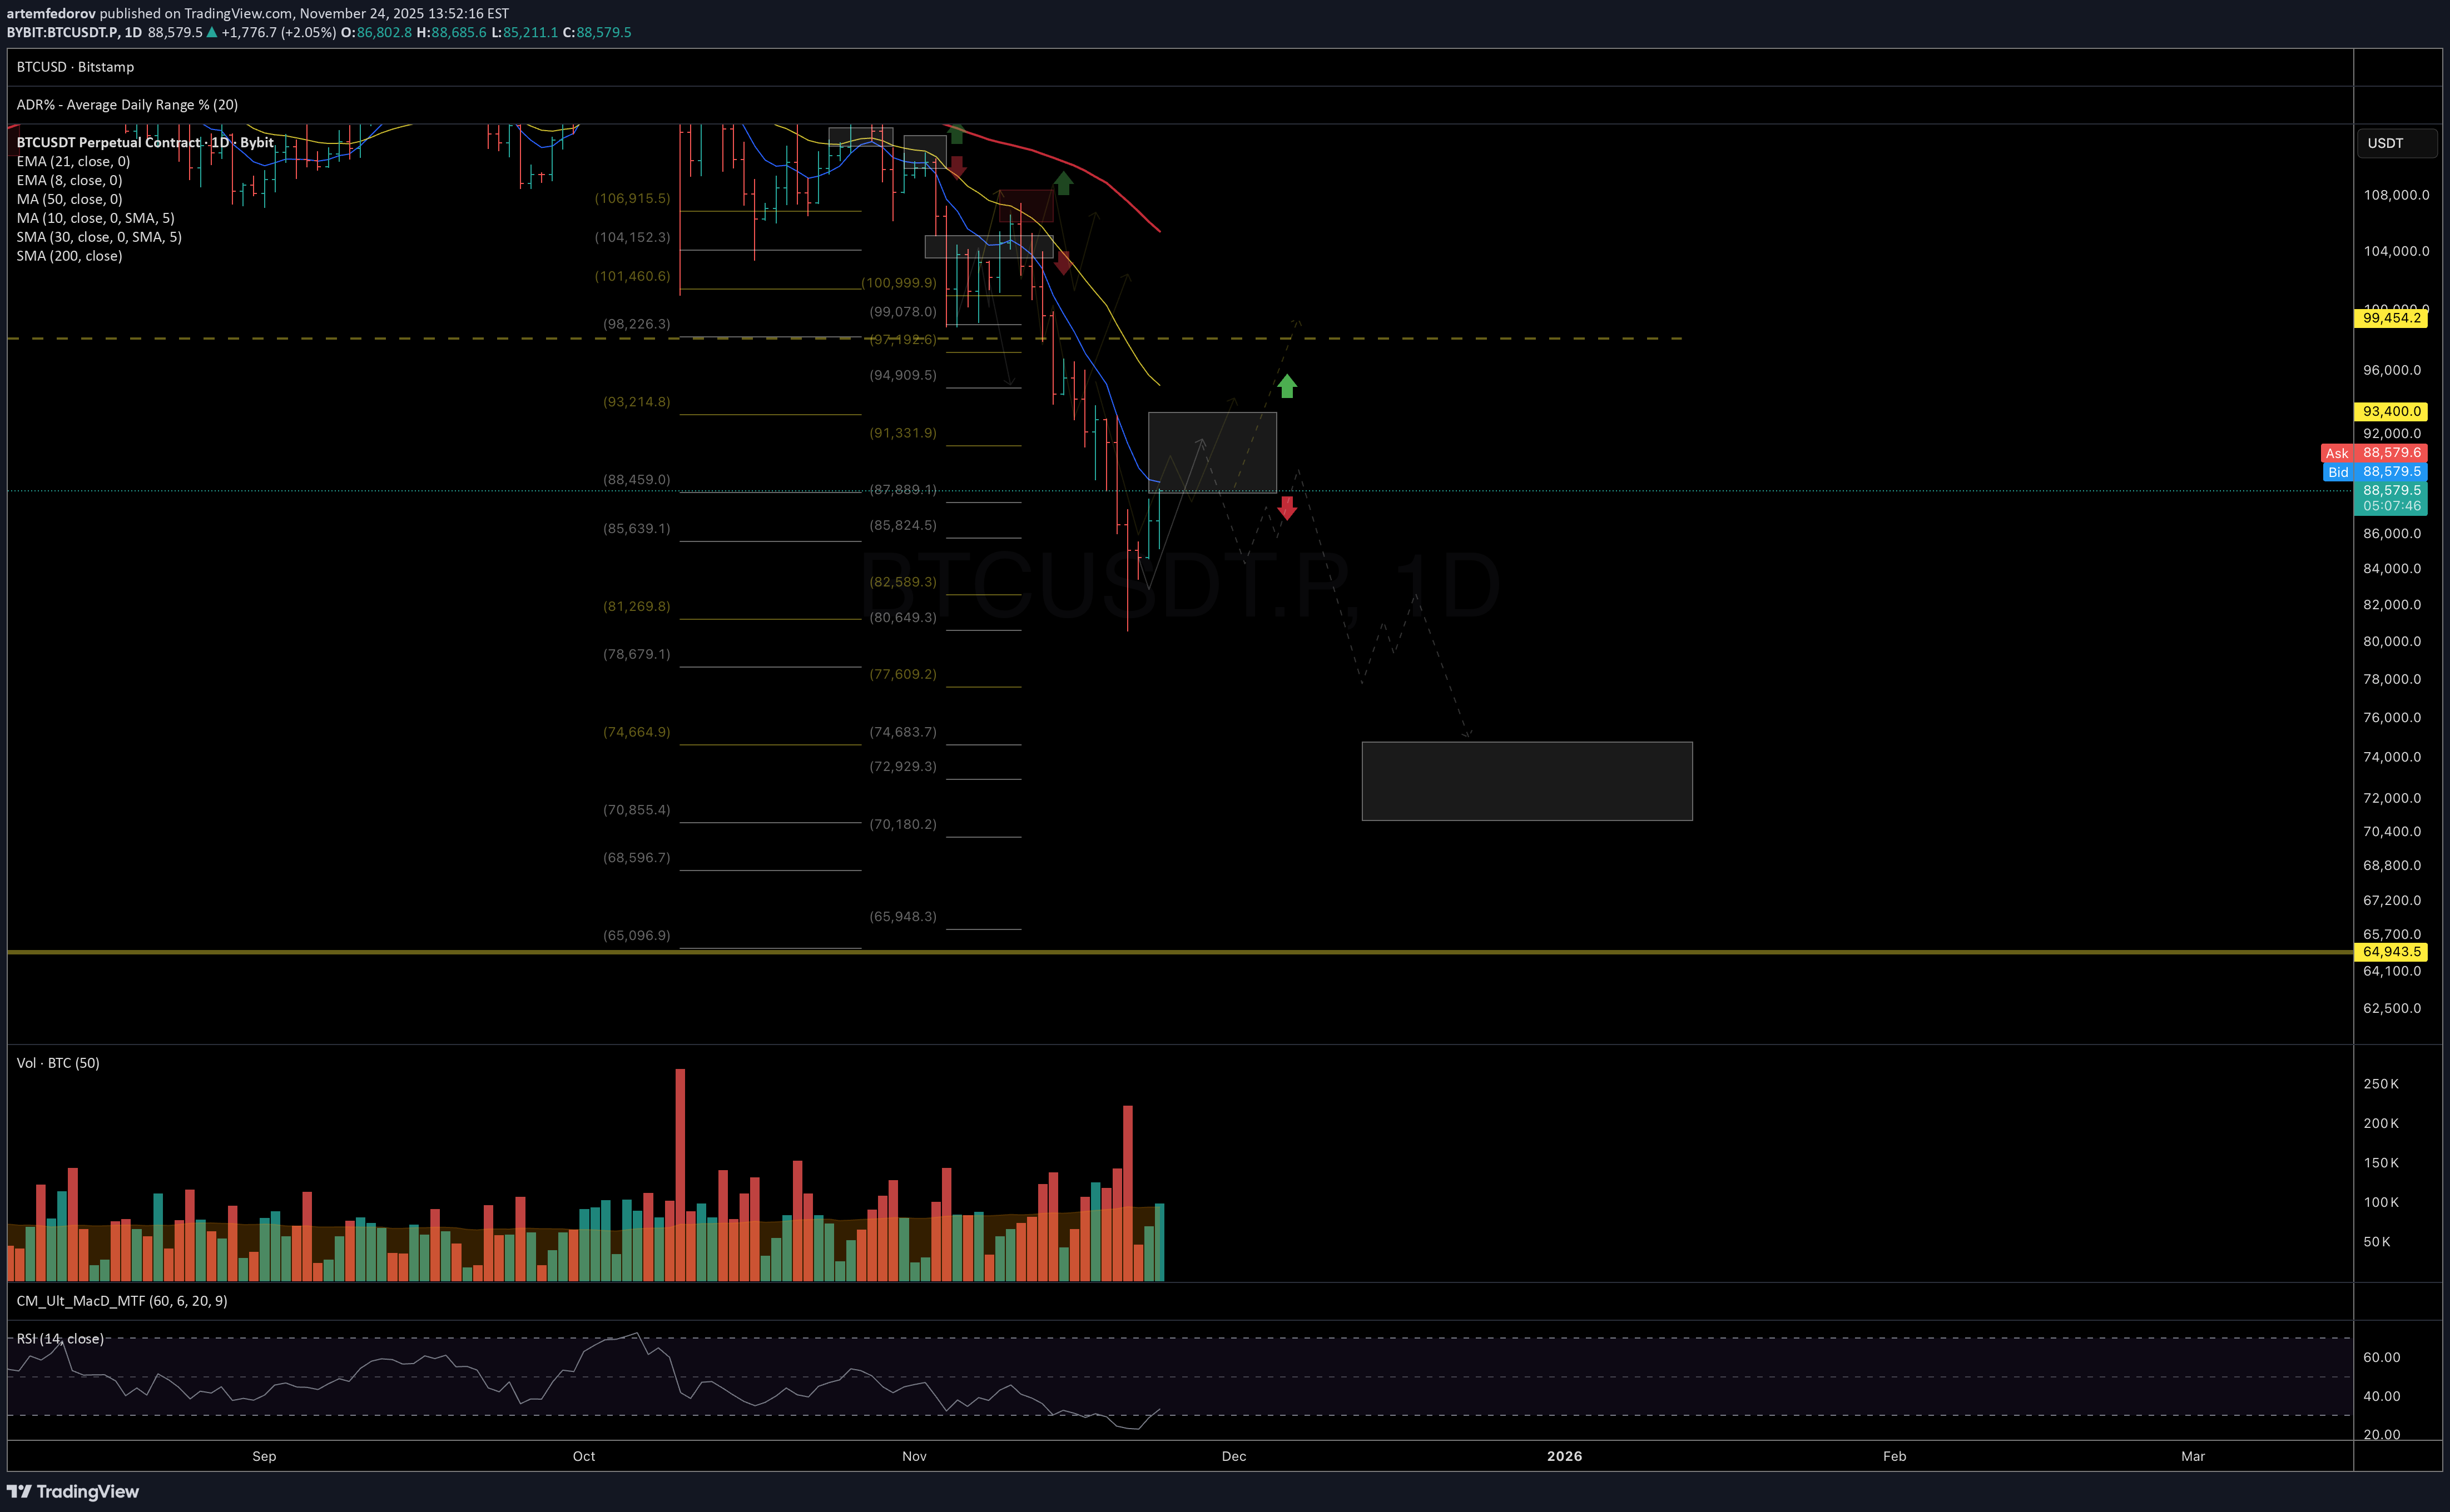
Bitcoin Bitcoin is closing its second consecutive week below the 50-week moving average. Throughout this growth cycle (since the 2022 lows), price has always found support at these levels. Chart: Historically, closing below this level for more than two weeks in a row has almost always marked the start of a macro-correction cycle or ‘crypto winter,’ rather than just a standard drawdown. Chart: On RSI: The Weekly RSI, which maintained an uptrend throughout 2024 and almost all of 2025, decisively broke its long-term support line in November. As long as RSI remains above the support line, the bullish cycle structure usually holds; however, a downward breakdown often coincides with the completion of a growth phase. Chart: The combination of these two signals—dropping below the 50-week average and the RSI support breakdown—sharply increases the probability that the market has already entered a macro-correction phase. In my view, the probability of this scenario is currently over 80%. On 200W MA In all past cycles, the final Bitcoin bottom formed specifically around the 200W MA. Currently, this sits near 66k, and by mid-2026, it could rise to the 73–75k range, fitting a scenario of a further 15–20% decline from current levels. Chart: Expectations for the week: I see potential for another correction wave as long as price remains below 93k. In the coming days/week, it is logical to expect a bounce (already in progress) toward this resistance zone; however, without sustained consolidation above it, the risks of another drop toward 75–70k remain high. Chart: If the market does test the 75–70k zone, a local bottom may form there, triggering a powerful bearish rally toward the falling 200-day average. This is the ‘dead cat bounce’ scenario with potential upside of around +40%, typically used to regroup positions in the middle of a bearish phaseIf price fails to break out above today’s highs, the odds increase for the downside structure outlined in the November update, with an ideal support target around 75K. Chart:
artemfedorov
آخرین سقوط قیمت به کجا میرسد؟ فرصت خرید نهایی در محدوده کلیدی!
Another leg down into the ideal macro support zone at 91–85/75 would be ideal to complete the corrective structure from the June highs. A confident move above 120 would shift the odds toward the correction being complete, opening the door for at least a larger-degree bounce — or potentially the beginning of a new uptrend. Chart: https://www.tradingview.com/x/4Ak56TvB/Good follow-through into the support zone. Now the key is to see whether price can stabilize here and begin forming a constructive higher-low sequence Chart:
artemfedorov
پیشبینی سقوط ارز دیجیتال MNT: منتظر کاهش بیشتر زیر سطح مقاومتی ۱.۵۱ باشید!
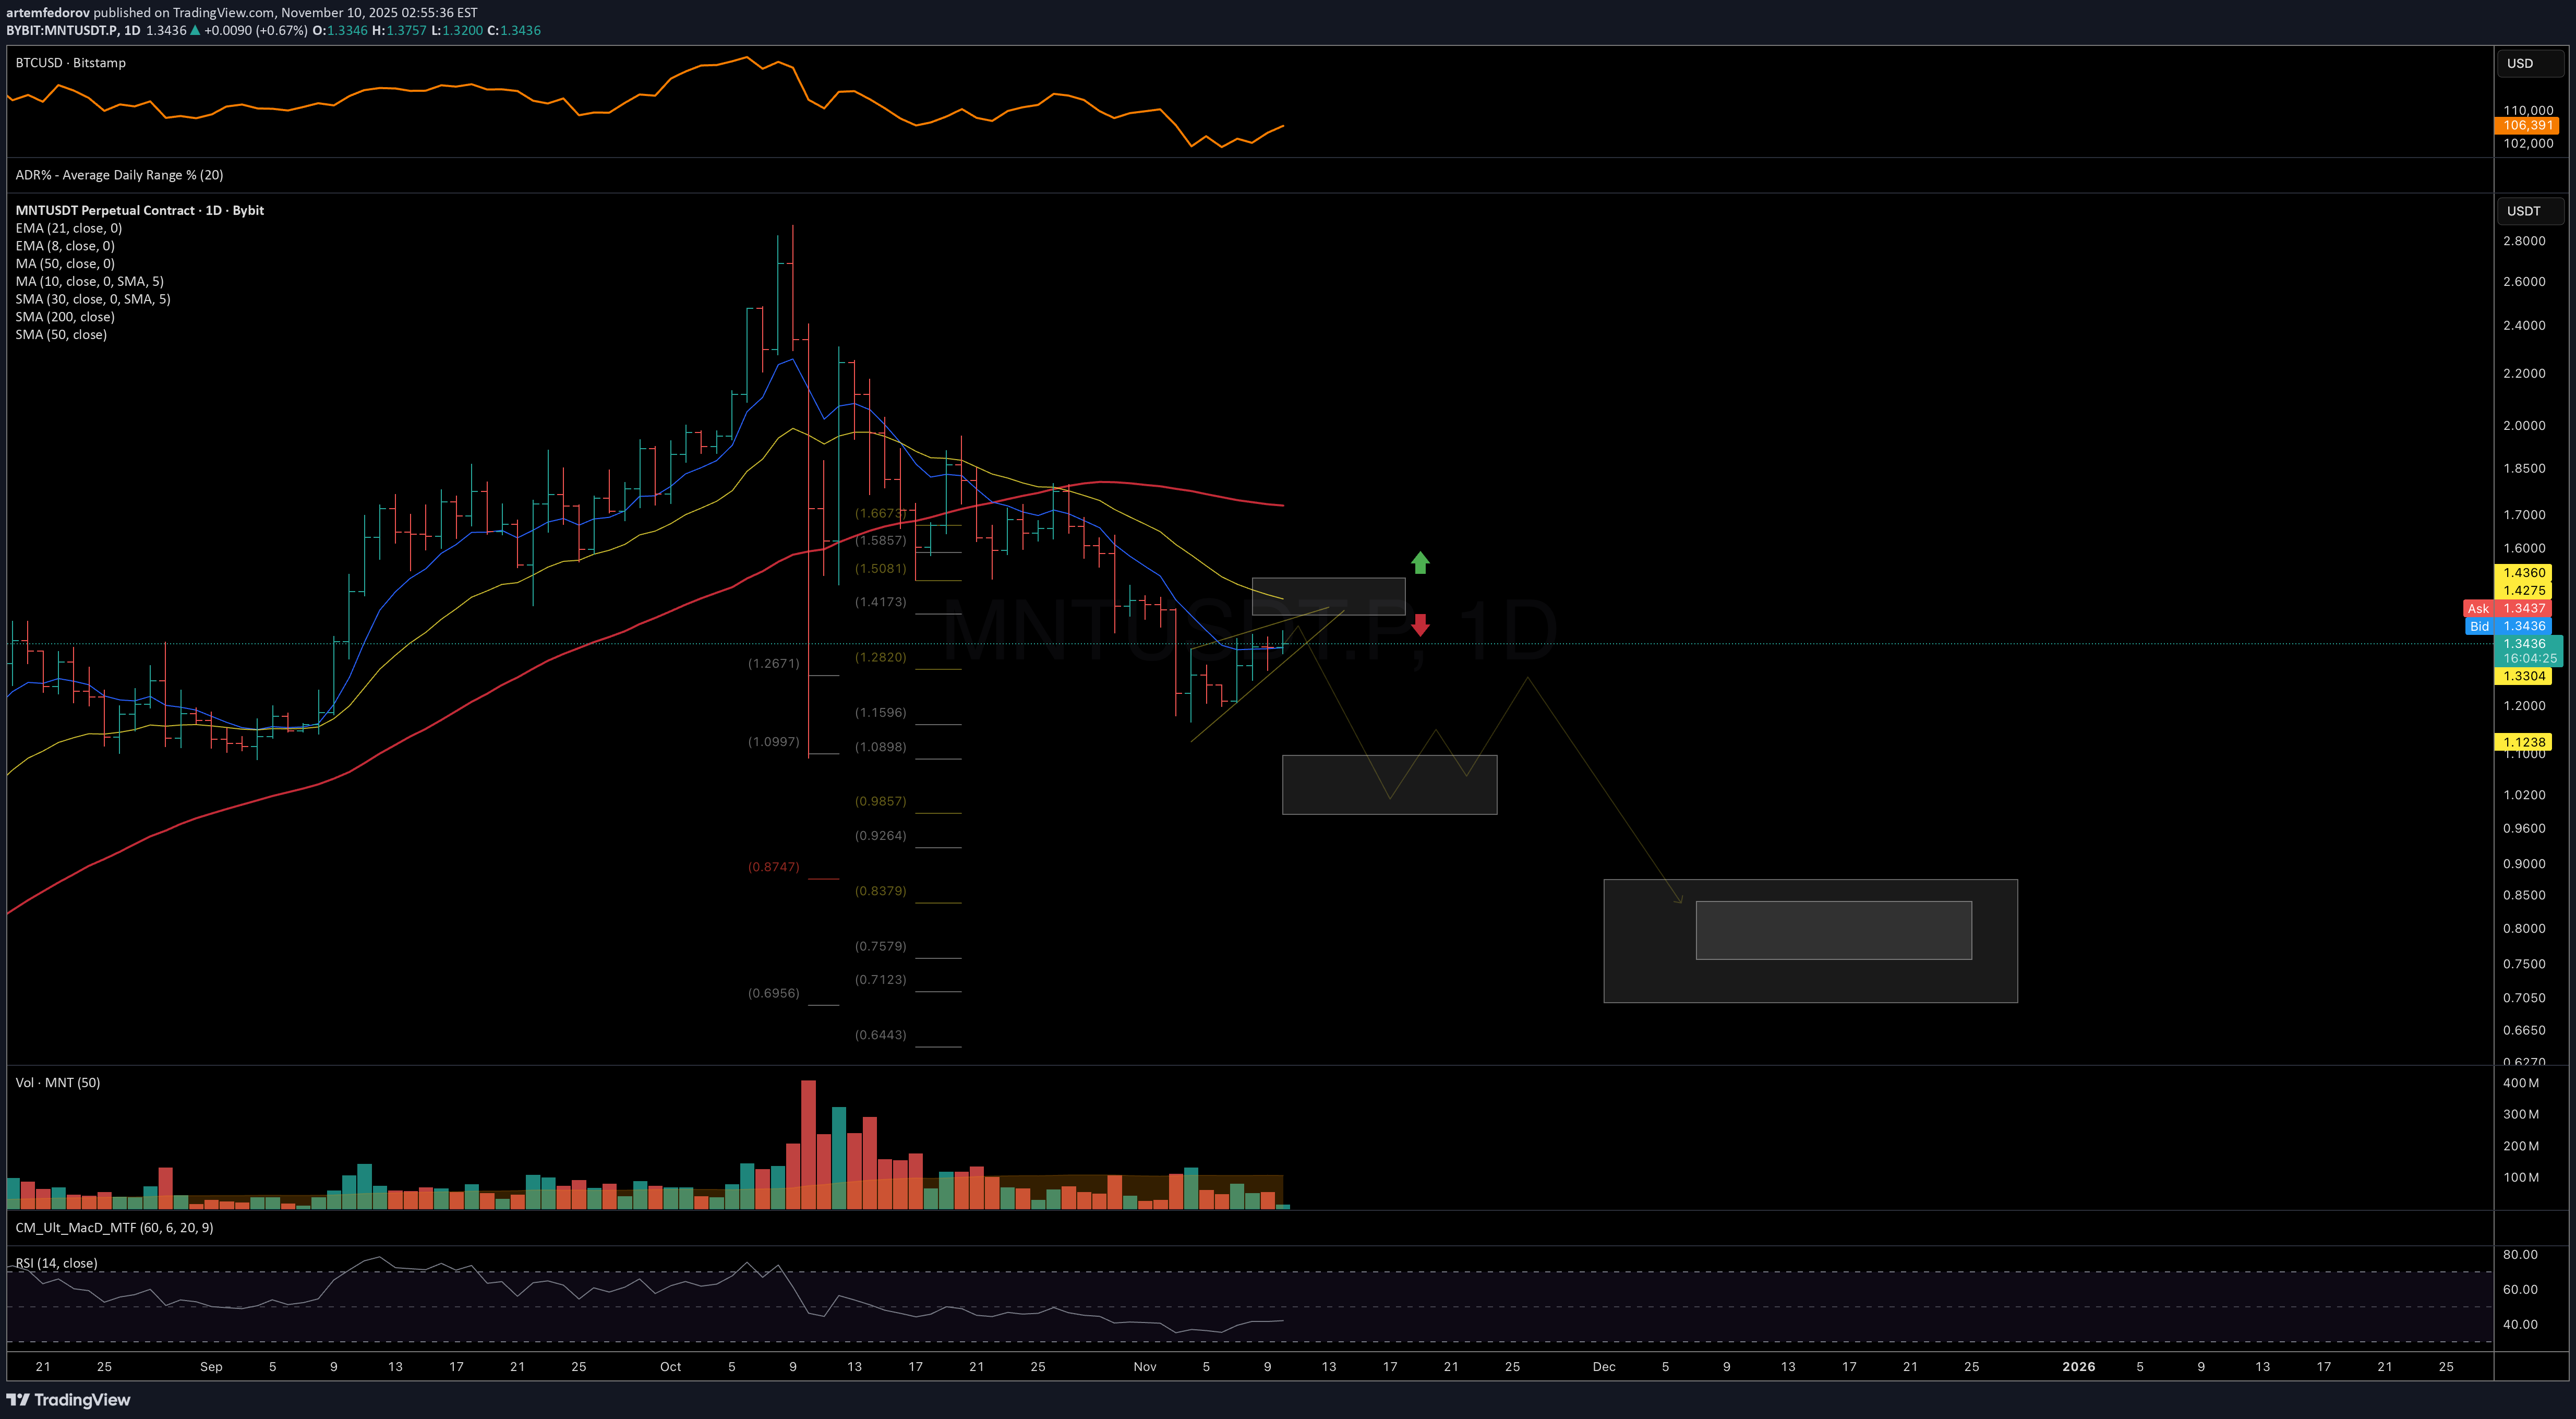
Watching for more downside continuation as long as price remains below the 1.51 resistance level. Chart: https://www.tradingview.com/x/1RDfUR9a/Good follow-through to the downside after the start of swing-down from Nov 10. The 1.09–0.985 zone might act as an initial support area where this leg down may complete. However, structurally I’m still looking for more downside - at least a measured move toward 0.875, with the possibility of a deeper capitulation lower. Chart:First target hit. The next (ideal) support zone for this leg down sits around 0.99. Chart: If a swing-short position was taken, the stop can now be moved to today’s highs — or you can trail it using the 8-dayUltimate target reached at 0.84 Chart:
artemfedorov
هشدار حیاتی برای بیت کوین (ZECUSDT): آیا قله جدید در راه است؟
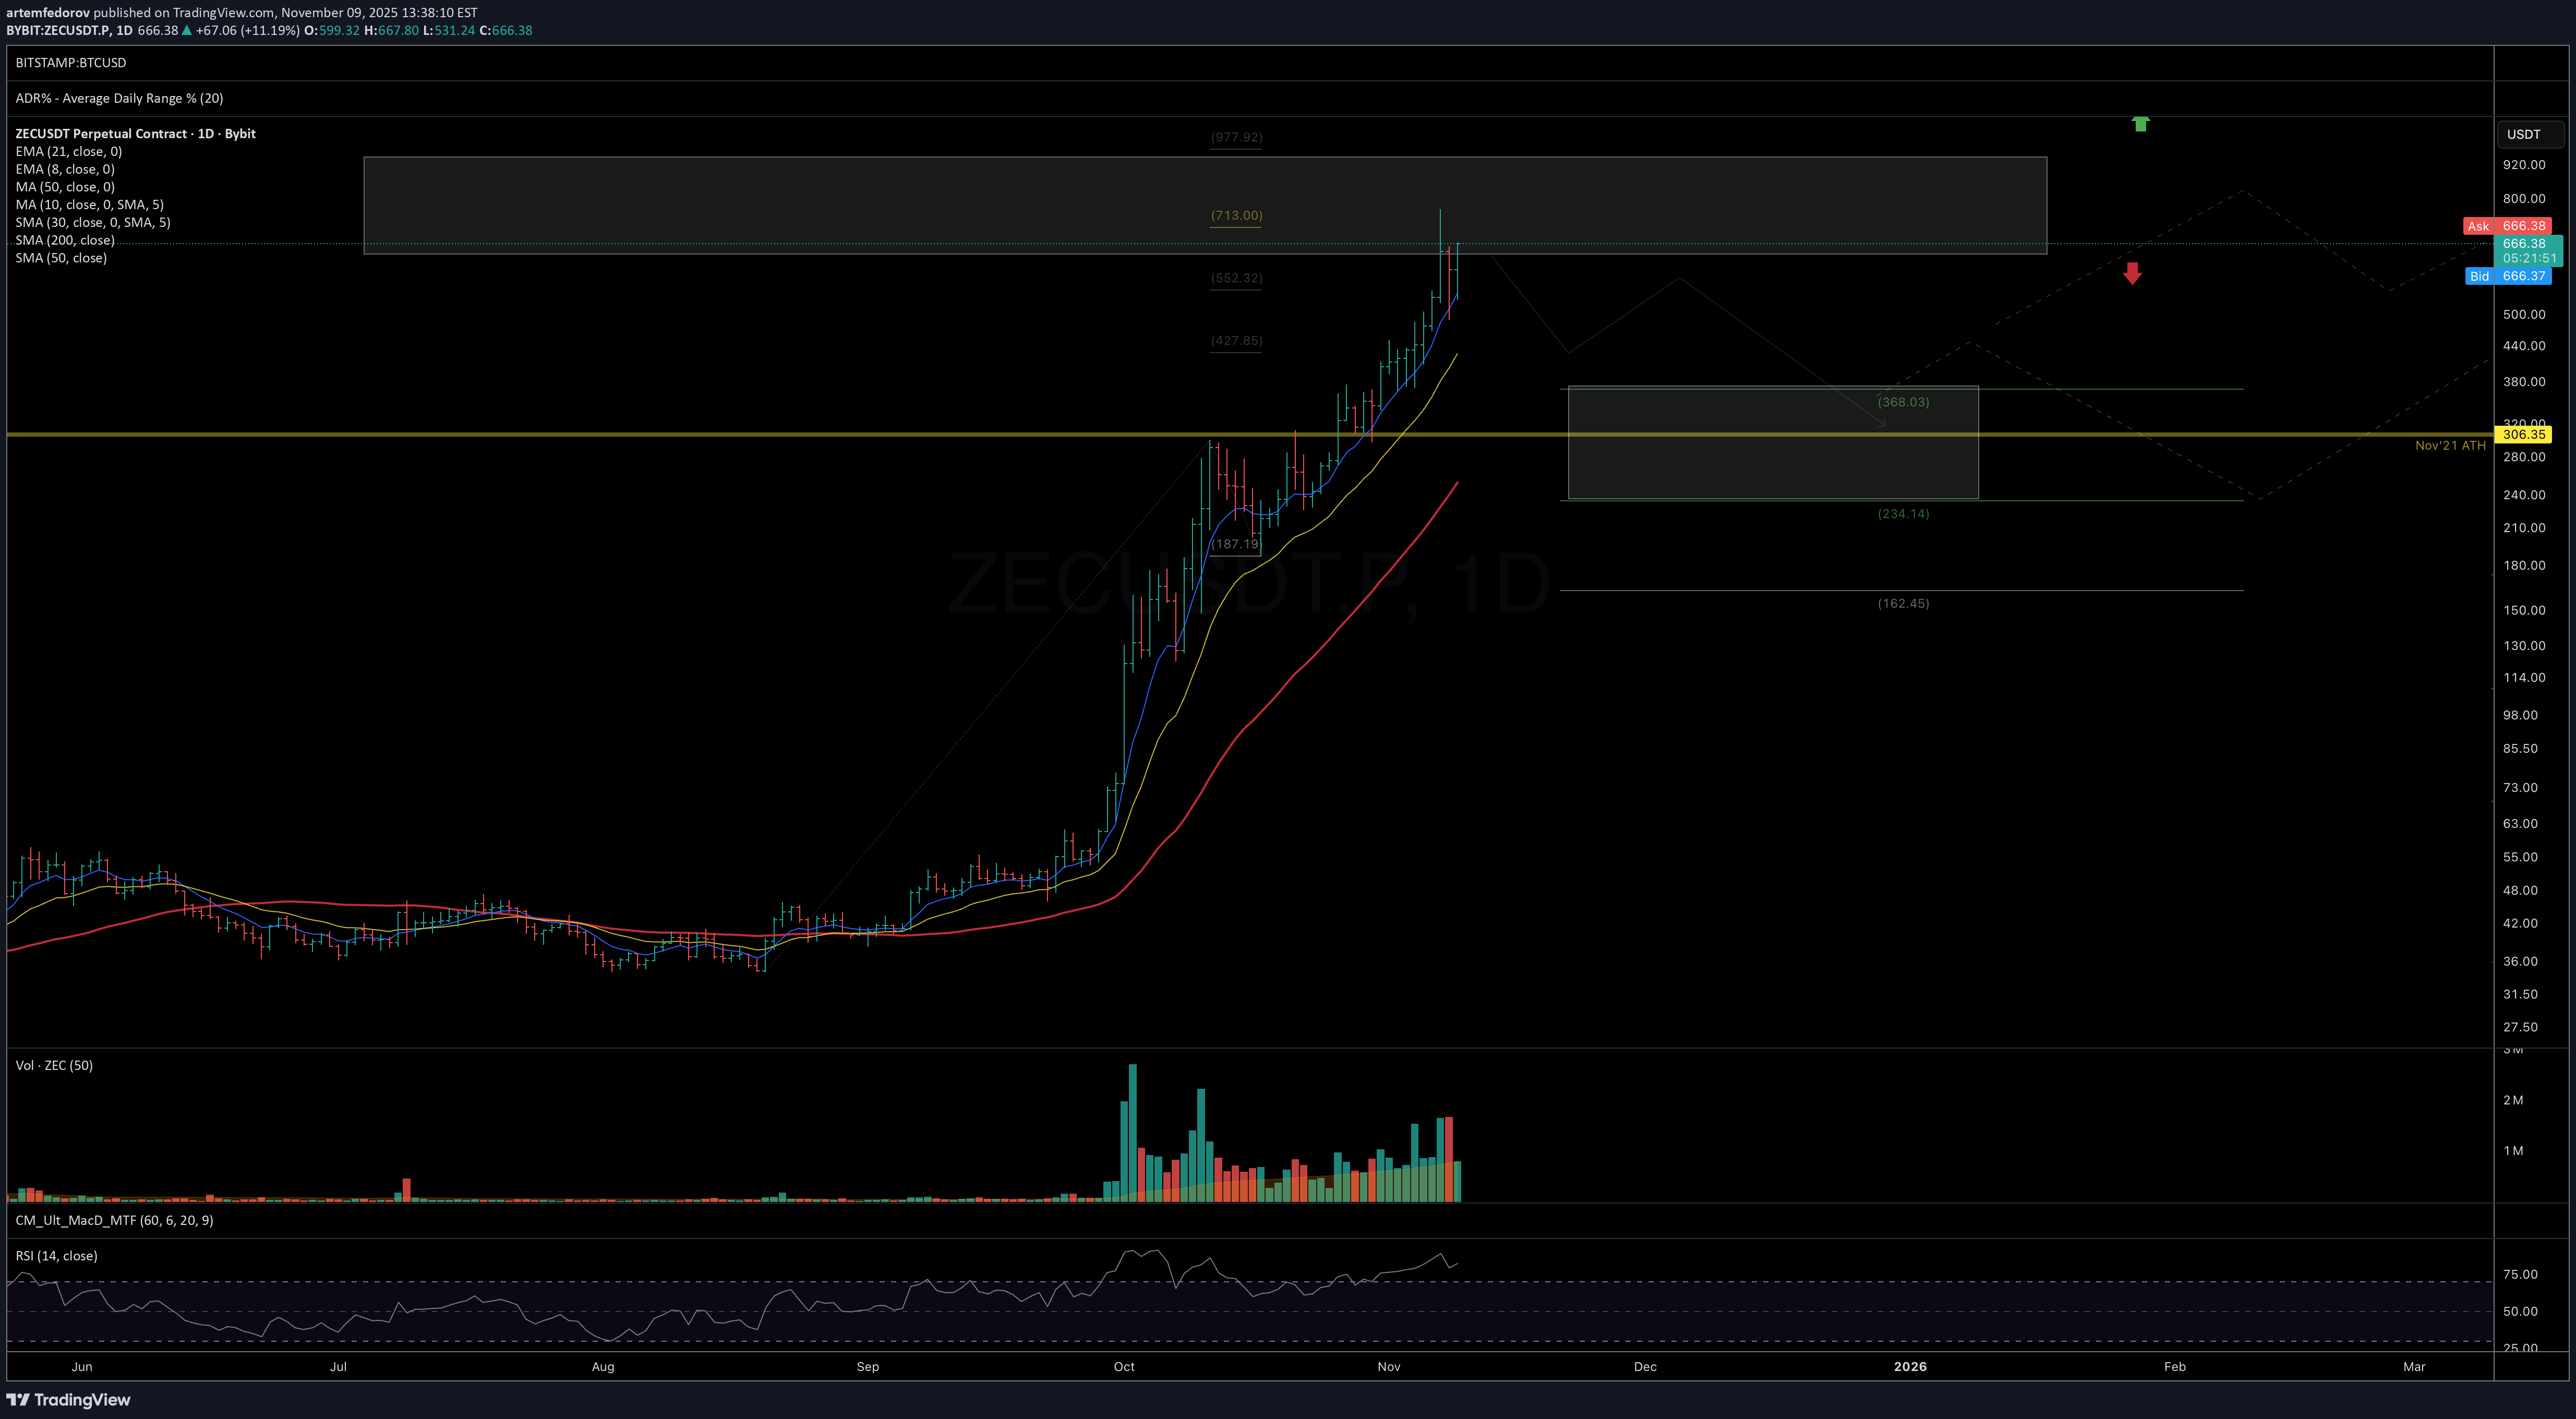
Price has reached the key extension zone at 635–930, where at least a mid-term top formation is likely. As long as price holds within or below this area, I’m watching for signs of topping and the beginning of a pullback toward the 370–235 support region. Chart: https://www.tradingview.com/x/m2J07kcf/ Macro view: https://www.tradingview.com/x/RnWZvi6Y/First target hit
artemfedorov
احتمال سقوط دوباره تسلا: آیا کف قیمتی 430 دلاری محقق میشود؟
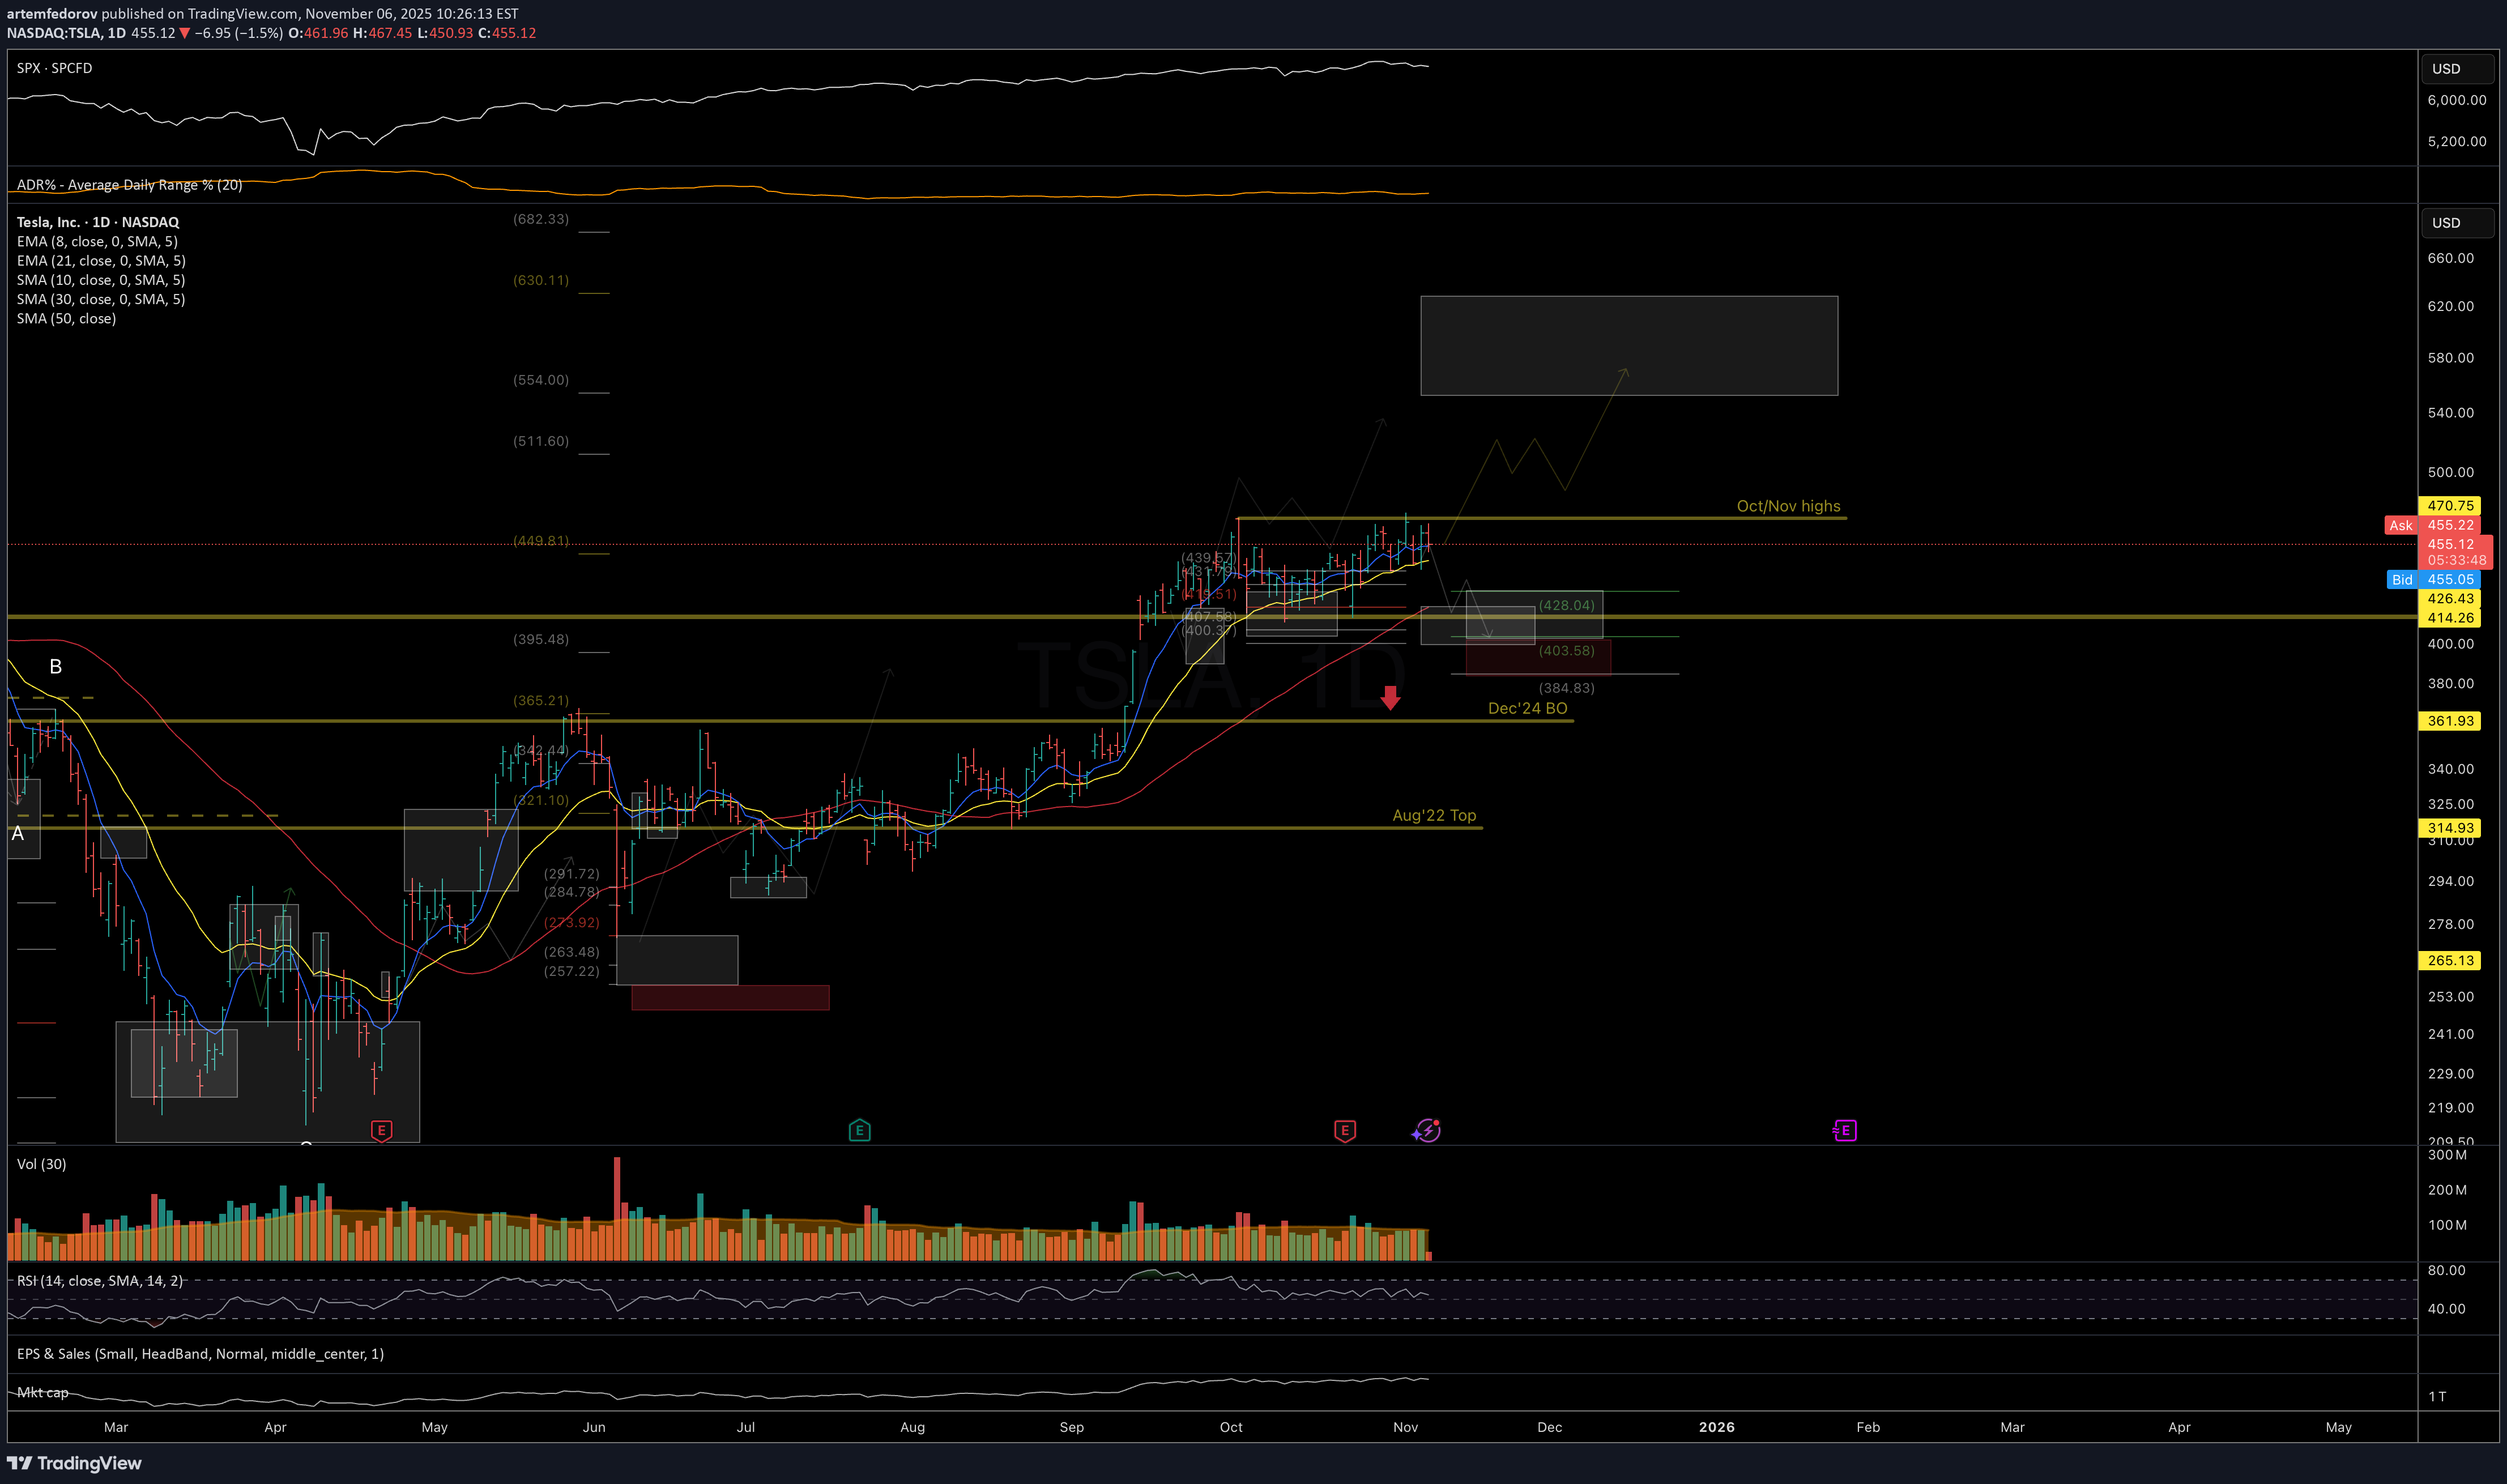
TSLA Watching for one more leg down into the 430–400 mid-term support zone to potentially complete the corrective structure, if price remains unable to break out above the October/November highs. Chart: https://www.tradingview.com/x/fxaKSBiD/ Alternatively, if price manages to break-out and stay above above recent resistance, odds favor continuation to 555-630 resistance zone. Chart: https://www.tradingview.com/x/F6LjJxbc/ Previously: • On macro bottoming potential (Jun 6): https://tradingview.com/symbols/NASDAQ-TSLA/minds/?mind=yJtQ-ZNkTZ2JLpW24O8Rgw • On support (Sep 19): https://www.tradingview.com/x/LgEJk7t4/ • On mid-term support (Oct 7):Price reached the bottom of ideal resistance Chart:Price continued to follow the primary hypothesis of further downside and has now reached the lower boundary of the ideal mid-term support zone. The bounce reaction seen last Friday looks constructive, but preferably we’d want to see a higher-low formation before expecting continuation back toward — and potentially above — the October highs. A break below Friday’s low would shift the odds toward a deeper, more prolonged correction, potentially retesting the September breakout zone. Chart:
artemfedorov
ریزش سنگین در راه است؟ تحلیل فنی سطح کلیدی برای سکه (COIN)
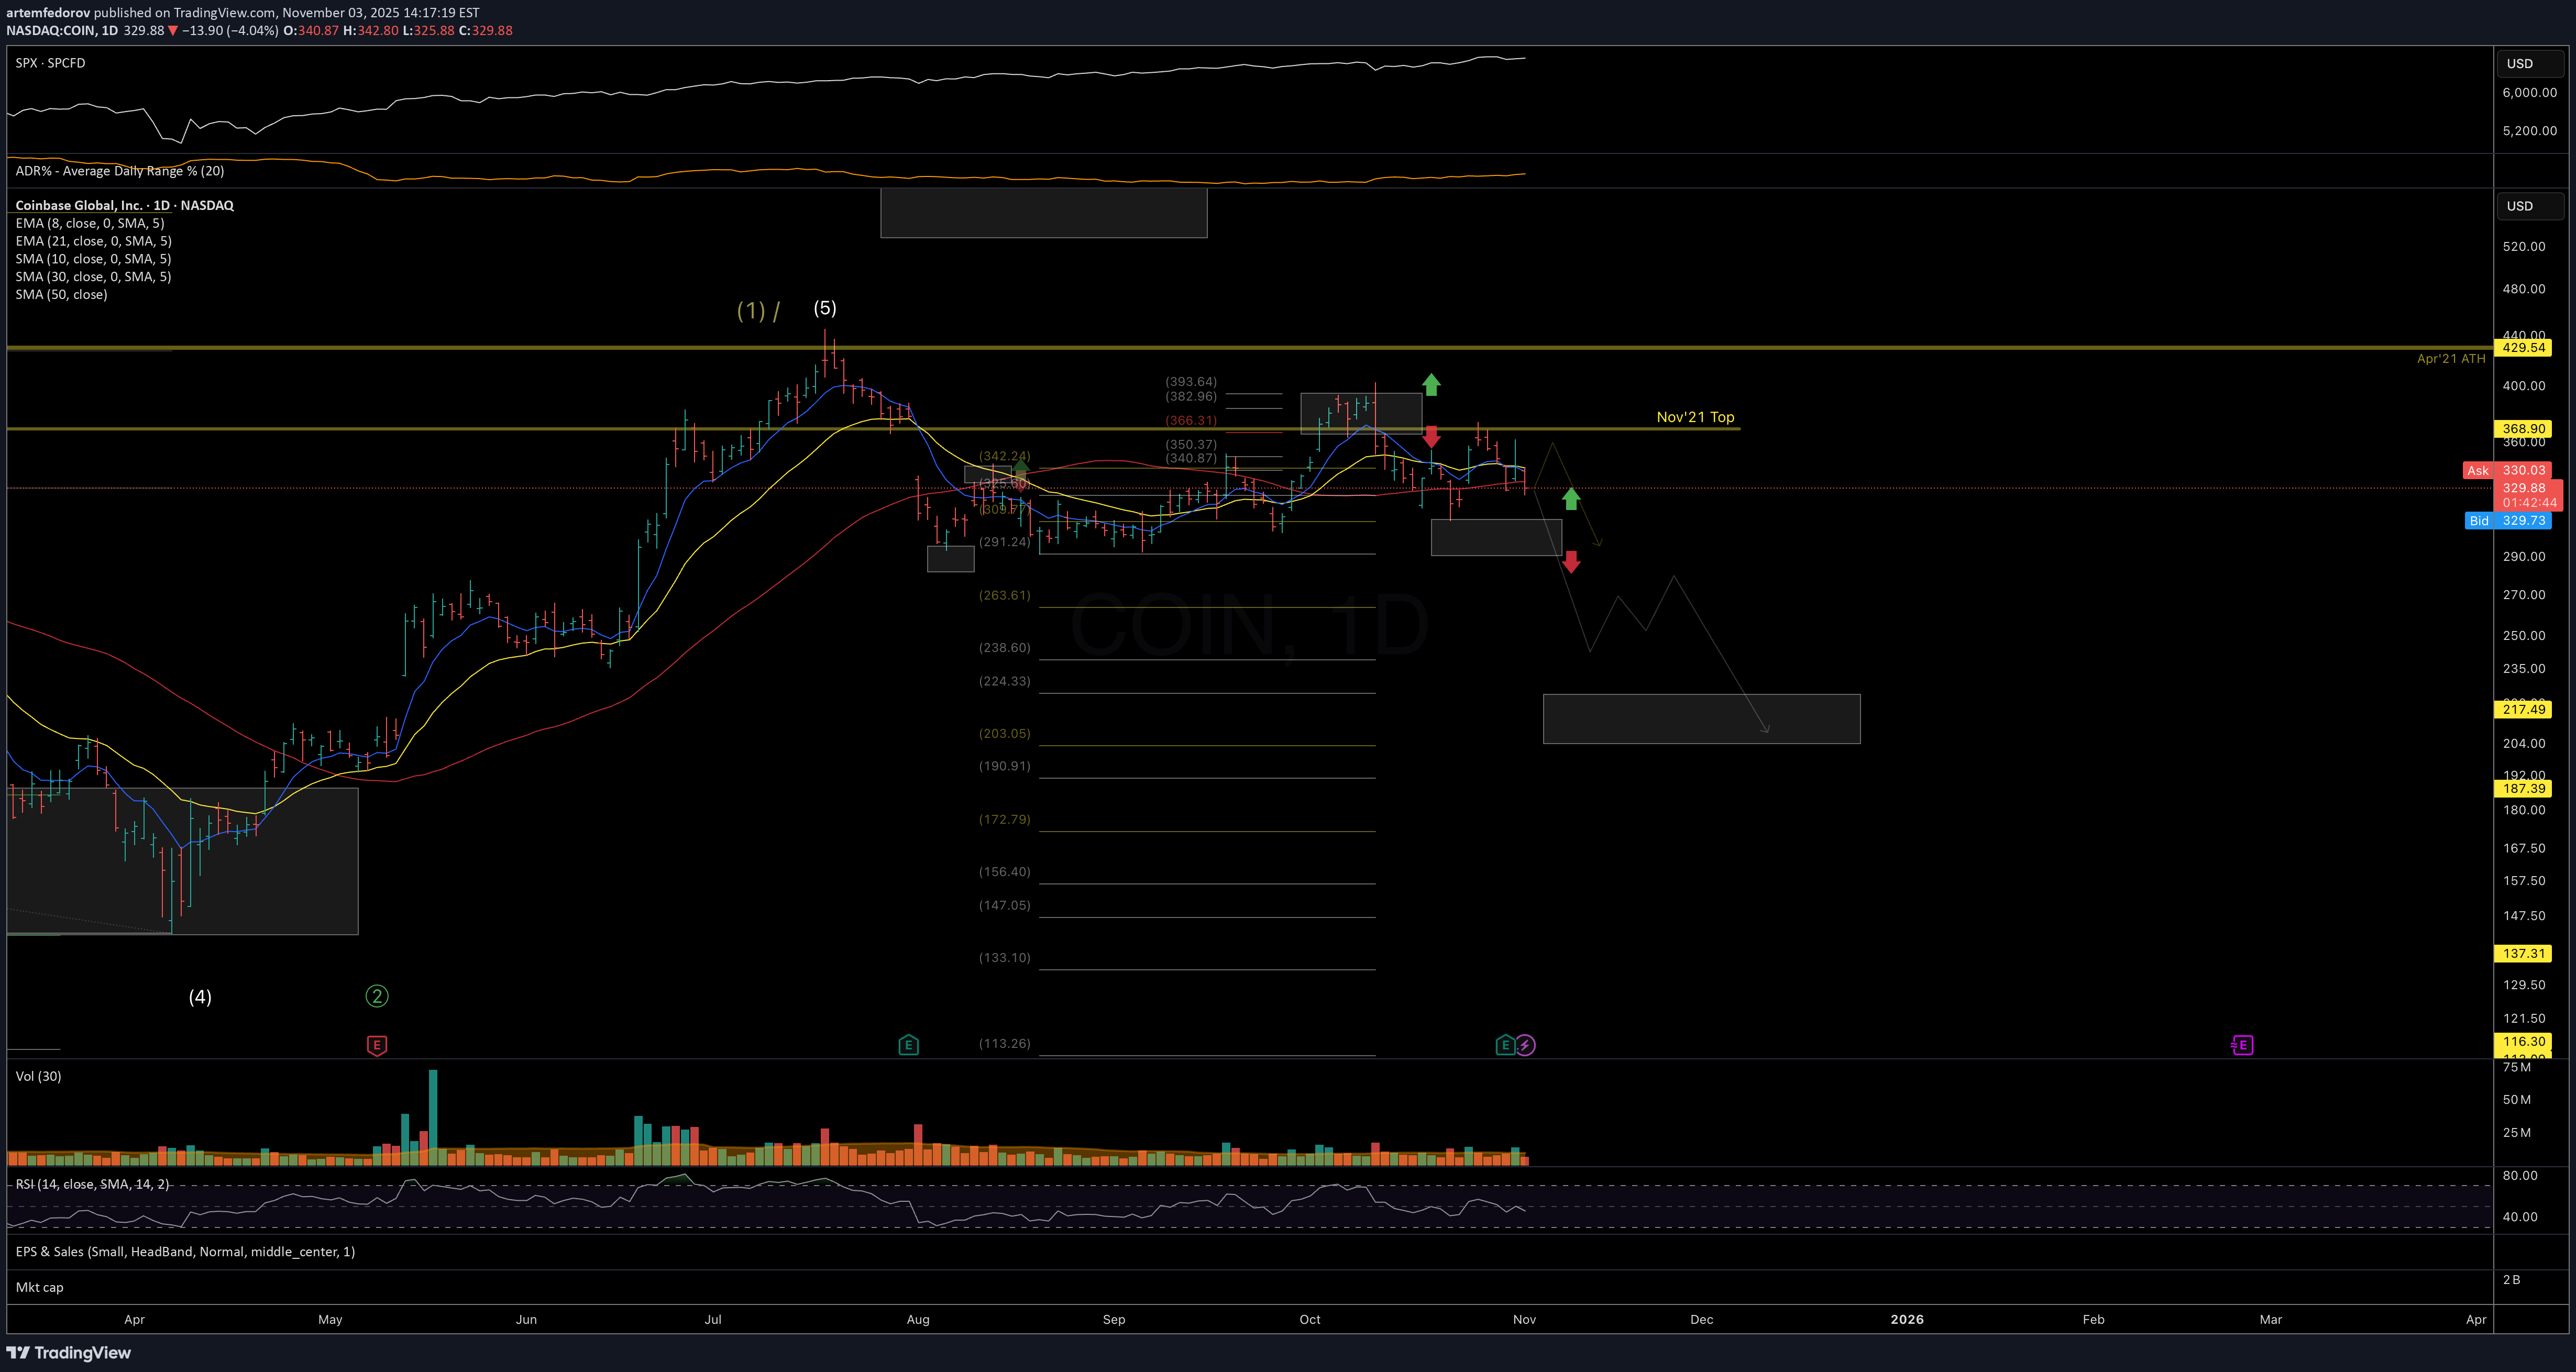
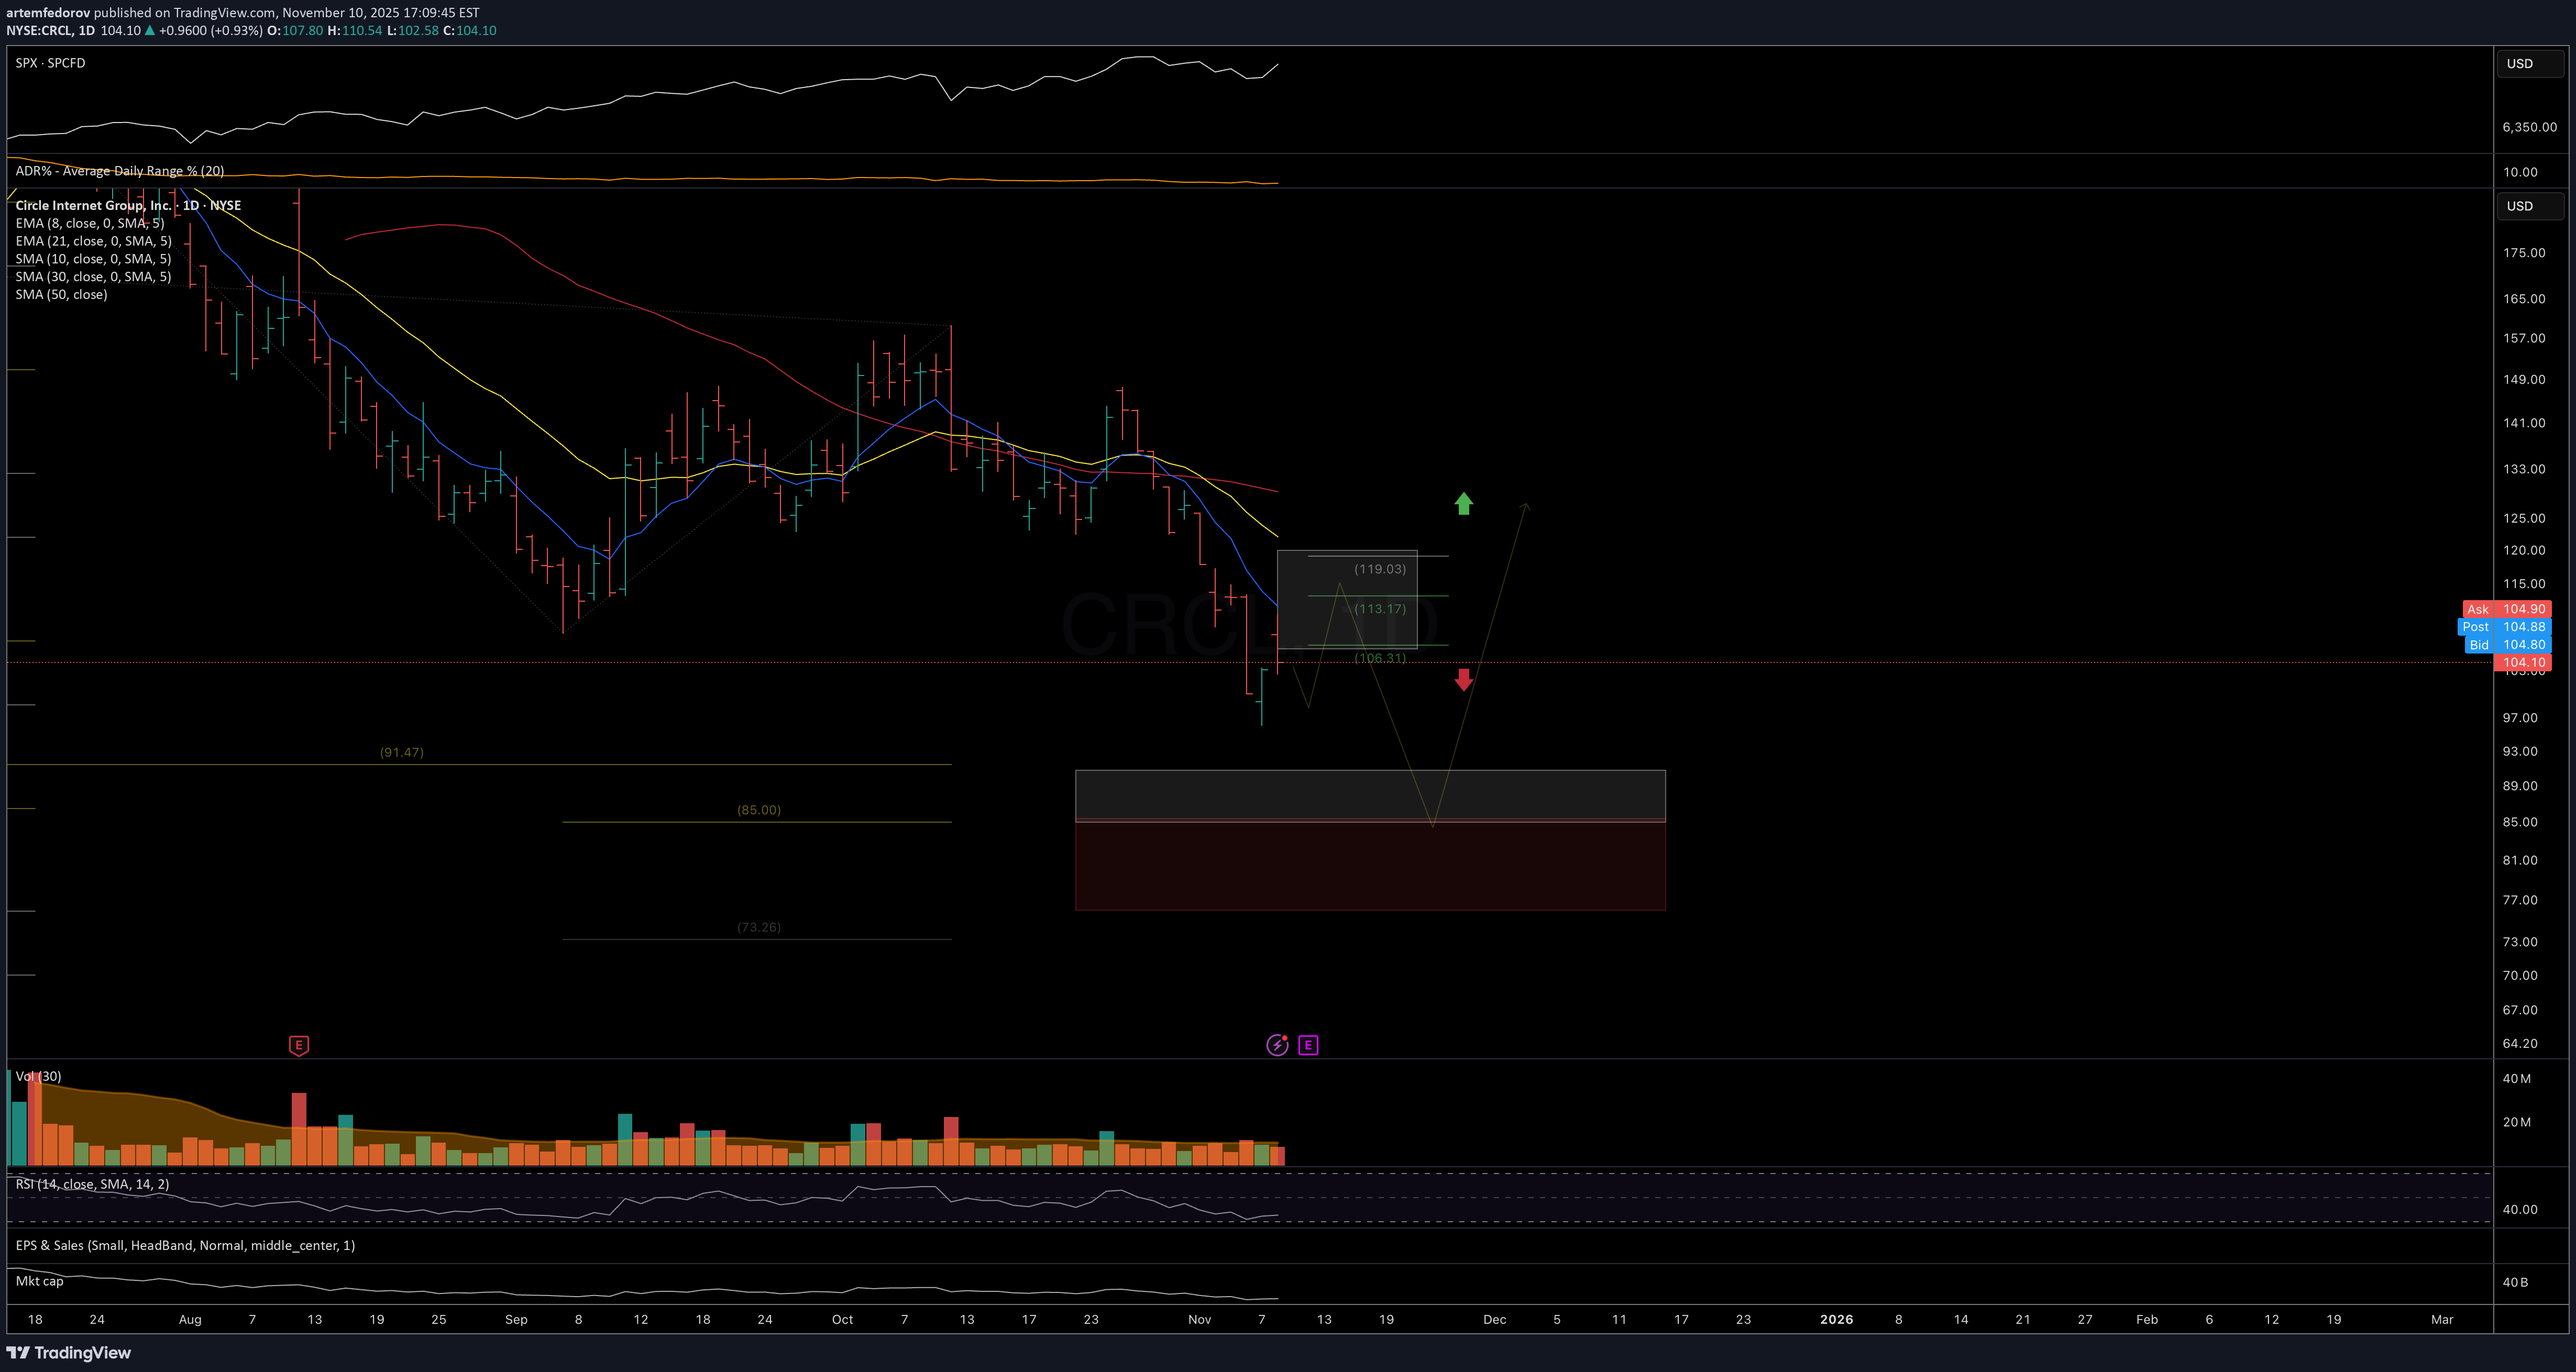
As long as price remains below the October lower high, I’m watching for structural potential pointing toward more downside in the coming weeks, with next key support levels at 240–200. If price is able to start closing above 375, I will need to re-assess the suggested trend structure for a more immediate bullish upside that I don’t see clearly at this point. Chart: https://www.tradingview.com/x/WPz1u3Lx/
artemfedorov
تحلیل هفتگی ارز دیجیتال: آیا بیت کوین به اوج جدید میرسد؟ (سطوح کلیدی)
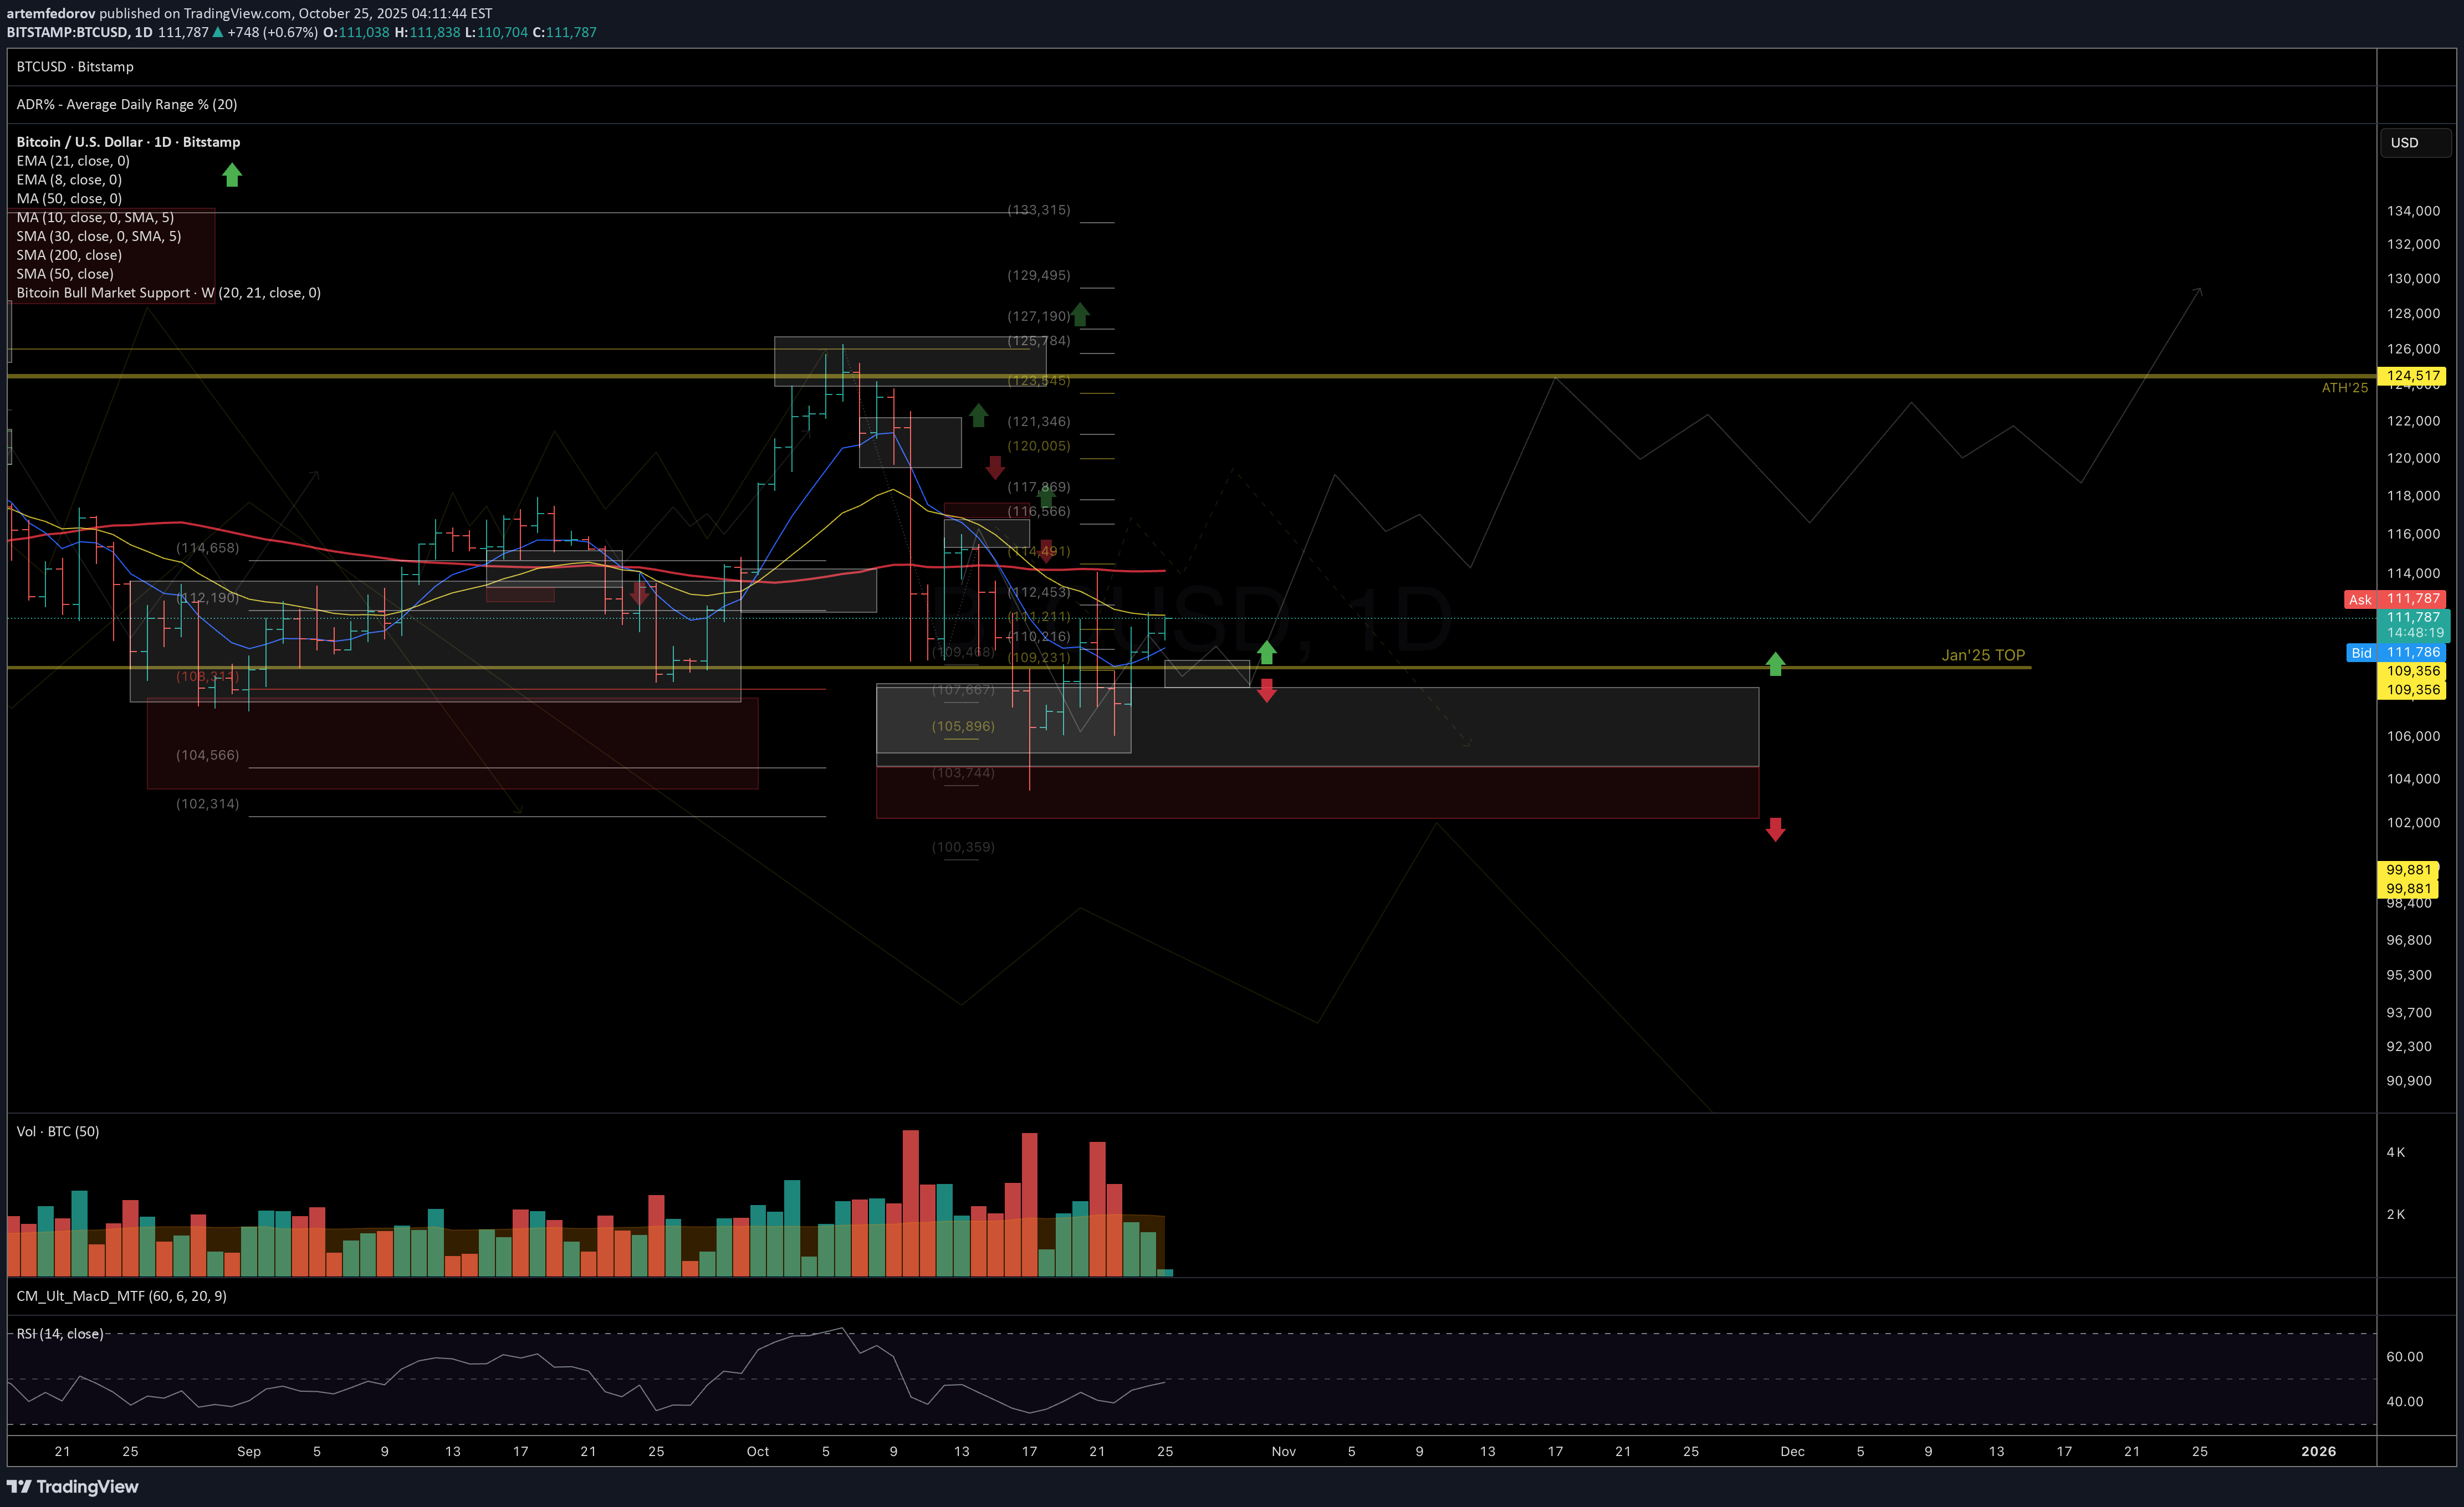
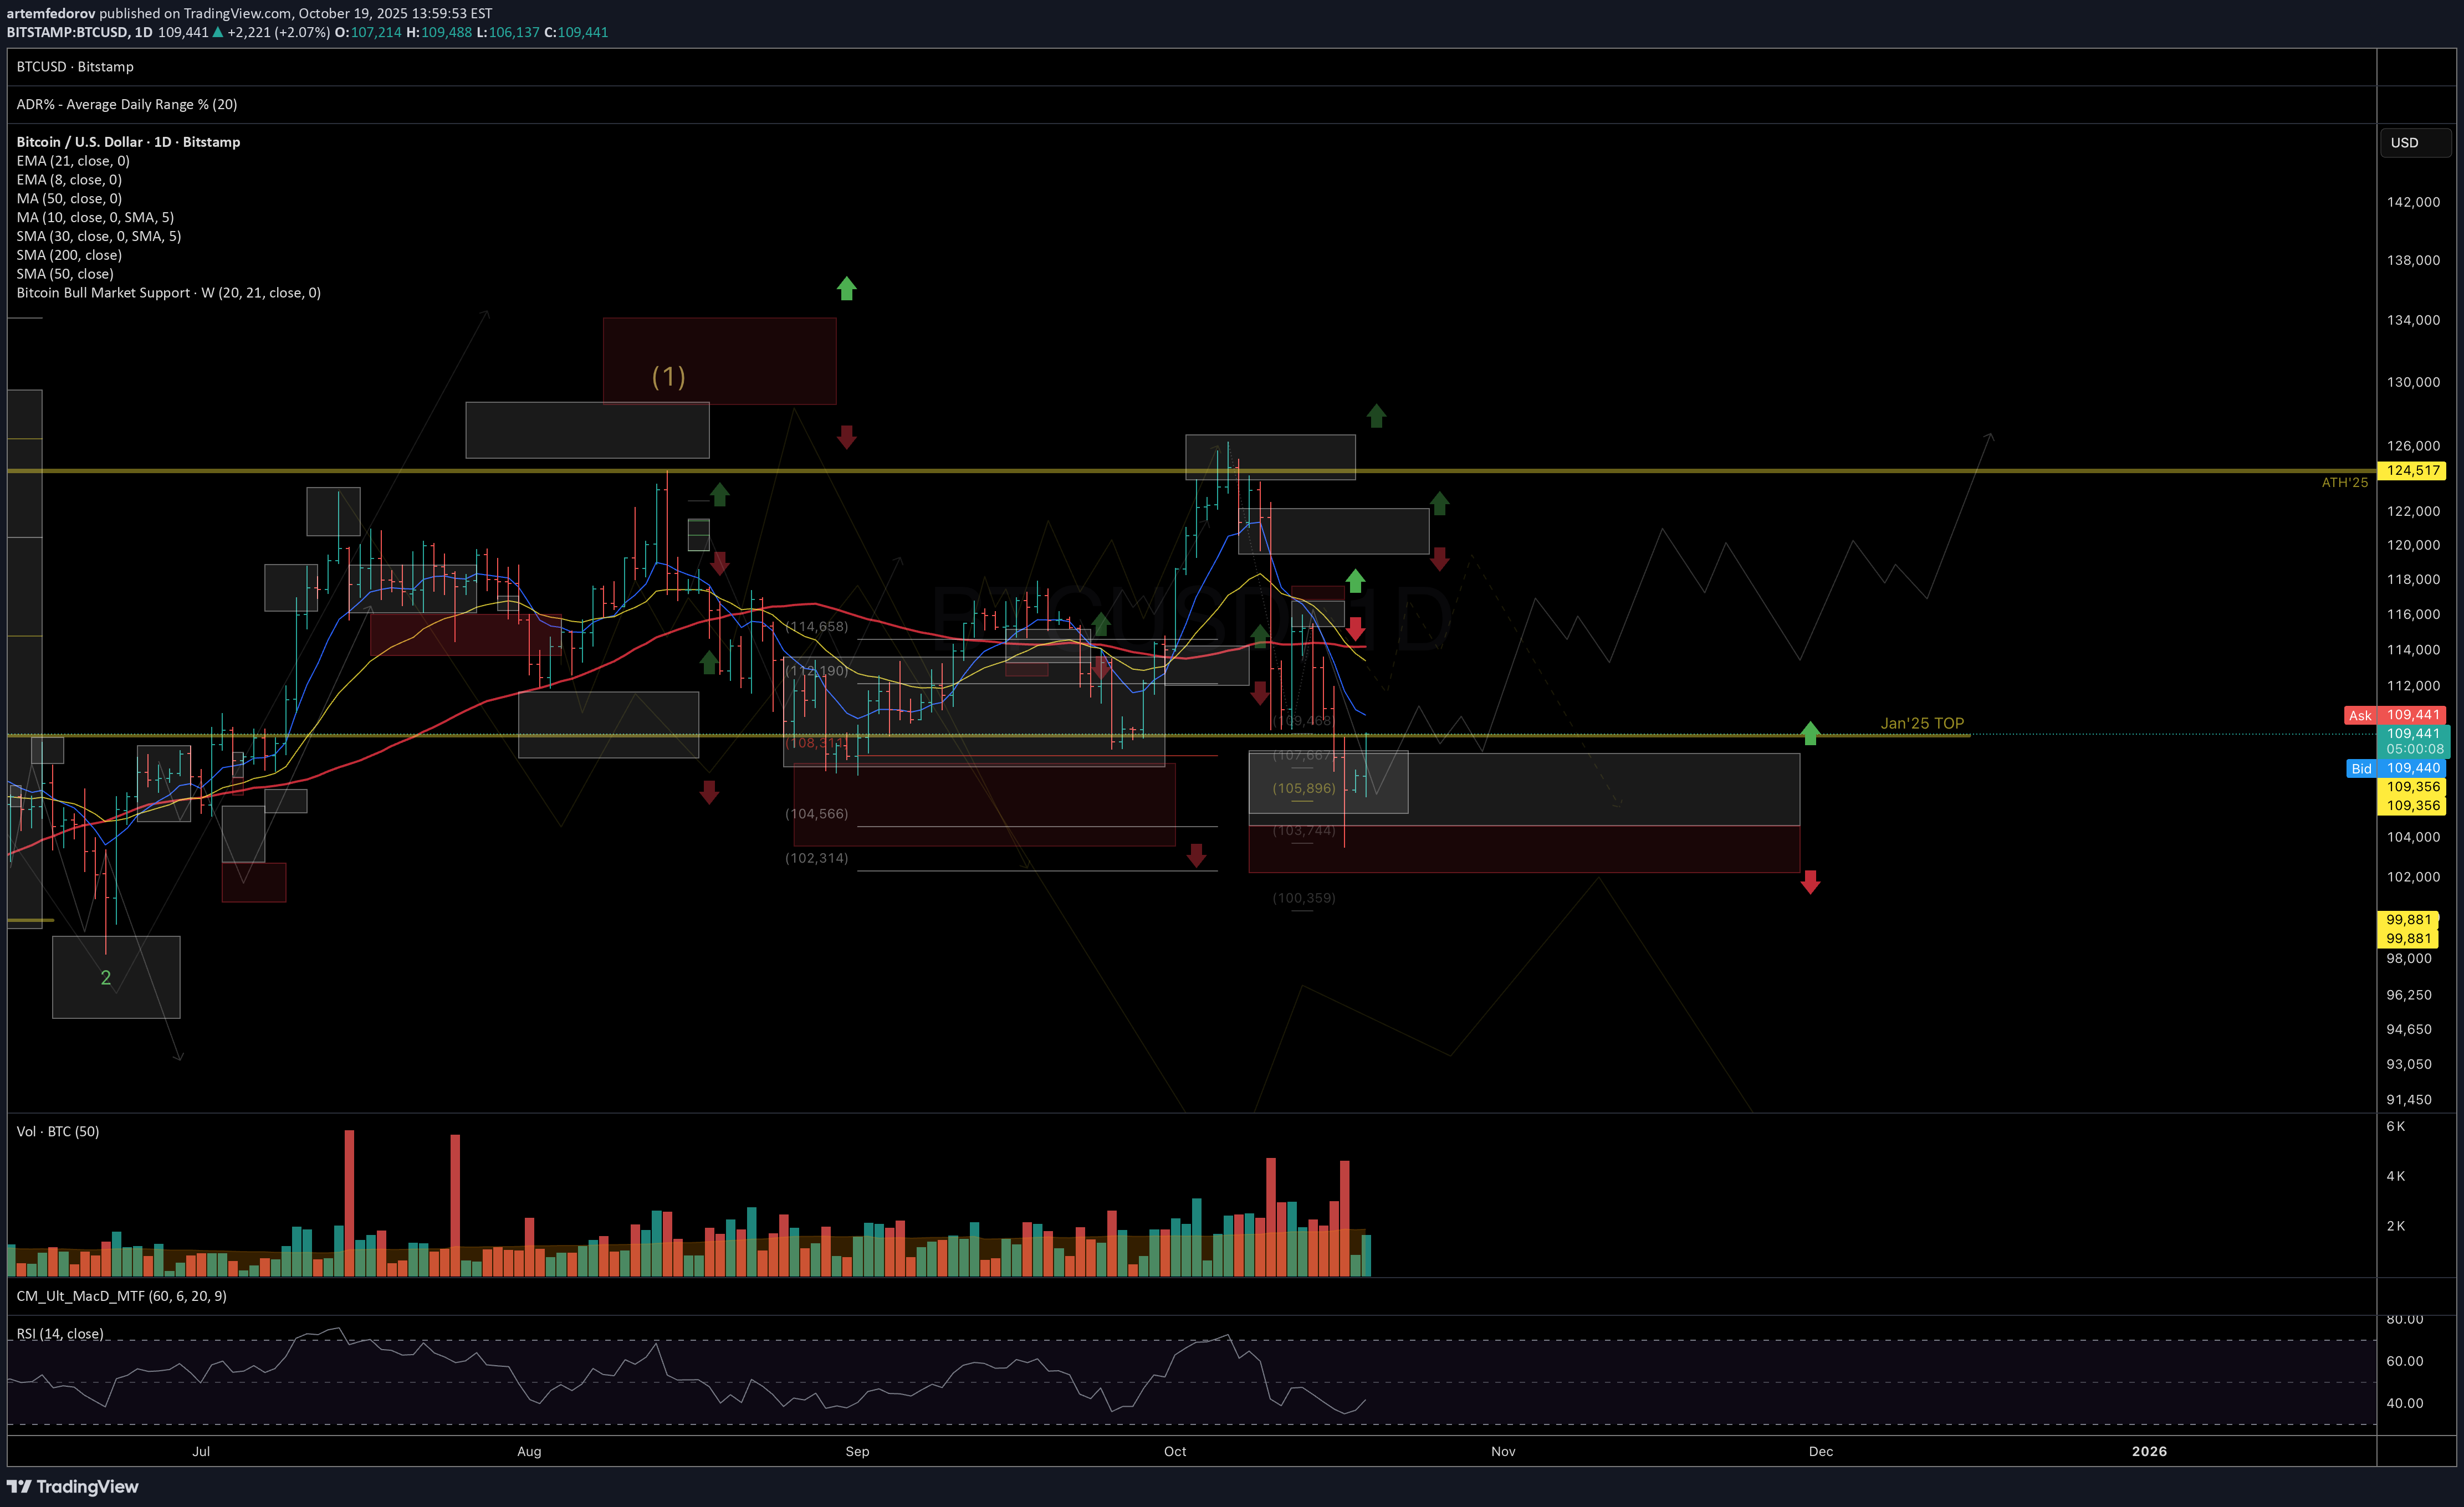
Price continues to move in line with the main scenario discussed in previous weekly updates. As long as the structure remains constructive and key supports hold, I'll be holding the base hypothesis of correction completion and gradual trend recovery as a prime one. In this scenario, over the coming weeks and into Q4, I’d like to see: • price holding above local support; • breakout and consolidation above the 21-day EMA and 50-day MA; • gradual movement toward next resistance zones — 115–120K, followed by 123K+. Key levels: • Local support: 109–107K • Local resistance: 114–116K, then 120–123.5K • Macro support zone: 102K A breakdown below local support may trigger another retest of the lower boundary of the macro-support zone. If weekly closes occur below 102K, it would notably increase the probability that the current long-term uptrend cycle is ending and a macro-correction phase is beginning. Daily time frame: Weekly: Thank you for your attention — wishing everyone a calm weekend and a productive start to the new week!Today’s price action looks constructive and aligns with the main scenario of resuming uptrend. Key intraday level: support zone 113–111.7k must hold. As long as it does, expecting continuation toward next local resistance in the coming hours/days. Break below 111.7k would increase risk of retesting 106–103k zone. Chart (4h):Quick update on #BTC The local trend still looks constructive: price has broken above the nearest resistance level I mentioned earlier and is now testing it as a support zone. To maintain the bullish scenario, it’s important to hold above $111.7k. In this case, I expect continuation toward $120–125k in the coming days. However, if price fails to hold above $111.7k, a more prolonged correction toward $105–102k becomes likely. Watching how this develops. Updated chart:
artemfedorov
گوگل (GOOGL) در آستانه مقاومت حیاتی: مراقب فروشندگان باشید!
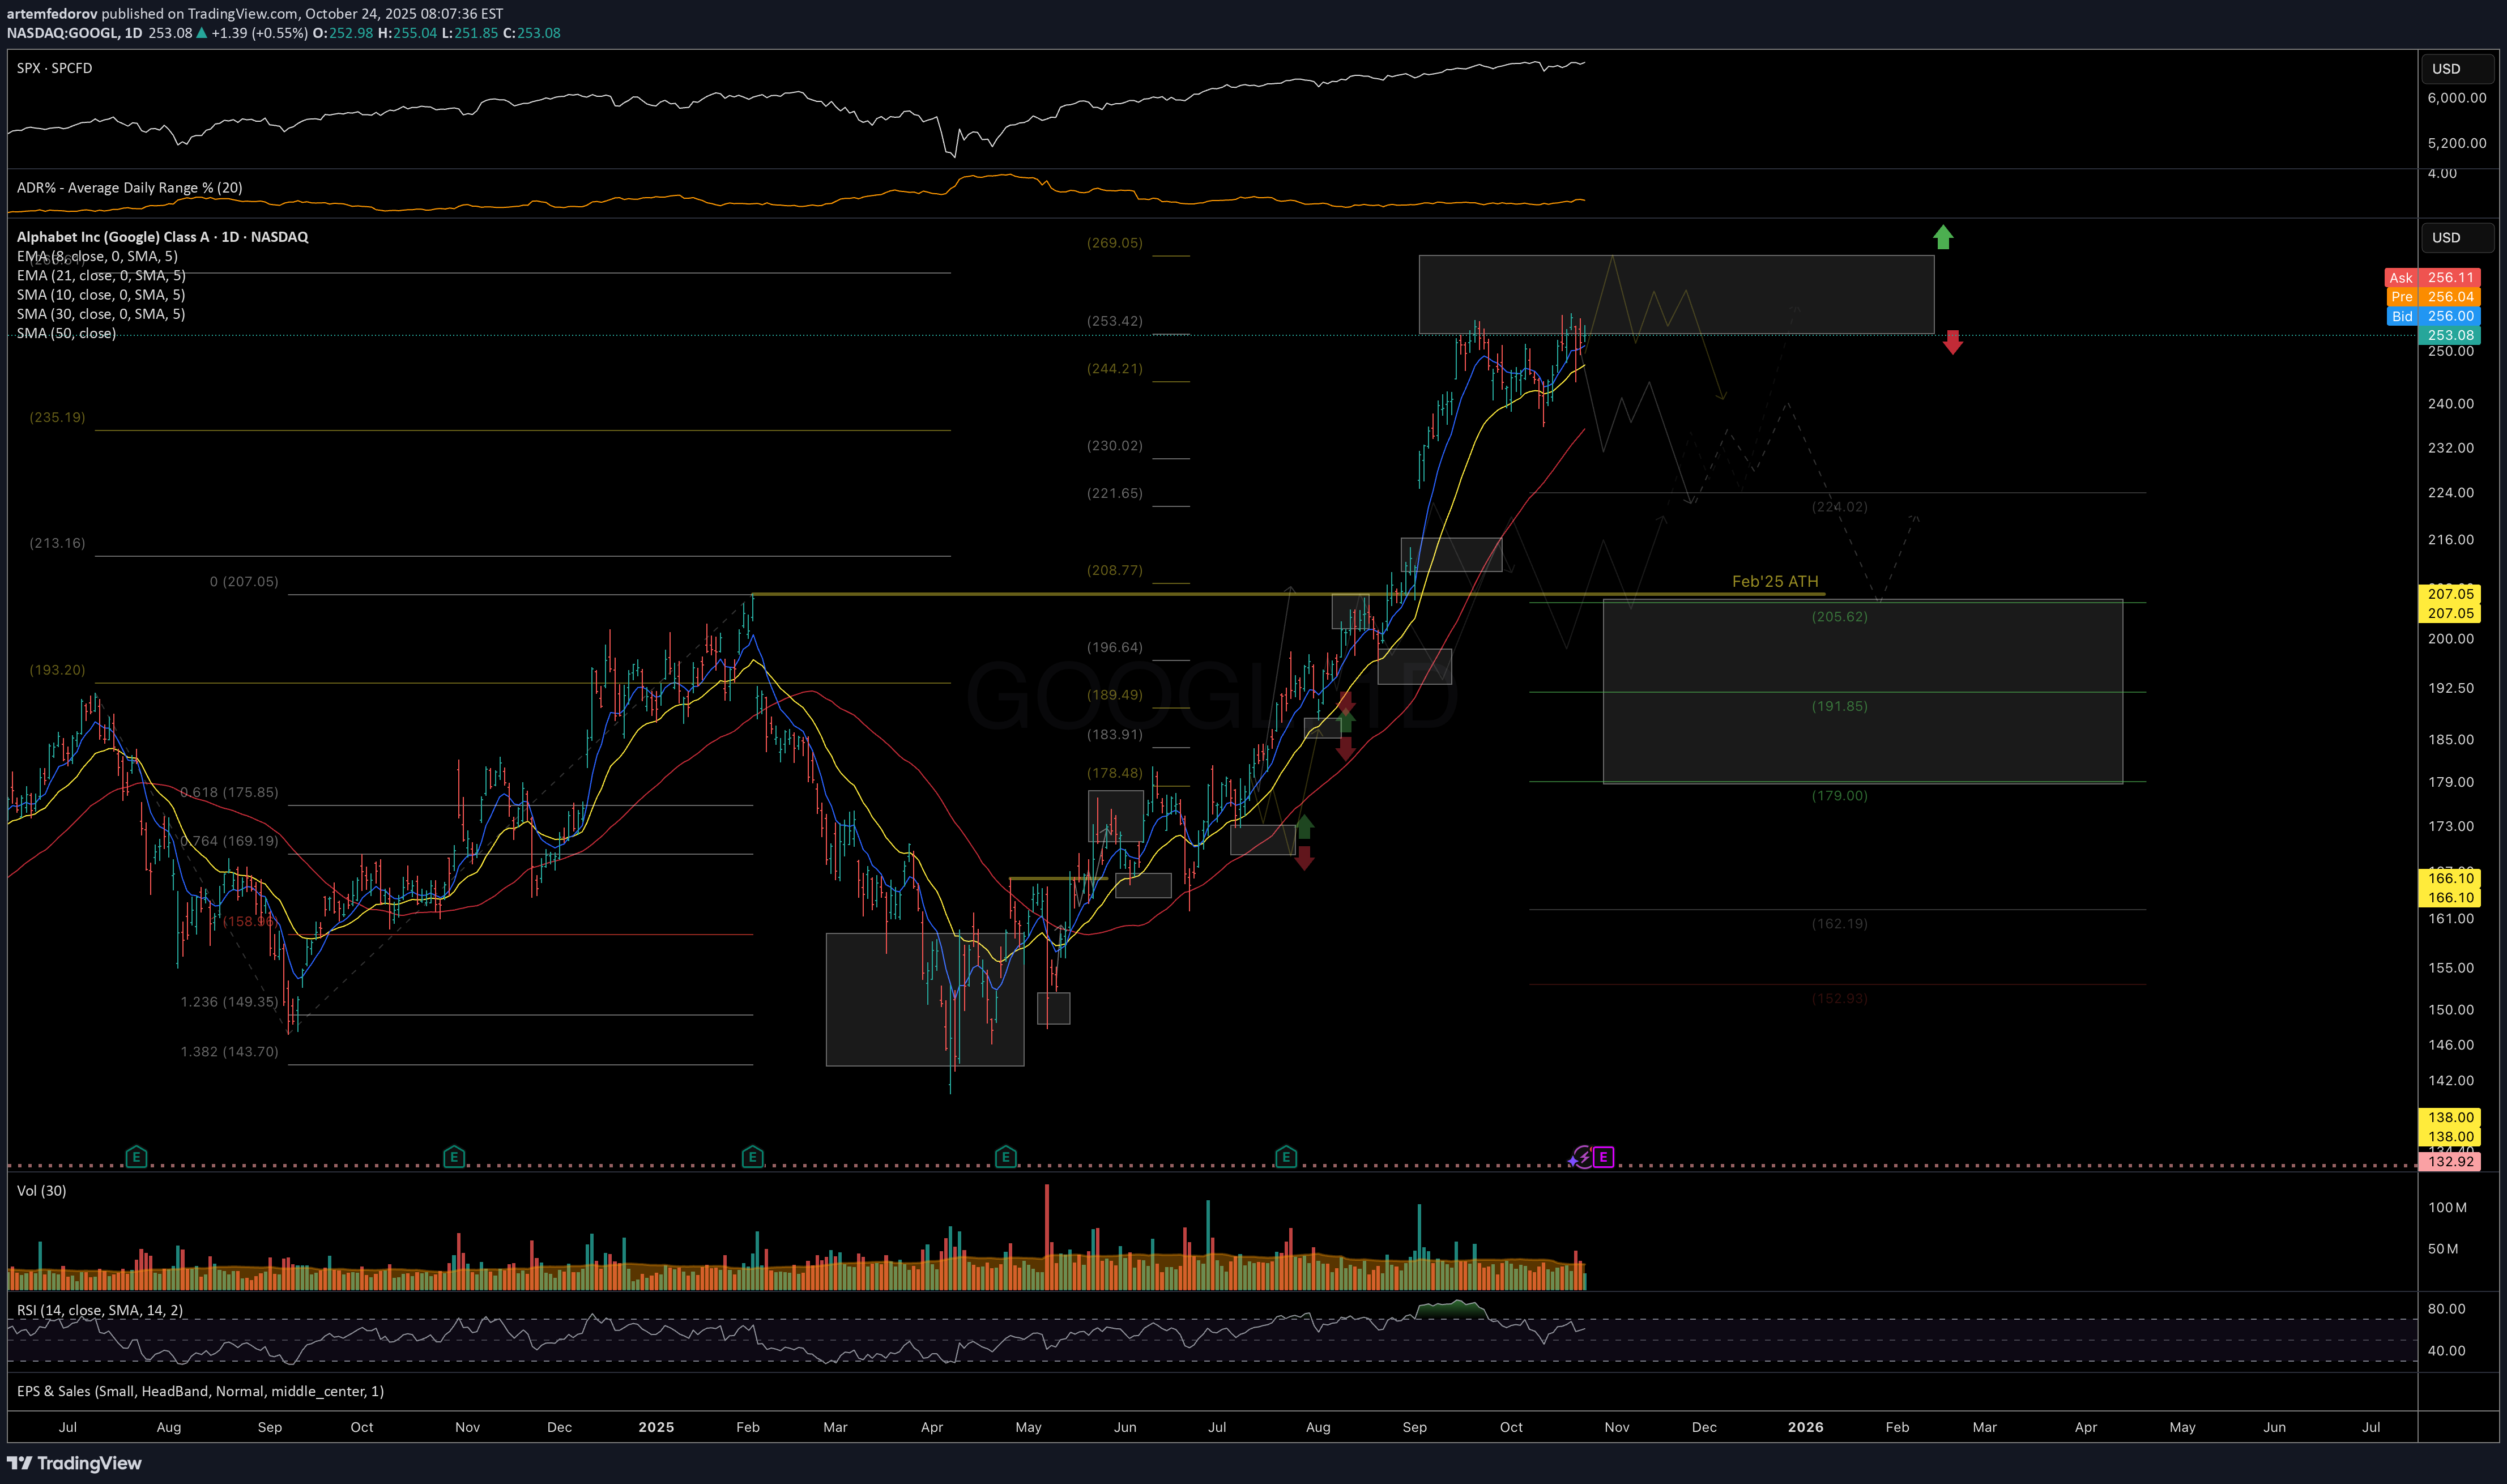
Price has been following the outlined structure from the July and August updates, showing the expected relative outperformance versus SPX. However, instead of forming a prolonged Autumn consolidation, price moved almost directly to the target resistance zone for the uptrend since the April bottom: 250–270. While one more short-term push toward the top of the resistance zone is possible, as long as price remains below 270, I am watching for rising selling pressure and a potential durable consolidation to develop in the coming weeks. If price manages to post a sustained breakout above 270, the current structural view would need to be reassessed. Caution is advised with any new long exposure at these levels, and consider protecting open long positions in case of a reversal or broader market weakness. Chart: Previously: • On resistance and potential consolidation (Aug 29): Chart: Link: https://www.tradingview.com/symbols/NASDAQ-GOOGL/minds/?mind=uAr6w4iORjSXBxZ026OPTQ • On local support (Aug 11): Chart: Link: https://www.tradingview.com/symbols/NASDAQ-GOOGL/minds/?mind=2gOSfJ2US8eHesa1_3FimA • On upside potential & relative strength vs SPX (Aug 5): Link: https://www.tradingview.com/symbols/NASDAQ-GOOGL/minds/?mind=O3UTkv8ESv6n5A5-9tS9sA • On breakout setup (Jul 13): Chart: Link: https://www.tradingview.com/symbols/NASDAQ-GOOGL/minds/?mind=dqJeeM9_REq6HIrMR8Us1AWith price moving and closing decisively above the resistance zone, I’m watching for a potential extension toward the next macro resistance area at 300–323, as long as price continues to close above the 280–270–265 local support zone. Chart:
artemfedorov
تحلیل هفتگی بیت کوین و اتریوم: آیا روند صعودی ادامه مییابد یا منتظر ریزش بزرگ باشیم؟
The market continues to move within the framework of the main hypothesis — a potential completion of the correction from historical highs and the early signs of a possible trend reversal, as discussed in my recent market review: https://www.tradingview.com/chart/BTCUSD/4FXGCnwn-BTC-and-ETH-key-levels-to-watch-in-coming-weeks/ As long as #BTC maintains weekly closes above 102K, the base scenario (both for #BTC and #ETH) remains unchanged — gradual recovery, consolidation, and a move toward new highs. I wouldn’t rule out the possibility that this could happen even before year-end. However, a weekly close below 102K would signal an increased probability that the four-year macro growth cycle has ended and the market could be transitioning into a macro corrective phase across the crypto sphere. Updated key levels and charts: BTCUSD Support: 106K | Resistance: 110–112K Chart: ETHUSD Support: 3680 | Resistance: 4360 Chart: Thank you for your attention, and I wish you a productive start to the week and successful trading decisions ahead!
artemfedorov
سطوح حیاتی بیت کوین و اتریوم: چه اتفاقی در راه است؟
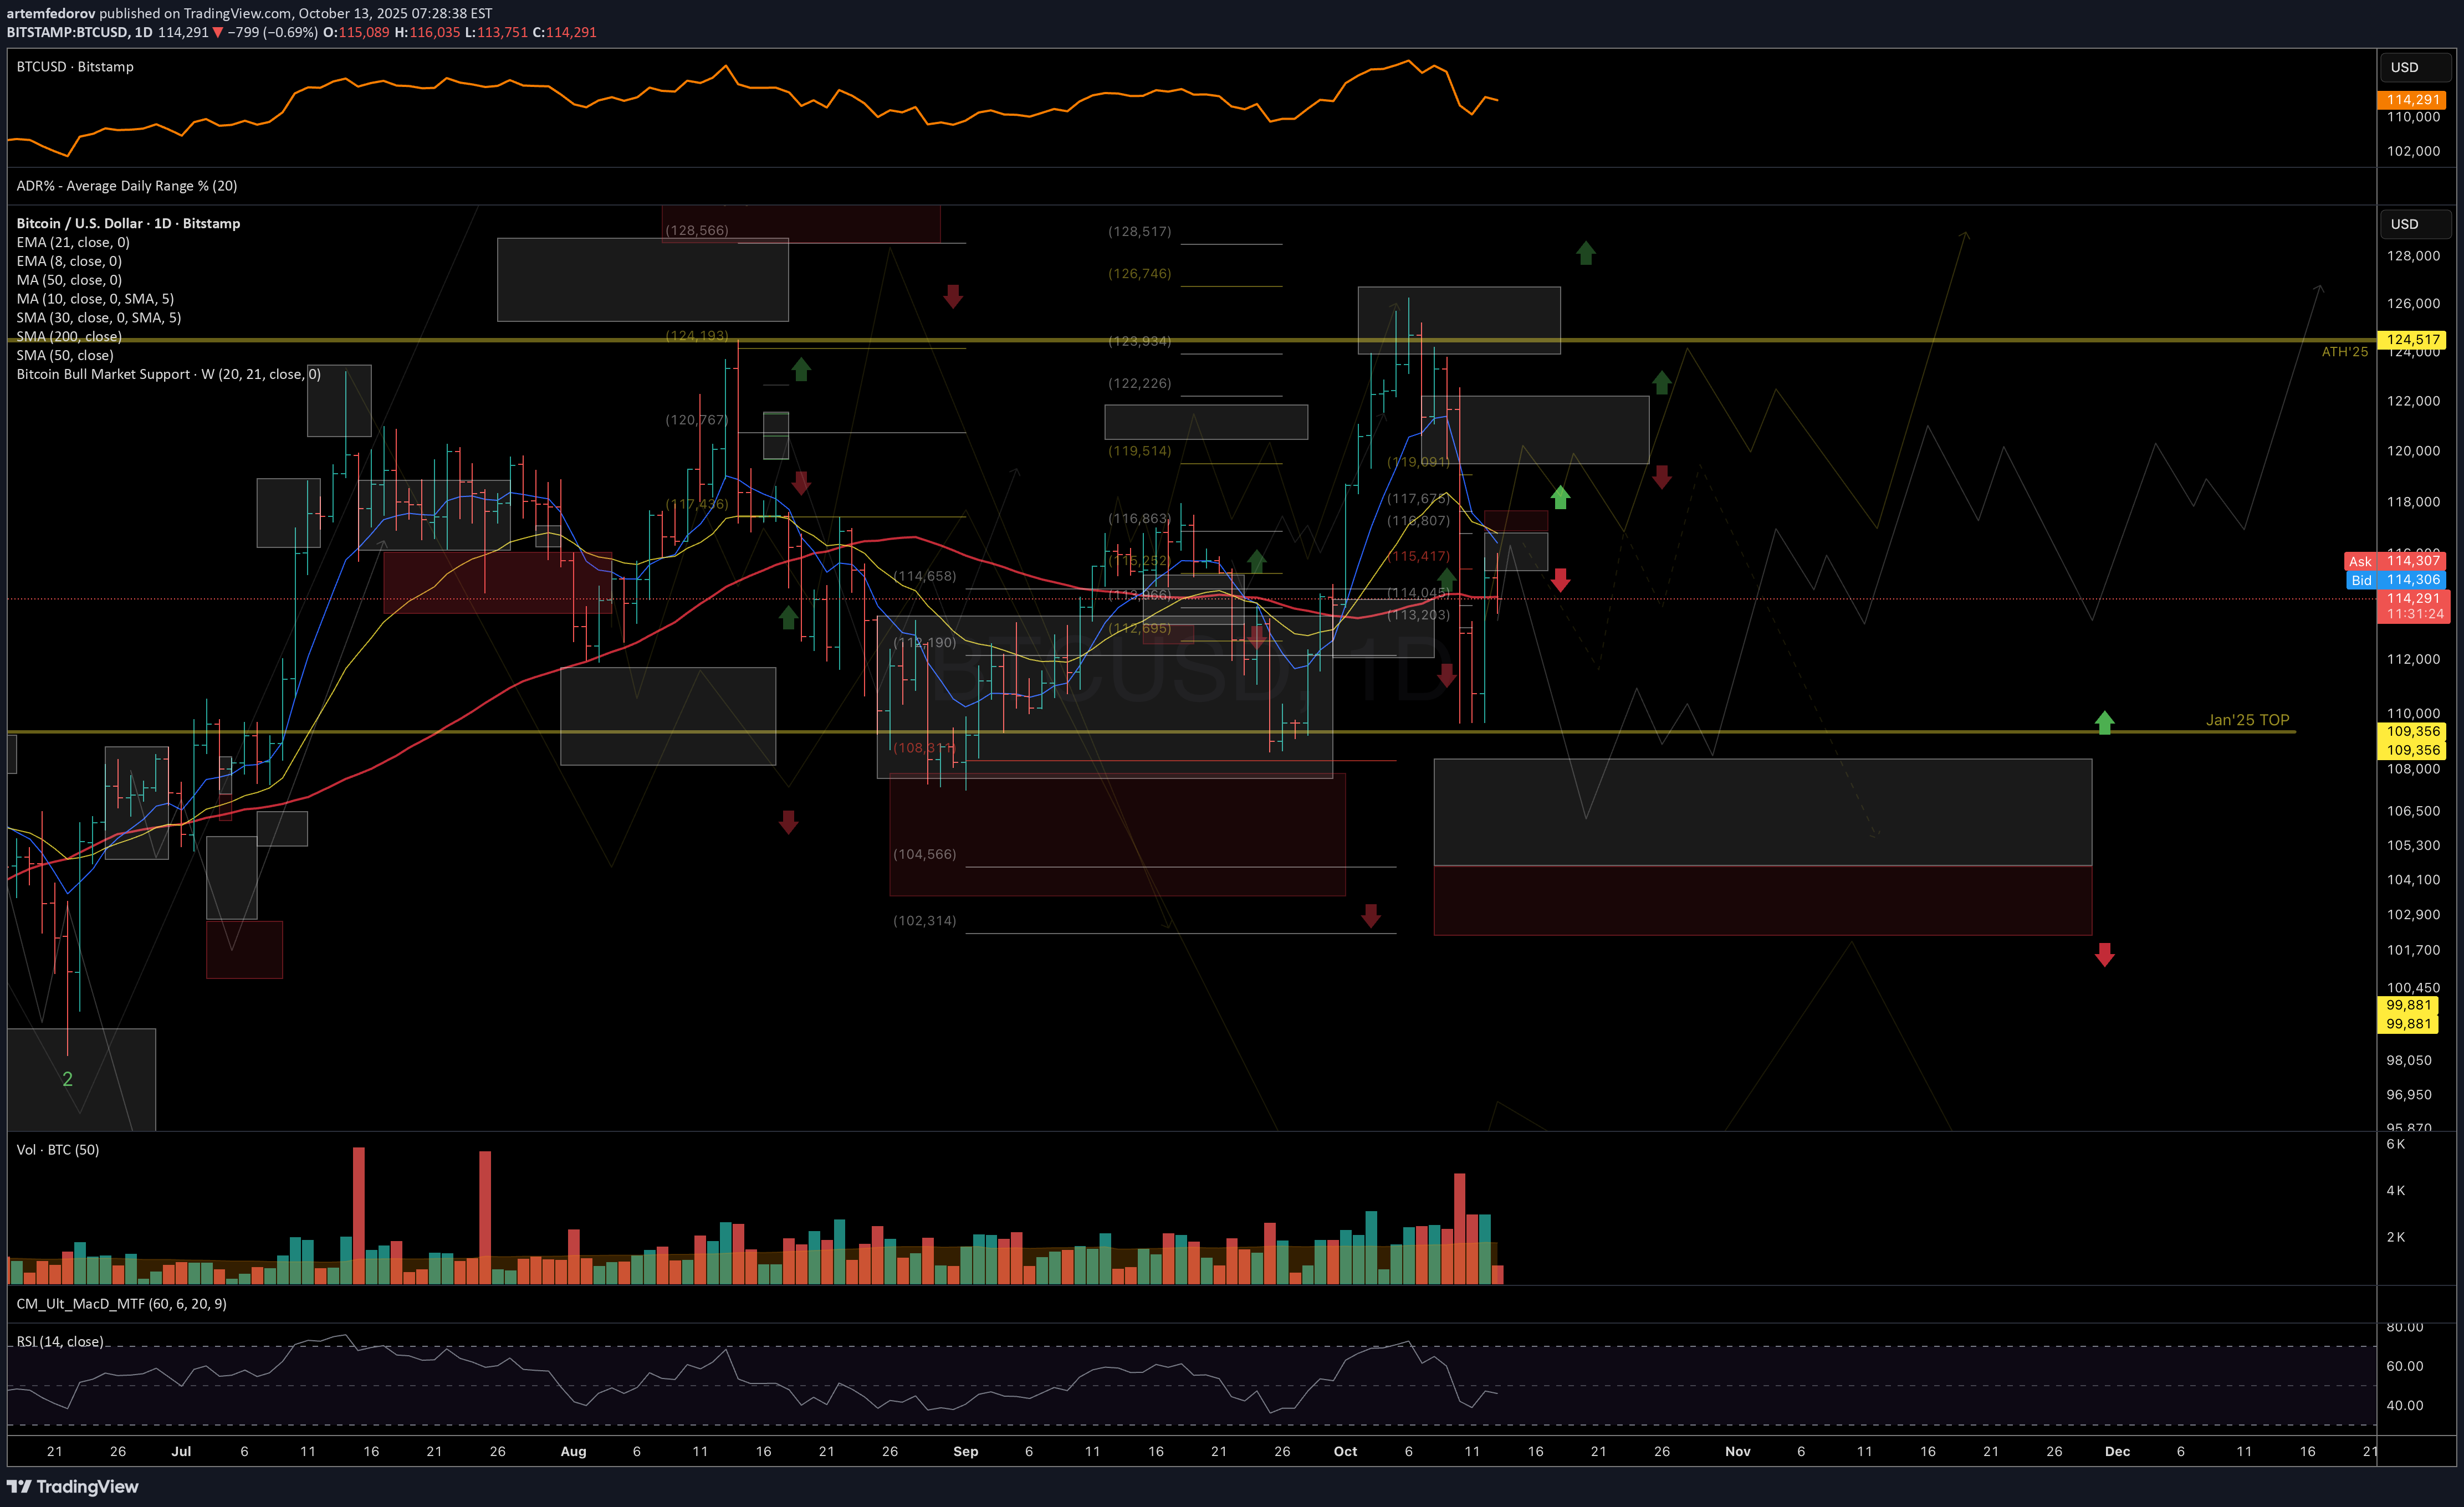
BTC The recovery pattern from the September lows still looks more like a medium-term correction rather than the completion of the broader bullish cycle. As long as the price holds above the macro support zone at 108–102K and does not close below the 50-week moving average for more than two consecutive weeks, I consider the macro uptrend intact and expect the correction to conclude in Q4. However, while Bitcoin remains below 118K, another wave of selling toward the 108K area in the coming weeks cannot be ruled out before a potential new leg higher. Chart (taken on Oct 12): Short-term resistance zone: 115.5–118K Macro support zone: 108–102K ⸻ ETH The price has moved deeper into the macro support area highlighted in earlier reviews and reached key weekly moving averages (20SMA and 21EMA), which have historically provided support to every major growth cycle. On the daily timeframe, as long as the price remains above 3290, the main scenario remains bullish — with potential for new highs in Q4. Ideally, I would like to see ETH hold the 3840–3700 zone during the current recovery attempt and form a constructive consolidation above the 21/50-day moving averages. If assets maintain their macro support zones, I expect Ethereum could once again outperform Bitcoin in the next phase of the uptrend. Chart: Short-term resistance zone: 4180–4360 / 4550 Local support zone: 3960–3700 ⸻ In light of the historic liquidation event we witnessed last week, I’d like to share a quote from one of the veteran traders and original Market Wizards — Peter Brandt: "Greetings crypto traders whose Friday was not a cheerful day. I need to tell you that there will be better tomorrows. While the tunnel may seen dark, there can be bright days in front of you depending upon how you respond to your present circumstances. ... Wealth - real wealth that is secure and lasting - does not come from "bet the farm" speculative bets. Real wealth comes from accepting investing as a marathon, not a sprint. Real wealth comes from controlling risk, not from taking huge gambles. Real wealth comes in the accumulation in small pieces, gained, then protected. I love that the younger generation to which you belong has taken an interest in speculative markets such as crypto and futures. Welcome. This is the arena I have operated in now in the 6th different decade starting in the 1970s. I wiped out several accounts in the early days. These are not fond memories. But I kept at it. For me I learned how to control my risk. What does that mean exactly? Well, for me it means to limit my risk on any given bet to no more than 1% of my total pot. I know that sounds too tame to be meaningful, but if you do not want to go through what you experienced this past week, then perhaps it should be meaningful. It also means that I do not bet any more than 3% of my entire trading capital on the composite of highly correlated bets. I have noticed that some in the crypto space wear as a badge of honor that they can sit through 80% drawdowns. Well, that is NOT a badge of honor. It is a crown of shame. Anyone who thinks lightly of 80% drawdowns will end up rekt at the end of the game. If you doubt me, then stay on your present course and find out. ... So, I encourage you. Take this past week as a serious lesson of investing and of life. Take ownership of your mistakes. Don't blame this past week on some "whale" or manipulator. Own it. And move forward having learned some valuable lesson " ⸻ Thank you for your attention! In times of heightened volatility, please remember - protecting your emotional capital is just as important as protecting your financial one. Stay disciplined, patient, and kind to yourself through market turbulence - it’s part of every trader’s journey toward mastery. Let’s leave the past behind, take the lessons it offered, and focus on the next trade with a clear vision and renewed confidence. Wishing everyone a strong and productive start to the new week!
Disclaimer
Any content and materials included in Sahmeto's website and official communication channels are a compilation of personal opinions and analyses and are not binding. They do not constitute any recommendation for buying, selling, entering or exiting the stock market and cryptocurrency market. Also, all news and analyses included in the website and channels are merely republished information from official and unofficial domestic and foreign sources, and it is obvious that users of the said content are responsible for following up and ensuring the authenticity and accuracy of the materials. Therefore, while disclaiming responsibility, it is declared that the responsibility for any decision-making, action, and potential profit and loss in the capital market and cryptocurrency market lies with the trader.