Technical analysis by artemfedorov about Symbol BTC: Sell recommendation (11/24/2025)

artemfedorov
بررسی هفتگی رمز ارز: آیا بیت کوین وارد زمستان کریپتو میشود؟ (تحلیل کلان و کوتاهمدت نزولی)
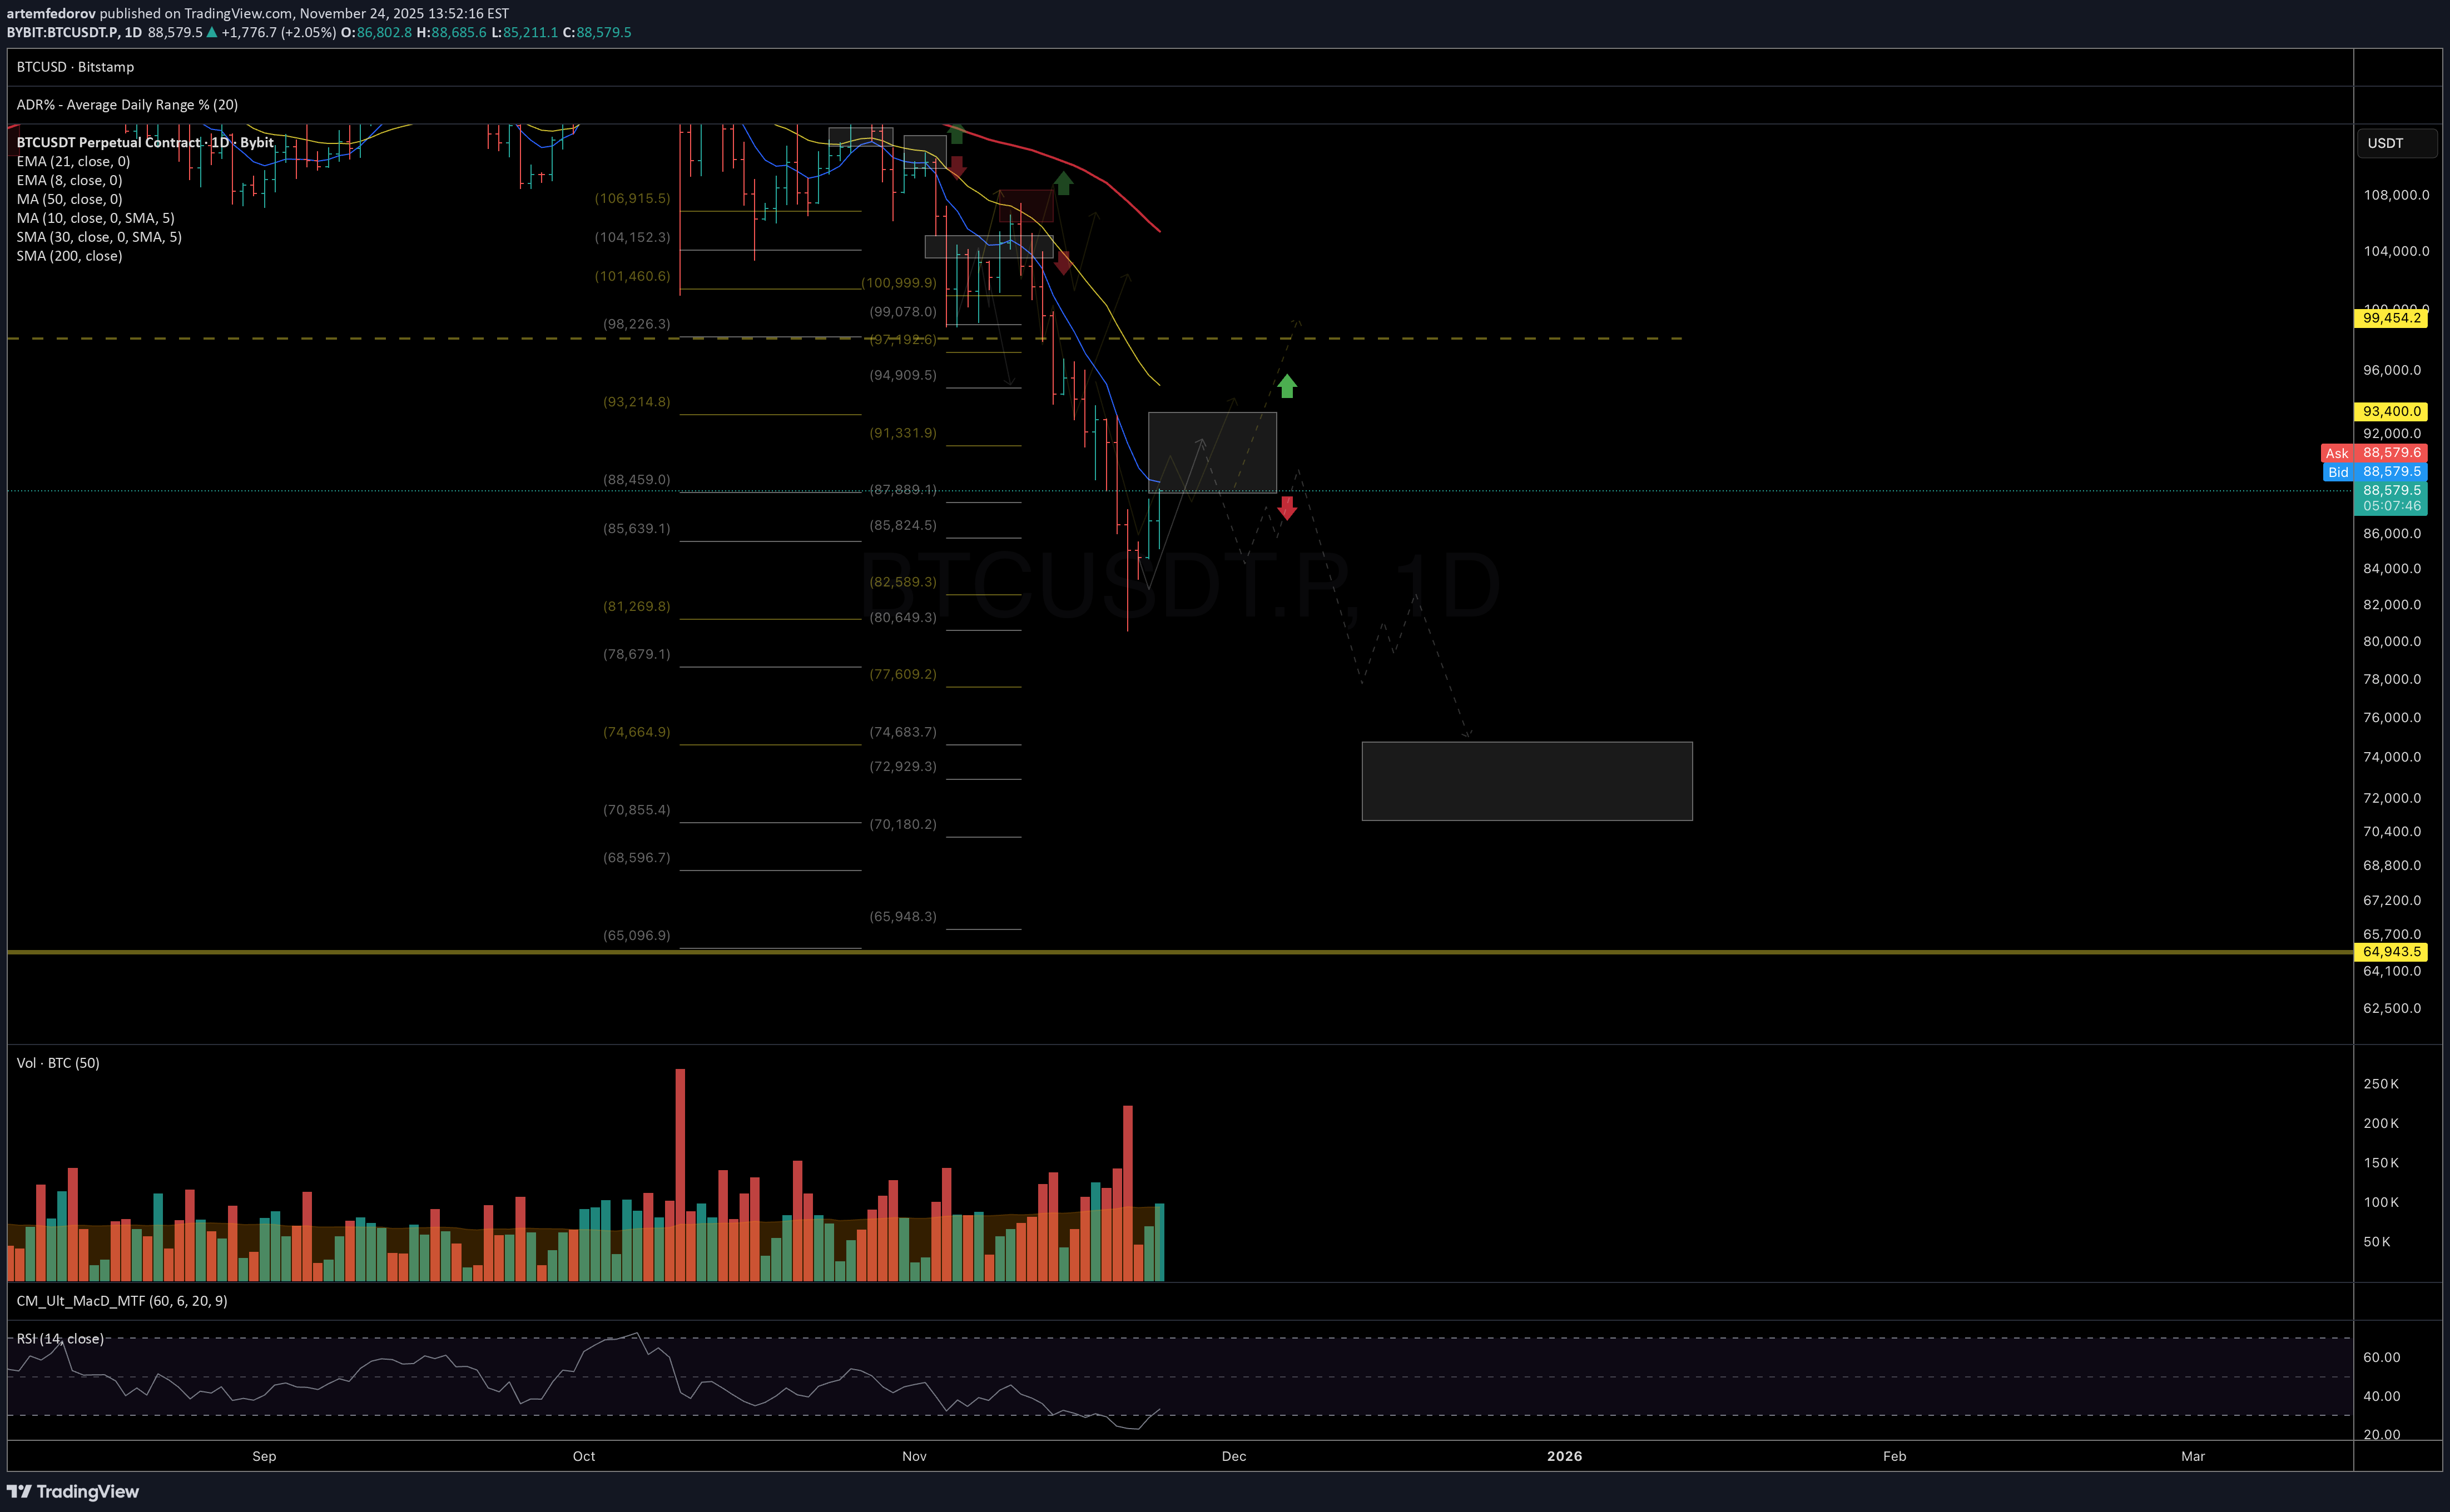
Bitcoin Bitcoin is closing its second consecutive week below the 50-week moving average. Throughout this growth cycle (since the 2022 lows), price has always found support at these levels. Chart: Historically, closing below this level for more than two weeks in a row has almost always marked the start of a macro-correction cycle or ‘crypto winter,’ rather than just a standard drawdown. Chart: On RSI: The Weekly RSI, which maintained an uptrend throughout 2024 and almost all of 2025, decisively broke its long-term support line in November. As long as RSI remains above the support line, the bullish cycle structure usually holds; however, a downward breakdown often coincides with the completion of a growth phase. Chart: The combination of these two signals—dropping below the 50-week average and the RSI support breakdown—sharply increases the probability that the market has already entered a macro-correction phase. In my view, the probability of this scenario is currently over 80%. On 200W MA In all past cycles, the final Bitcoin bottom formed specifically around the 200W MA. Currently, this sits near 66k, and by mid-2026, it could rise to the 73–75k range, fitting a scenario of a further 15–20% decline from current levels. Chart: Expectations for the week: I see potential for another correction wave as long as price remains below 93k. In the coming days/week, it is logical to expect a bounce (already in progress) toward this resistance zone; however, without sustained consolidation above it, the risks of another drop toward 75–70k remain high. Chart: If the market does test the 75–70k zone, a local bottom may form there, triggering a powerful bearish rally toward the falling 200-day average. This is the ‘dead cat bounce’ scenario with potential upside of around +40%, typically used to regroup positions in the middle of a bearish phaseIf price fails to break out above today’s highs, the odds increase for the downside structure outlined in the November update, with an ideal support target around 75K. Chart: