Technical analysis by artemfedorov about Symbol TSLAX on 11/6/2025

artemfedorov
احتمال سقوط دوباره تسلا: آیا کف قیمتی 430 دلاری محقق میشود؟
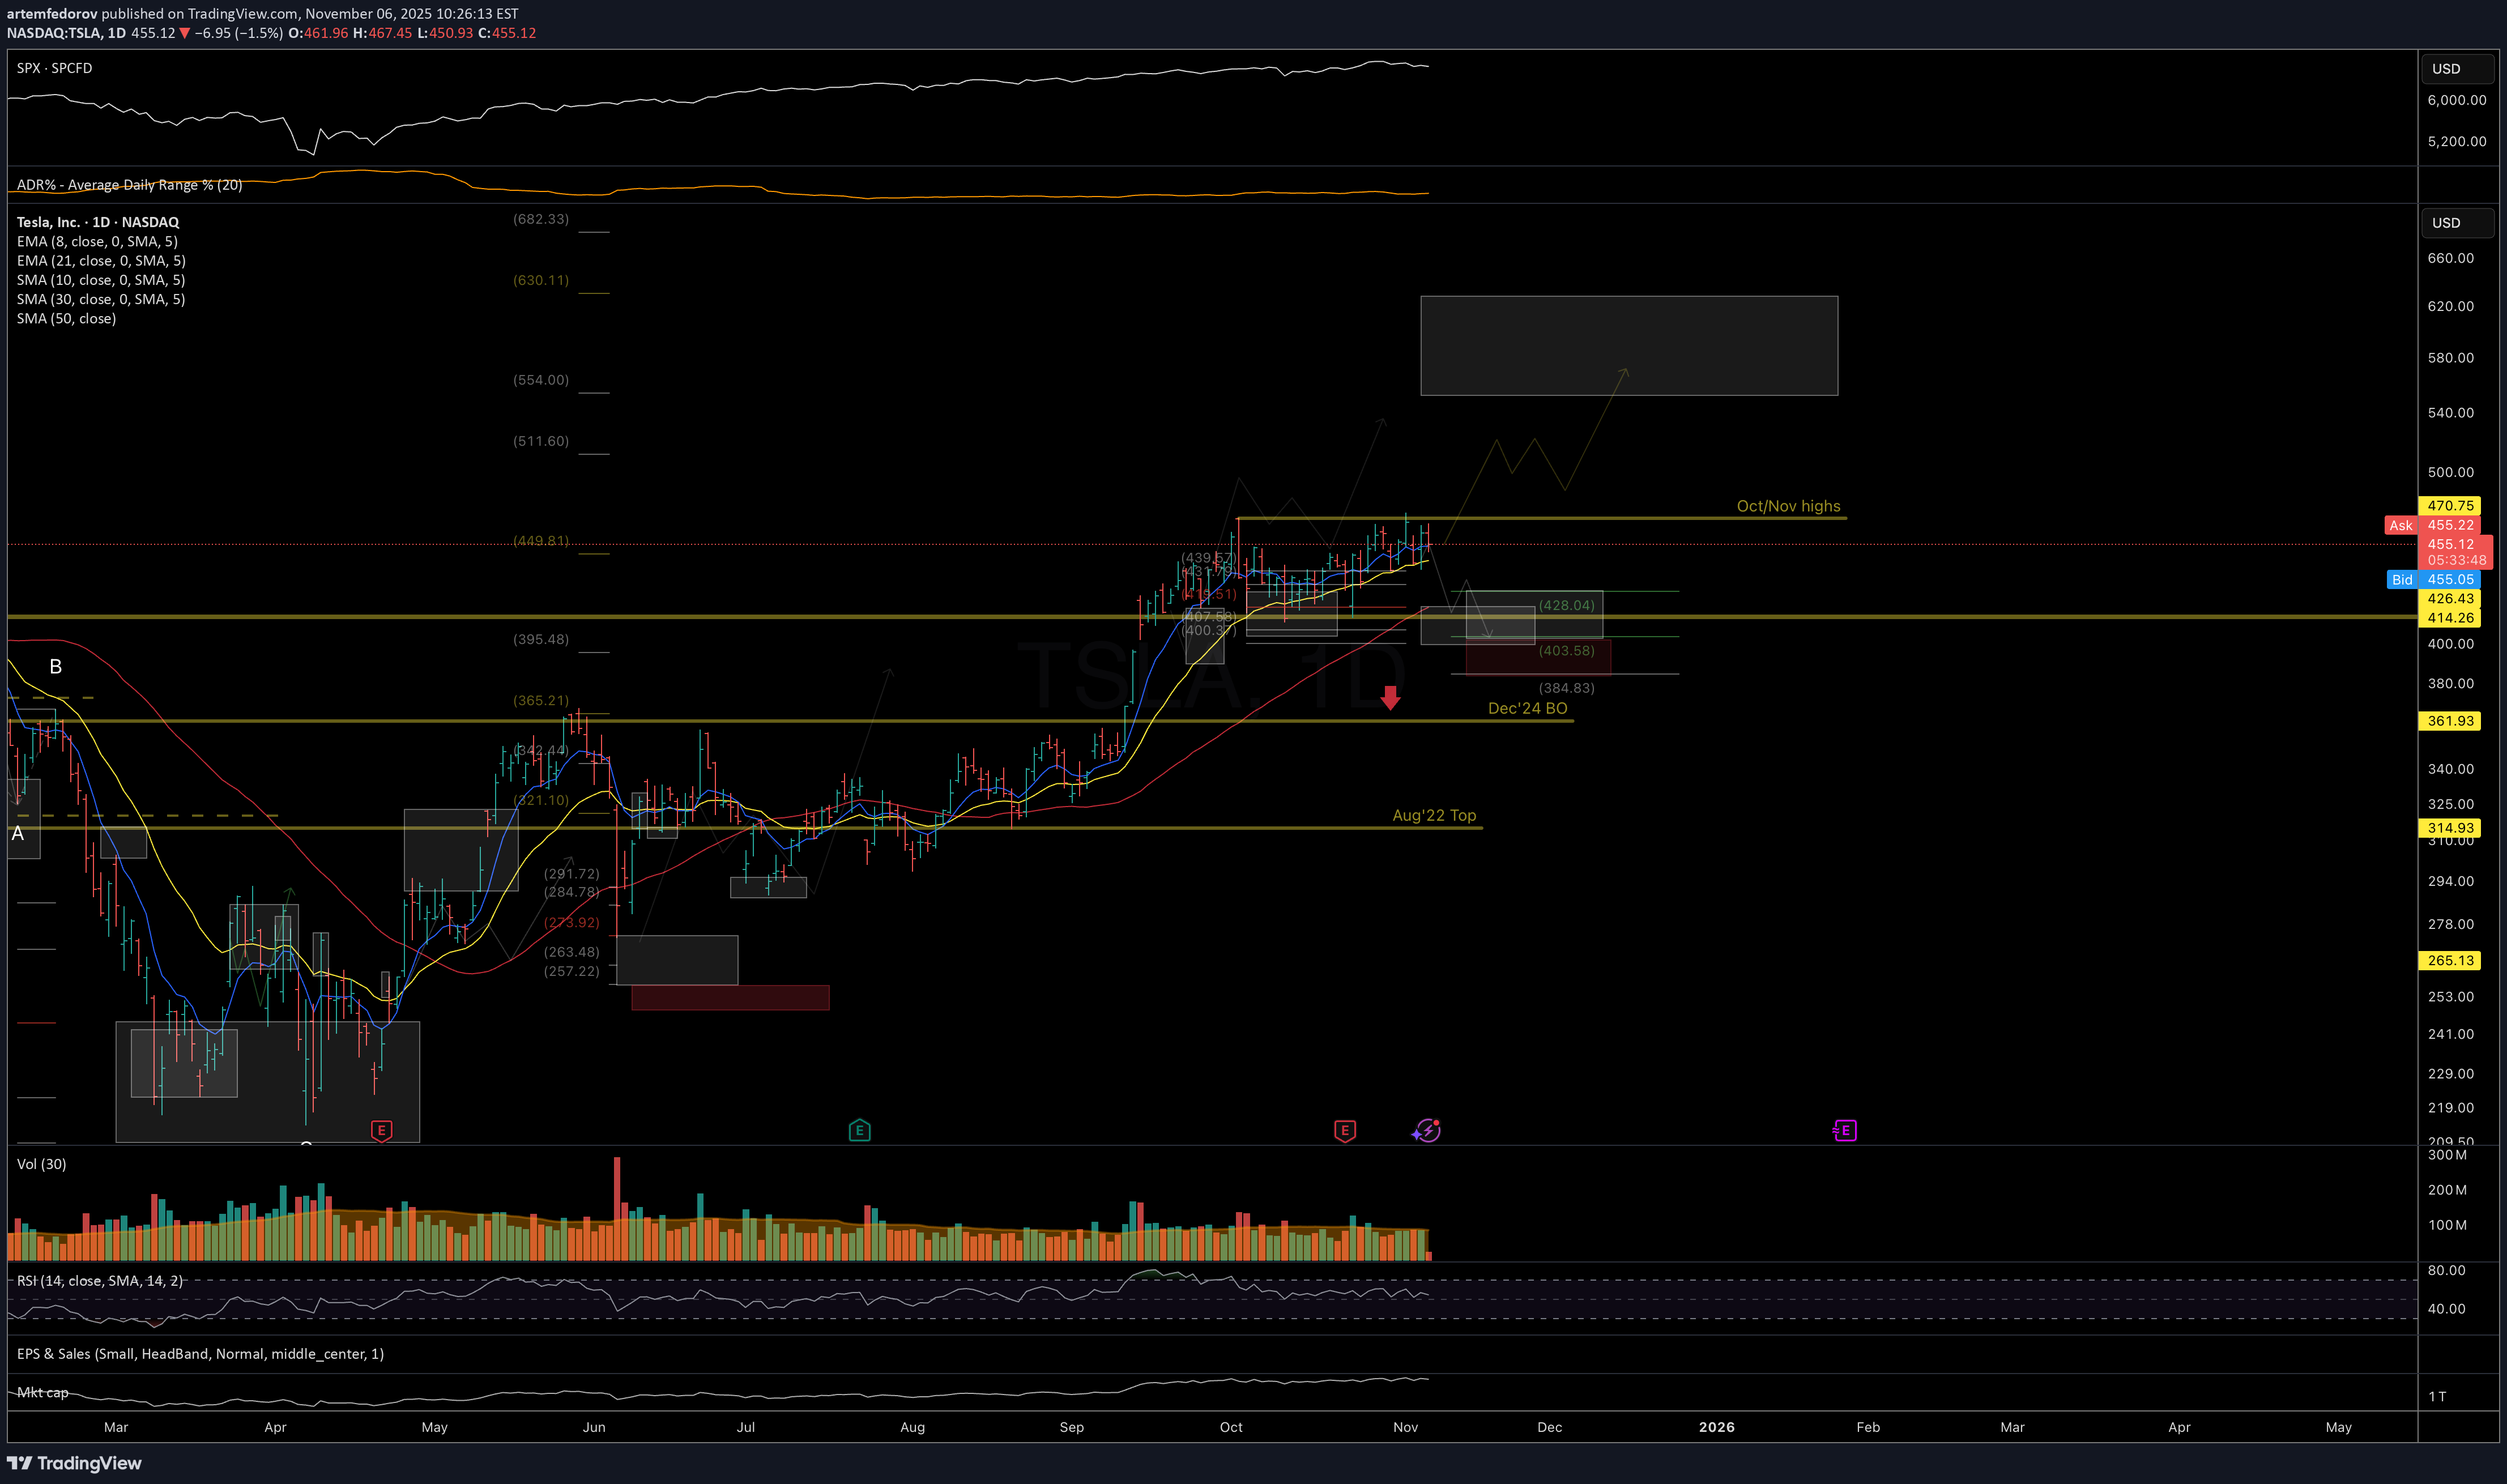
TSLA Watching for one more leg down into the 430–400 mid-term support zone to potentially complete the corrective structure, if price remains unable to break out above the October/November highs. Chart: https://www.tradingview.com/x/fxaKSBiD/ Alternatively, if price manages to break-out and stay above above recent resistance, odds favor continuation to 555-630 resistance zone. Chart: https://www.tradingview.com/x/F6LjJxbc/ Previously: • On macro bottoming potential (Jun 6): https://tradingview.com/symbols/NASDAQ-TSLA/minds/?mind=yJtQ-ZNkTZ2JLpW24O8Rgw • On support (Sep 19): https://www.tradingview.com/x/LgEJk7t4/ • On mid-term support (Oct 7):Price reached the bottom of ideal resistance Chart:Price continued to follow the primary hypothesis of further downside and has now reached the lower boundary of the ideal mid-term support zone. The bounce reaction seen last Friday looks constructive, but preferably we’d want to see a higher-low formation before expecting continuation back toward — and potentially above — the October highs. A break below Friday’s low would shift the odds toward a deeper, more prolonged correction, potentially retesting the September breakout zone. Chart: