
SMC-Trading-Point
@t_SMC-Trading-Point

What symbols does the trader recommend buying?
Purchase History
پیام های تریدر
Filter
SMC-Trading-Point
XAU/USD)Bullish trend analysis Read The caption
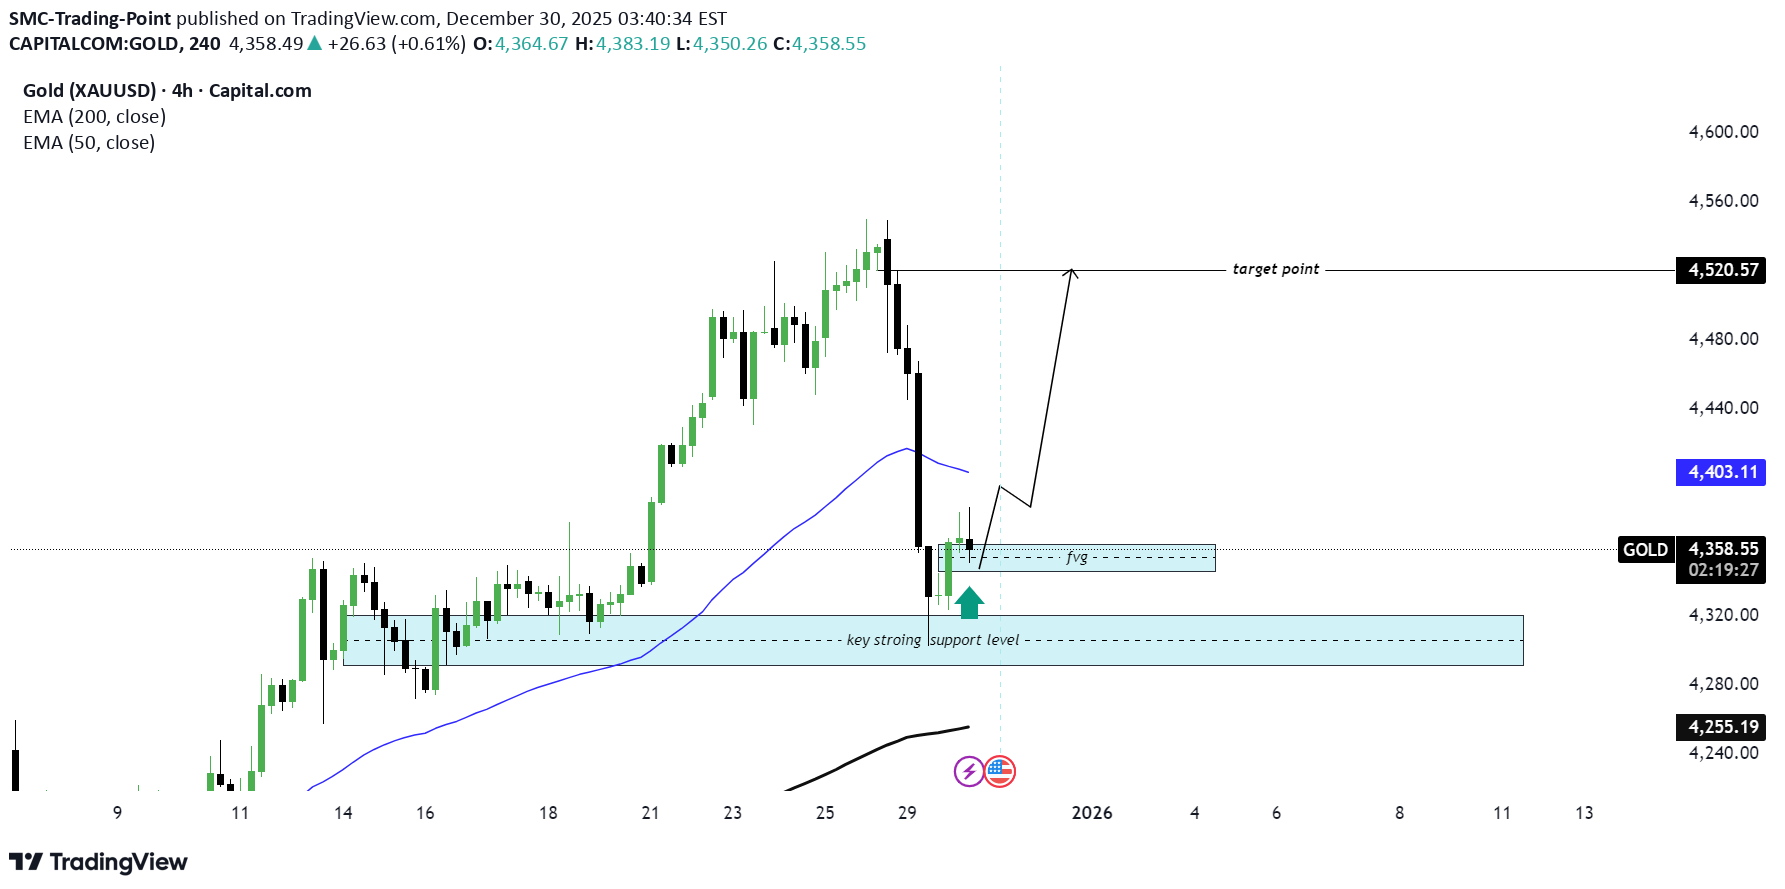
SMC Trading point update Technical analysis of XAUUSD (Gold) – 4H chart using SMC + EMA + HTF support logic. ⸻ Market Context (4H) • Primary bias: Bullish continuation (after correction) • Strong impulsive sell-off was corrective, not a trend change • Overall higher-timeframe structure is still bullish • Price is now reacting from a key HTF support zone ⸻ What Just Happened • Price swept sell-side liquidity aggressively • Immediate rejection from lows → strong bullish reaction • This indicates smart-money absorption at discount • Market is now in a recovery / rebalancing phase ⸻ Key Levels on Chart HTF Demand / Strong Support Zone ~4,285 – 4,325 • Labeled as key strong support level • Previous consolidation base • Where institutions previously accumulated • Area of highest-probability defense FVG / Re-entry Zone ~4,345 – 4,365 • Inefficiency left by impulsive drop • Ideal pullback / continuation zone • Price already reacting here (green arrow) ⸻ Trade Idea (Primary Scenario) BUY Setup (Continuation Play) • Entry: 4,345 – 4,365 • Stop Loss: Below 4,285 • Targets: • TP1: 4,403 (EMA 50 / mid-structure) • TP2: 4,480 • Final TP: 4,520 (marked target point / liquidity above highs) RR potential: ~1:3+ ⸻ Confirmation Checklist Before committing size, look for: • Bullish engulfing from FVG • Strong rejection wicks • Lower-timeframe CHoCH • Price holding above the strong support zone ⸻ Invalidation • 4H close below ~4,285 • Acceptance below HTF demand If that happens → bullish continuation is invalid, and deeper downside is possible. ⸻ Mr SMC Trading point Summary This setup shows classic HTF liquidity grab → reaction → continuation: • Sell-side liquidity taken • Strong HTF demand respected • FVG acting as re-entry • Clear upside liquidity target Please support boost this analysis
SMC-Trading-Point
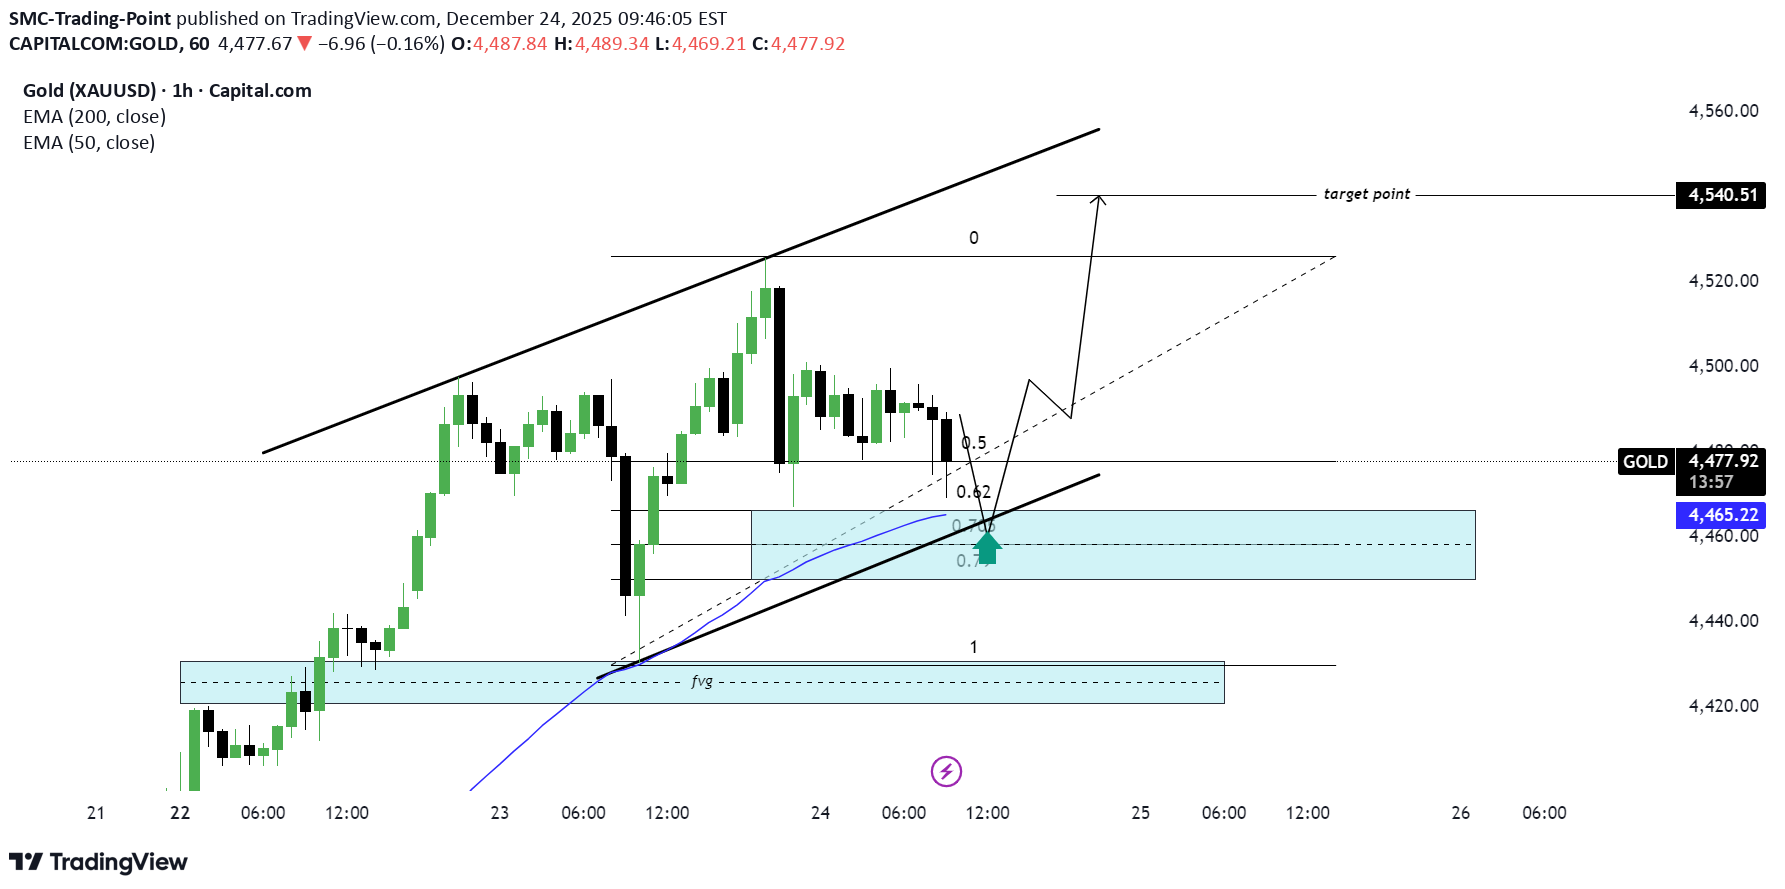
XAU/USD)Bullish trend analysis Read The caption
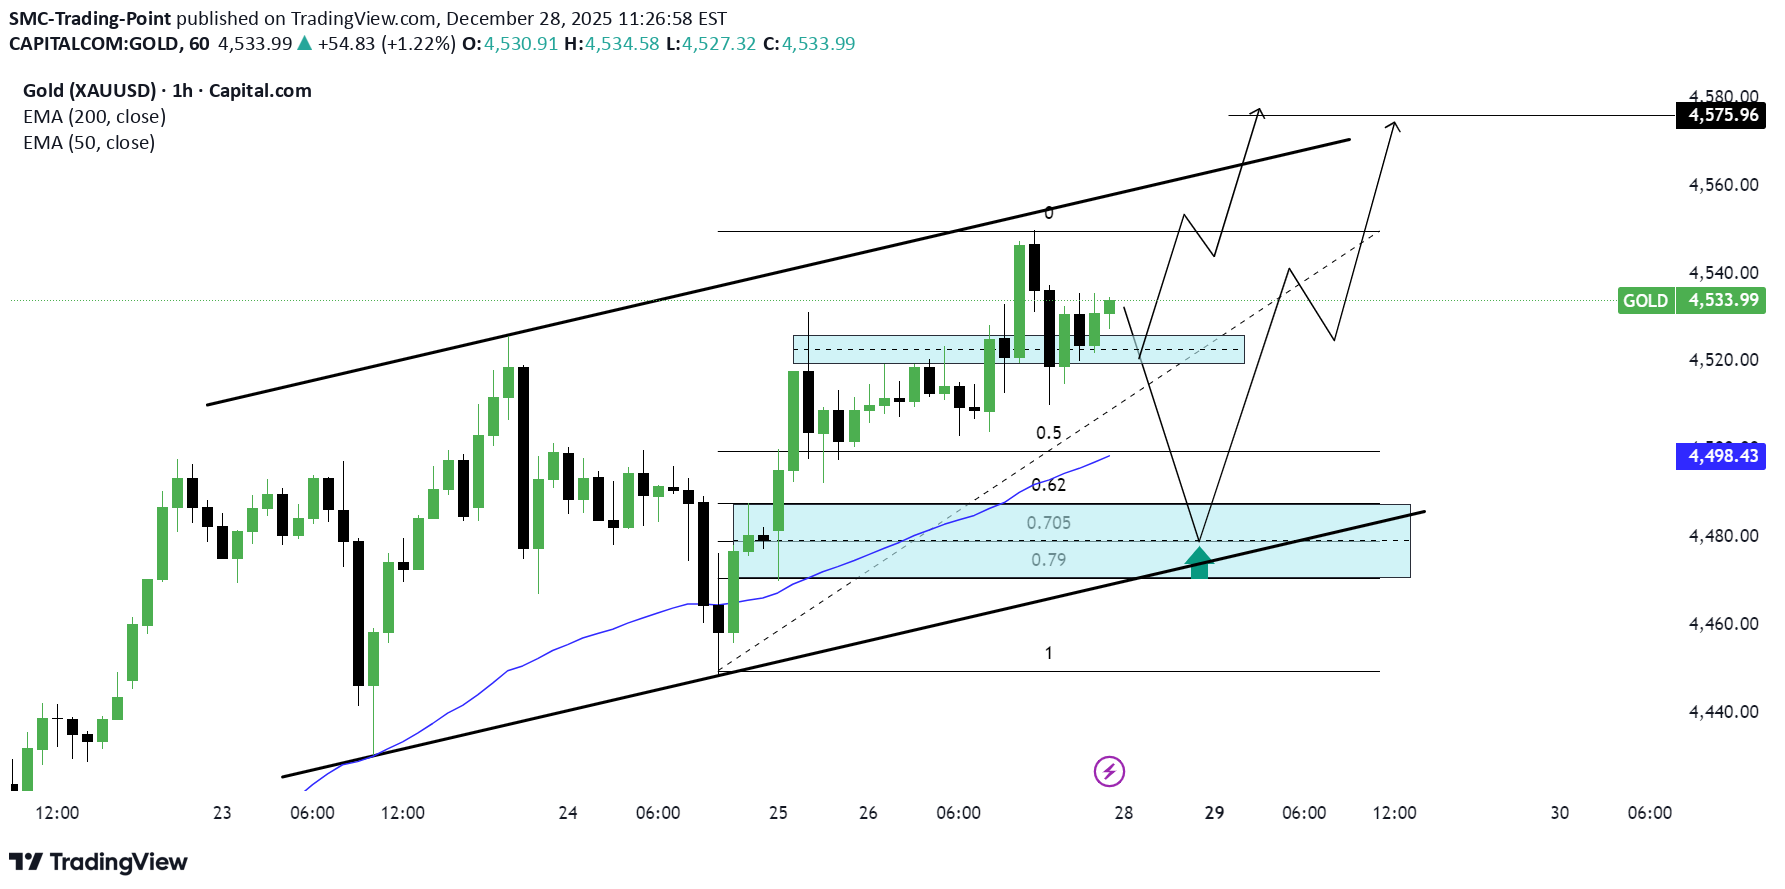
SMC Trading point update Technical analysis of XAUUSD (Gold) – 1H chart using SMC + Fibonacci OTE + trend-channel continuation. ⸻ Market Context • Bias: Bullish continuation • Price is respecting a well-defined ascending channel • Market structure remains higher highs & higher lows • EMAs: • EMA 50 above EMA 200 • EMA 50 acting as dynamic support • Recent consolidation near highs = absorption, not reversal ⸻ What Price Is Doing • After the impulsive rally, price paused at internal resistance • This pause is forming a controlled pullback • The projected path shows a dip into discount → continuation higher This is classic trend continuation behavior. ⸻ Key Buy Zone (Lower Blue Area) ~4,475 – 4,495 Strong confluence here: • SMC demand / order block • Fib OTE zone (0.705 – 0.79) • EMA 50 support (~4,498) • Rising channel support • Clear reaction point (green arrow) This is the high-probability long zone, not the current price. ⸻ Fibonacci Logic Measured from the impulse low → recent high: • 0.5 / 0.62 = shallow retracement • 0.705 – 0.79 = optimal trade entry (OTE) Institutions typically rebalance longs here in an uptrend ⸻ Trade Idea (Continuation Long) Buy on confirmation inside demand • Entry: 4,475 – 4,495 • Stop Loss: Below demand & channel (~4,455) • Targets: • TP1: 4,535 (recent high) • TP2: 4,560 • Final TP: 4,575 – 4,580 (marked target / upper channel liquidity) Risk–Reward: ~1:3 or better ⸻ Confirmation Triggers (Important) Only execute if you see: • Bullish engulfing or strong rejection wick from the zone • Lower-timeframe CHoCH • Failure to accept below the OTE zone • Momentum expansion after tapping demand ⸻ Invalidation • 1H close below ~4,455 • Acceptance below channel support + EMA 50 If this occurs → bullish continuation idea is invalid, and price may rotate deeper. ⸻Mr smc Trading point Summary This setup is a textbook bullish pullback: • Trend intact • OTE + demand + EMA confluence • Clear upside liquidity target Key edge: wait for price to come discount and confirm buyers, don’t chase highs. Please support boost this analysis
SMC-Trading-Point
BTC/ISD)Bullish trend analysis Read The caption
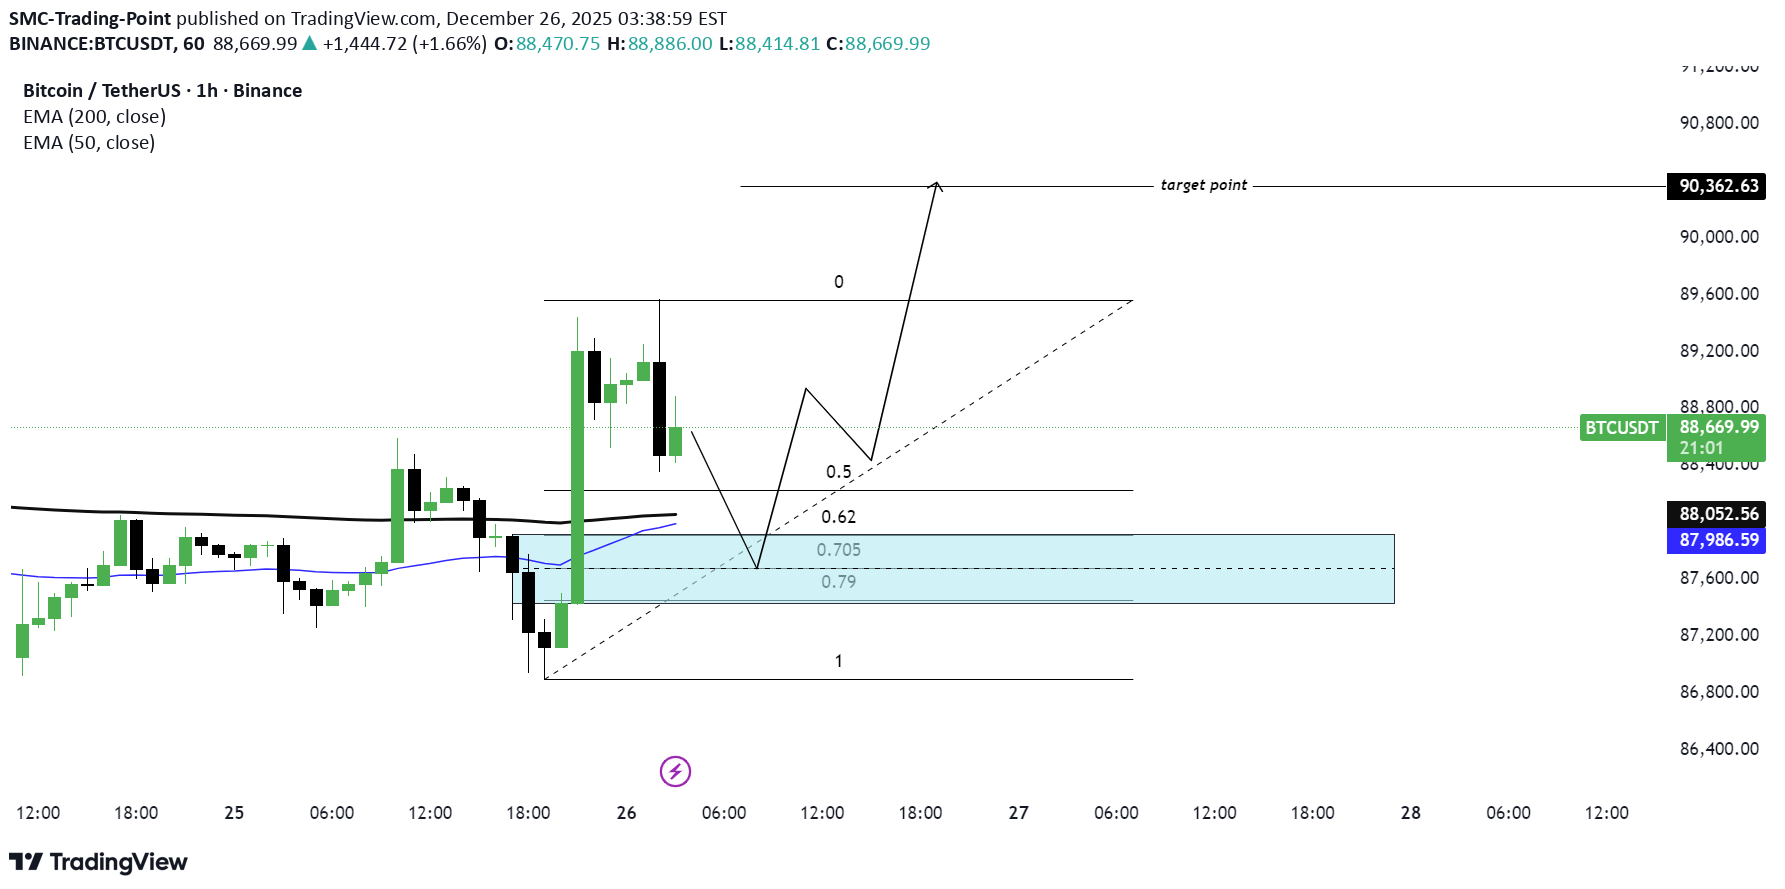
SMC Trading point update Technical analysis of BTCUSDT – 1H chart using SMC + Fibonacci OTE + EMA confluence. ⸻ Market Context • Bias: Bullish continuation • Clear impulsive bullish displacement broke previous structure • Price is holding above EMA 50 & EMA 200 • Current move down is a controlled pullback, not a reversal ⸻ What the Market Is Doing • After the impulse, price retraced to rebalance inefficiency • Pullback is occurring into discount within an uptrend • Structure remains intact → buyers still in control ⸻ Key Buy Zone (Blue Area) ~87,600 – 88,050 This zone is high-probability because of: • Fib OTE zone (0.705 – 0.79) • SMC demand / order block • EMA 50 support (~87,983) • Prior consolidation before impulse • Long lower wicks → sell-side liquidity taken This is where smart money typically reloads longs. ⸻ Fibonacci Logic Measured from the impulse low → high: • 0.5 / 0.62 = shallow retracement • 0.705 – 0.79 = optimal trade entr Ideal location for trend continuation setups ⸻ Trade Idea (Continuation Long) Buy on confirmation inside demand • Entry: 87,650 – 88,050 • Stop Loss: Below demand (~87,100) • Targets: • TP1: 88,900 (recent high) • TP2: 89,600 • Final TP: 90,360 (marked target point / liquidity above highs) Risk–Reward: ~1:3 to 1:4 ⸻ Confirmation Triggers (Important) Only enter if you see: • Bullish engulfing or strong rejection wick • Lower-timeframe CHoCH • Failure to accept below the OTE zone • Momentum expansion after tapping demand ⸻ Invalidation • 1H close below ~87,100 • Acceptance below EMA 50 + demand If this happens → bullish idea is invalid, and price may seek deeper liquidity. ⸻ Mr SMC Trading point Summary This is a textbook bullish continuation setup: • Strong impulse • OTE + demand + EMA confluence • Clear upside liquidity target Please support boost this analysis
SMC-Trading-Point
تحلیل تکنیکال طلا (XAUUSD): نقطه ورود طلایی برای صعود قوی!
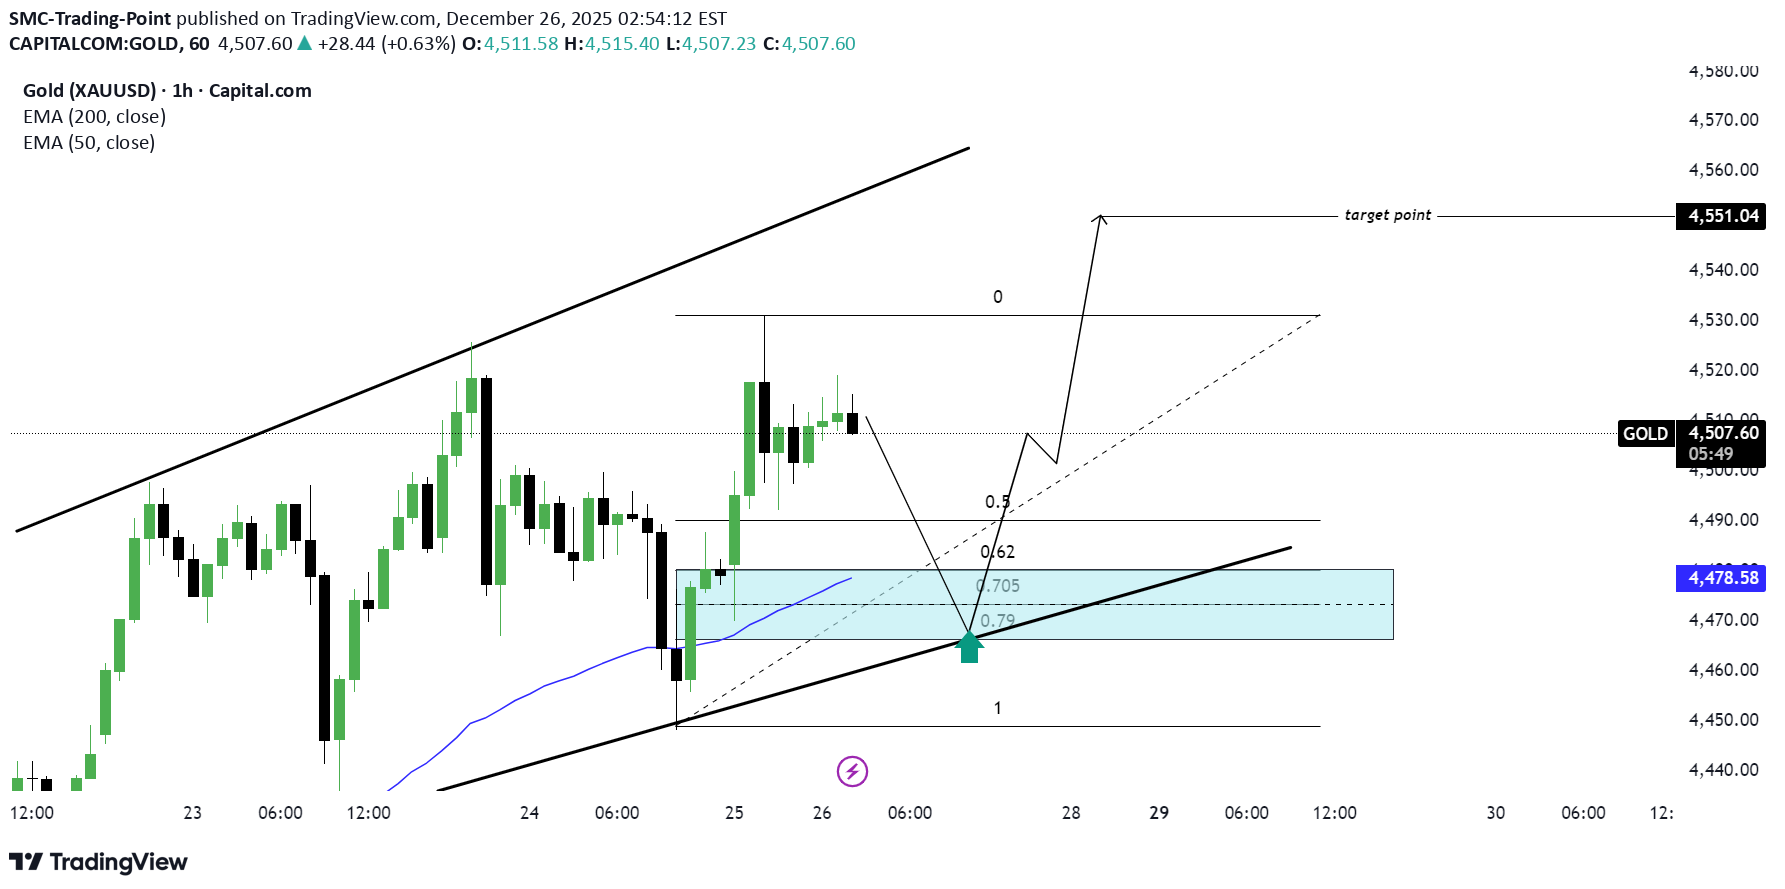
SMC Trading point update Technical analysis of XAUUSD (Gold) – 1H chart using trend structure + SMC + Fibonacci OTE. ⸻ Market Context • Overall bias: Bullish • Price is respecting a rising channel • Market structure still shows higher highs & higher lows • Recent drop is a healthy pullback, not a trend reversal ⸻ Why Price Is Pulling Back • Price reacted near short-term resistance (0 level) • Profit-taking + liquidity sweep caused a retracement • Pullback is heading into a discount zone within an uptrend ⸻ Key Buy Zone (Blue Area) ~4,465 – 4,480 This zone has strong confluence: • SMC demand / order block • Fib OTE zone (0.705 – 0.79) • EMA 50 support • Rising trendline support • Clear reaction level (green arrow) This is where buyers are expected to defend the trend. ⸻ Fibonacci Logic Measured from the recent impulse low → high: • 0.5 / 0.62 → shallow retracement • 0.705 – 0.79 → institutional rebalance zone Textbook area for trend continuation entries ⸻ Trade Idea (Continuation Long) Buy on confirmation inside demand • Entry: 4,465 – 4,480 • Stop Loss: Below demand & trendline (~4,450) • Targets: • TP1: 4,500 (internal structure high) • TP2: 4,525 • Final TP: 4,551 (marked target point / liquidity above highs) Risk–Reward: ~1:3 or better ⸻ Confirmation Triggers (Important) Only enter if you see: • Bullish engulfing or strong rejection wick • Lower-TF CHoCH • Failure to close below the demand zone • Momentum expansion after tapping the zone ⸻ Invalidation • 1H close below ~4,450 • Acceptance below trendline + EMA 50 If this happens → bullish idea is invalid, and price may seek the lower support. ⸻ Mr SMC Trading point Summary This setup is a high-probability bullish pullback: • Trend intact • Fib OTE + demand • Clear upside liquidity target Please support boost this analysis
SMC-Trading-Point
BTC/ISD)bullish trend analysis Read The caption
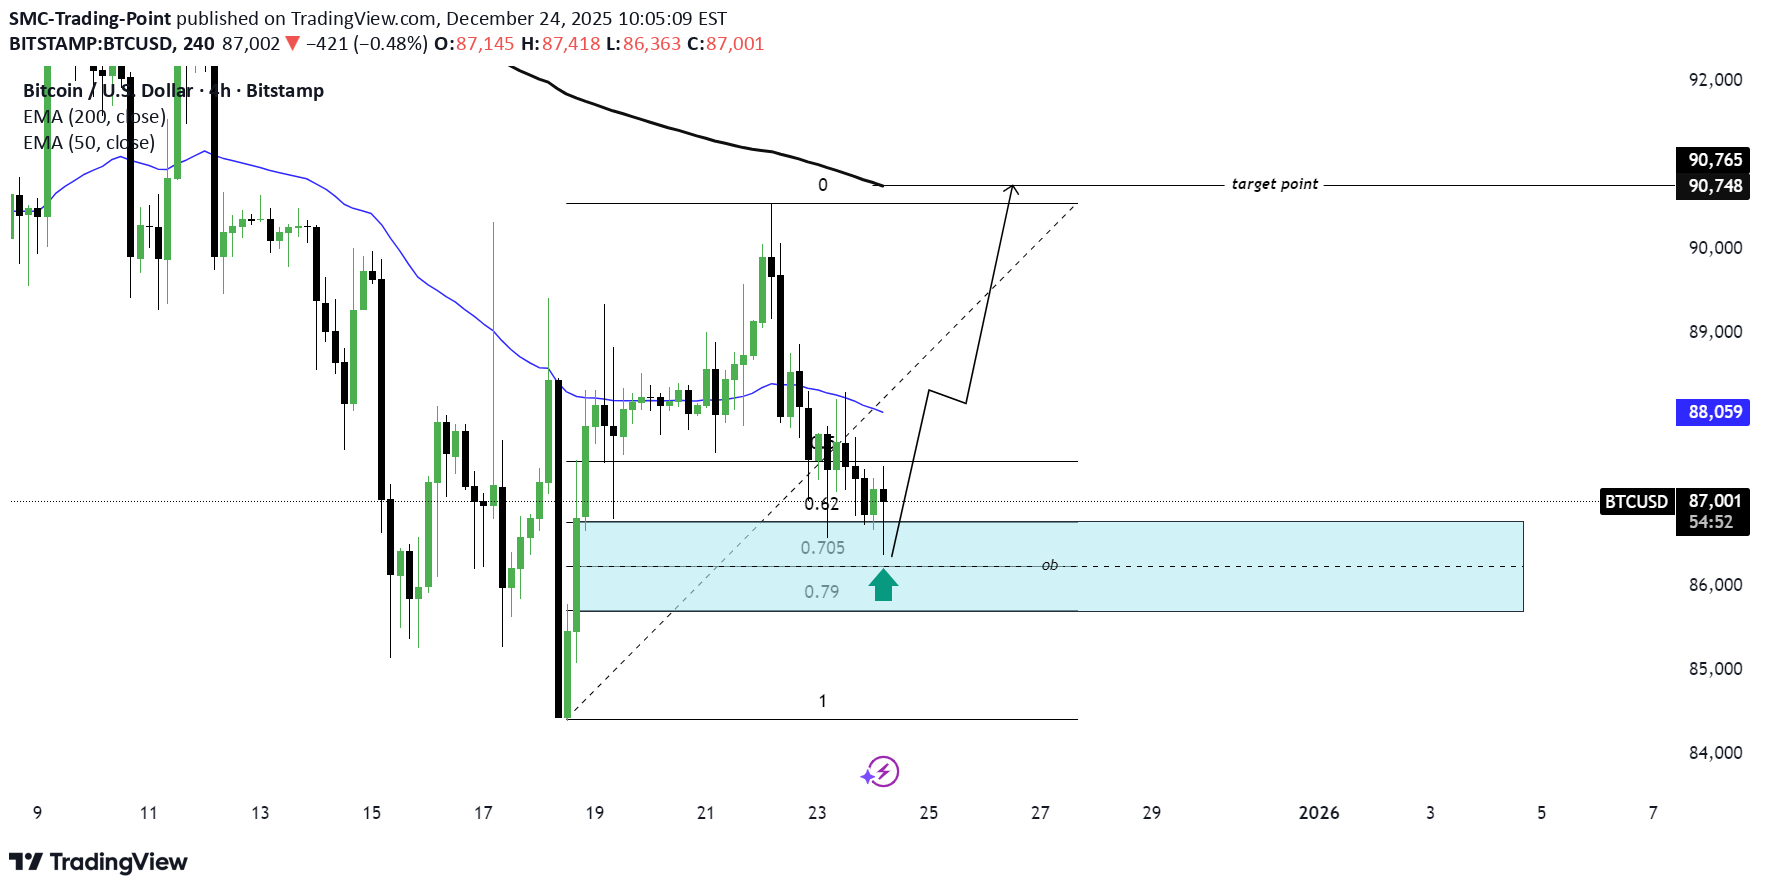
SMC Trading point update Technical analysis of BTCUSD – intraday (likely 1H–4H) chart using SMC + Fibonacci OTE + mean-reversion logic. ⸻ Market Context • Bias: Bullish continuation (corrective pullback) • Price sold off impulsively, then started to slow down into discount • The move down shows decreasing momentum, suggesting sell-side liquidity absorption, not continuation lower ⸻ Why Price Pulled Back • Liquidity was taken above the recent swing high • Price retraced into a deep discount area • This is a classic rebalancing move after an impulsive leg ⸻ Key Demand / Order Block Zone (Blue Area) ~85,800 – 86,700 Strong confluence: • Fib OTE zone (0.705 – 0.79) • Clearly marked order block (ob) • Prior reaction lows • Psychological support around 86k • Green arrow → first buyer response already visible This is the highest-probability long area on the chart. ⸻ Fibonacci Logic Measured from impulse low → swing high: • 0.62 → shallow reaction • 0.705 – 0.79 → institutional rebalance zone Textbook location for trend continuation entries ⸻ Trade Idea (Example Plan) Buy on confirmation inside demand • Entry: 86,000 – 86,700 • Stop Loss: Below demand (~85,200) • Targets: • TP1: 88,050 (EMA / mid-range) • TP2: 89,800 – 90,000 • Final TP: 90,700+ (marked target point / liquidity above highs) RR potential: ~1:3 to 1:5 ⸻ Best Confirmation Signals Before entering, look for: • Bullish engulfing or strong rejection wick from the zone • Lower-TF CHoCH • Compression → expansion behavior • Failure of price to accept below the order block ⸻ Invalidation • Strong close below ~85,200 • Acceptance below the OB with momentum If that happens → bullish idea is invalid, and price likely seeks deeper HTF liquidity. ⸻ Mr SMC Trading point Summary This setup is a classic BTC continuation play • Deep discount • OTE + order block • Liquidity above acting as magnet Please support boost this analysis
SMC-Trading-Point
XAU/USD)Bullish trend analysis Read The caption
SMC Trading point update Technical analysis of XAUUSD (Gold) – 1H chart using SMC + Fibonacci + trend continuation. ⸻ Market Context • Overall bias: Bullish • Price is respecting an ascending trend structure • Higher highs & higher lows remain intact • Recent move down is a controlled pullback, not a reversal • EMA structure: • EMA 50 above EMA 200 • EMA 50 acting as dynamic support ⸻ Pullback Logic After the impulsive rally: • Price retraced into: • Trendline support • EMA 50 • Fib discount zone • This signals healthy consolidation before continuation ⸻ Key Demand Zone (Blue Area) ~4,455 – 4,465 Confluence: • SMC demand / order block • Fib 0.62 – 0.79 retracement • EMA 50 • Rising trendline support • Marked reaction (green arrow) → buyers stepping in This is the high-probability buy zone. ⸻ Fibonacci Insight Measured from the latest impulse low → high: • 0.5 → shallow reaction • 0.62 – 0.79 → optimal institutional rebalance zone (OTE) Price reacting here supports trend continuation ⸻ Trade Idea (Example Plan) Buy confirmation inside demand • Entry: 4,455 – 4,465 • Stop Loss: Below demand & trendline (~4,440) • Targets: • TP1: 4,500 (range high) • TP2 / Final: 4,540 (marked target point) Risk–Reward: ~1:3 or better ⸻ Confirmation Triggers (Important) Enter only if you see: • Bullish engulfing / strong rejection wick • Lower-timeframe CHoCH • Momentum expansion from the zone ⸻ Invalidation • 1H close below ~4,440 • Clean break and acceptance below EMA 50 + trendline If this happens → bullish idea is invalid, and price may seek the lower FVG/demand. ⸻ Mr SMC Trading point Summary This setup is a textbook bullish pullback: • Trend intact • EMA + Fib + demand confluence • Clear upside liquidity target Please support boost this analysis
SMC-Trading-Point
BTC/ISD)Bullish trend analysis Read The caption
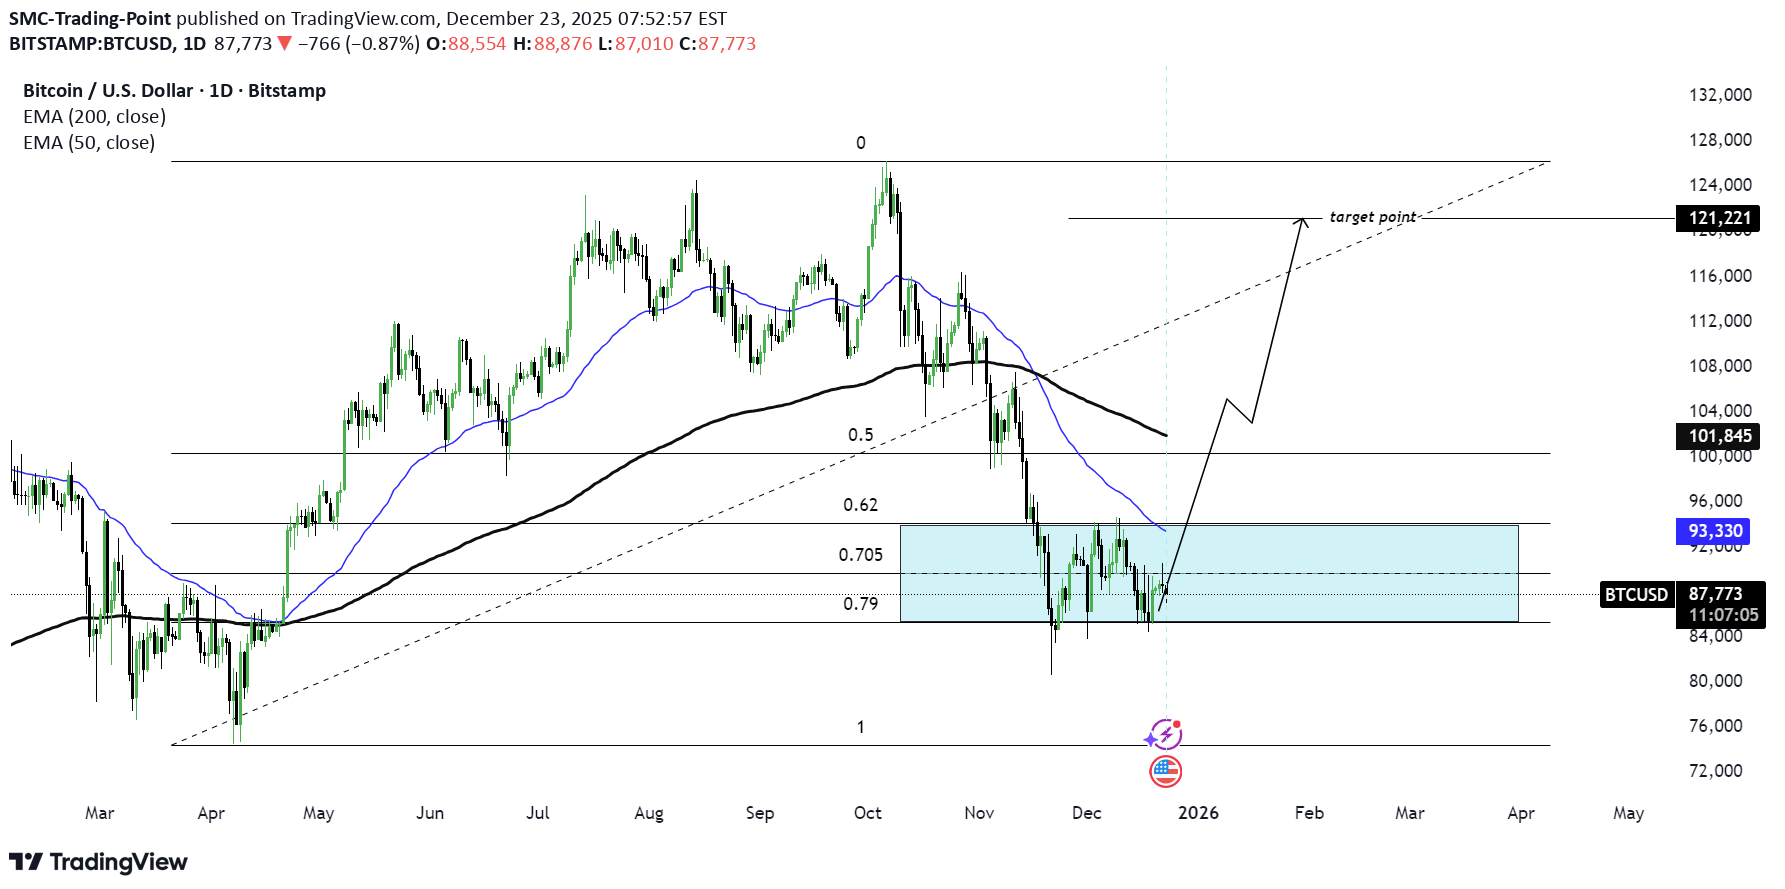
SMC Trading point update Technical analysis of BTCUSD – Daily (1D) chart using SMC + Fibonacci + EMA mean-reversion logic. ⸻ Market Context • Higher-timeframe bias: Bullish (macro) • Long-term structure still intact despite the pullback • Current move down = deep corrective phase, not confirmed trend reversal yet • Price is trading below EMA 50, but reacting near EMA 200 + HTF support ⸻ What Happened (Why BTC Dropped) • Liquidity taken at the October high • Sharp impulsive sell-off → distribution + stop-hunt • Price retraced into a high-confluence discount zone ⸻ Key Demand / Accumulation Zone (Blue Area) ~85,000 – 92,000 This zone is important because it aligns with: • Fib OTE zone (0.705 – 0.79) • Previous daily demand • Range low support • Proximity to EMA 50 (93K) → mean reversion magnet • Multiple long lower wicks → absorption This suggests smart money accumulation, not panic selling. ⸻ Fibonacci Logic Measured from major swing low → all-time high • 0.5 & 0.62 → failed supports • 0.705 – 0.79 → institutional rebalance zone Textbook location for trend continuation buys ⸻ Trade Idea (Swing Long) Buy on confirmation inside demand • Entry: 86,000 – 90,000 • Stop Loss: Below demand (~82,000) • Targets: • TP1: 93,000 (EMA 50) • TP2: 101,800 (EMA 200 / mid-range) • Final TP: 121,000+ (marked target point / liquidity above highs) RR potential: 1:4 to 1:6 (swing setup) ⸻ Confirmation Signals (Very Important on BTC) Wait for at least one: • Daily or 4H bullish engulfing • Strong rejection wick from demand • 4H CHoCH after sweep of lows • Compression → expansion behavior ⸻ Invalidation • Daily close below ~82,000 • Acceptance below demand with strong volume If that happens → bullish swing idea is invalid, and market likely seeks lower HTF liquidity. ⸻ Mr SMC Trading point Summary This is a high-timeframe accumulation & continuation setup: • Deep discount • Fib OTE + demand • EMA mean reversion BTC rewards patience and HTF discipline — confirmation > prediction. If you want, I can: • Break this into a 4H / 1H execution plan • Help you build a BTC-specific SMC swing model • Or map bearish alternative scenarios for risk control Please support boost this analysis
SMC-Trading-Point
XAU/USD ) Beriash trend analysis Read the caption
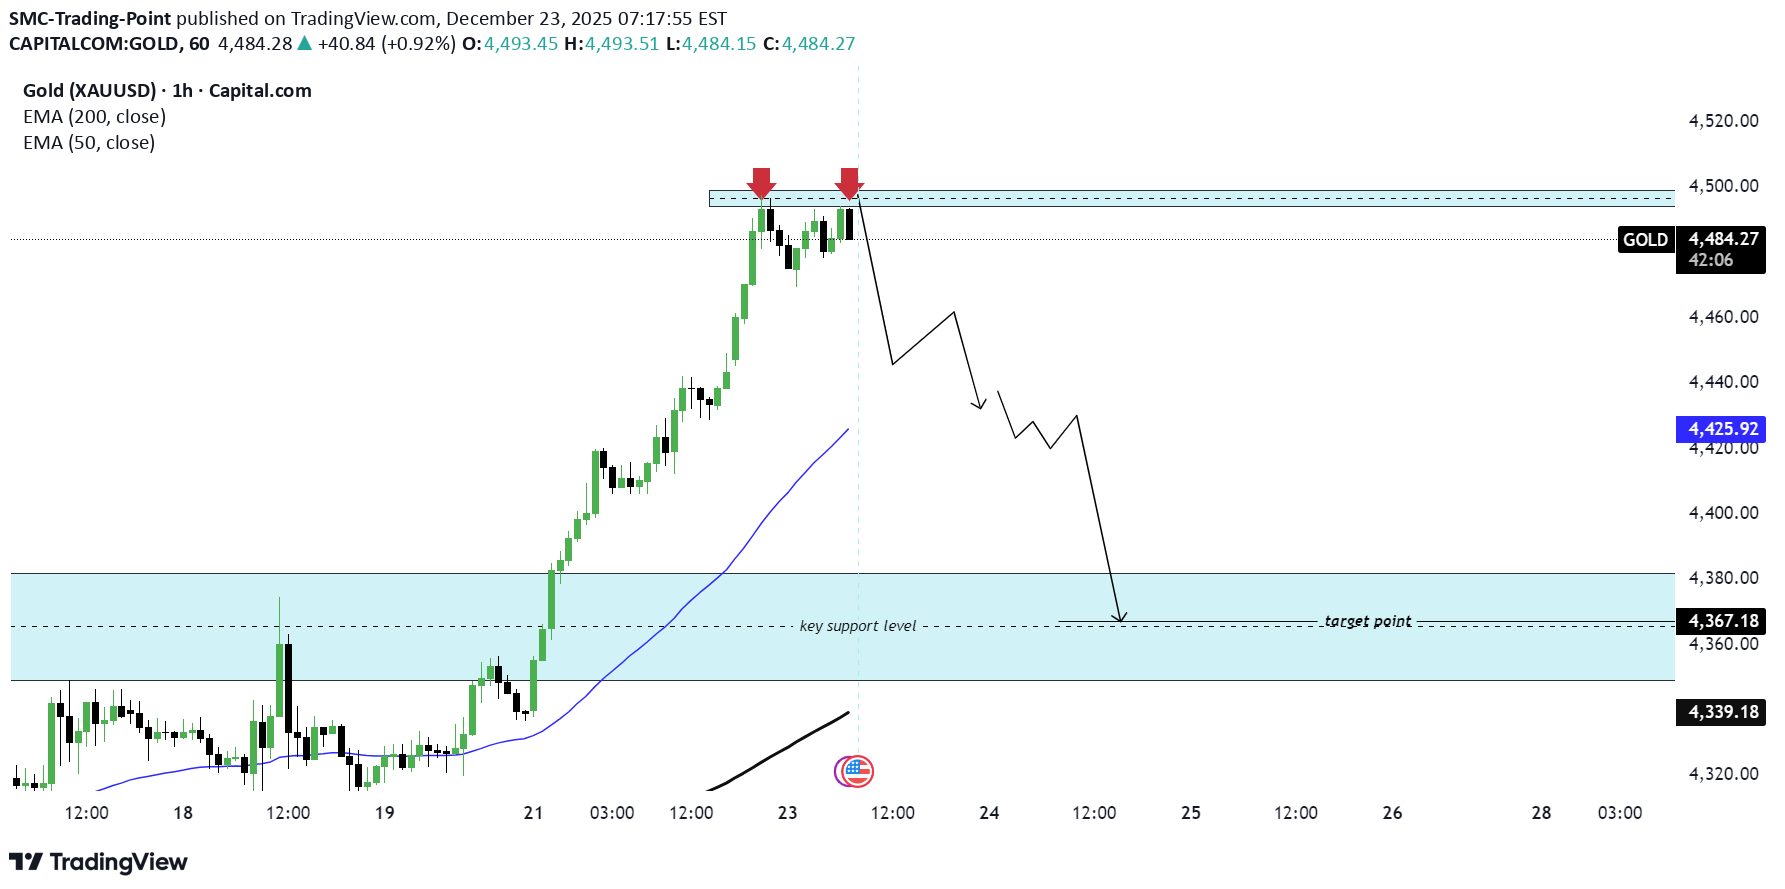
SMC Trading point Update Technical analysis of XAUUSD (Gold) – 1H chart using SMC + trend exhaustion logic. ⸻ Market Context • Strong impulsive bullish move into highs → signs of buy-side liquidity taken • Price is now stalling at resistance • Momentum is weakening after expansion → distribution phase ⸻ Key Area (Supply / Liquidity Zone) • Upper blue zone (~4490–4500) • Multiple rejections (red arrows) • Equal highs / liquidity pool • Classic SMC supply zone • Indicates smart money selling into late buyers ⸻ EMA Structure • EMA 50 far extended from price • Typical behavior after strong rallies: • Price returns to mean value • EMA acts as a magnet → correction likely ⸻ Bias Bearish retracement / reversal scenario This is not a trend change yet, but a high-probability corrective sell after liquidity grab. ⸻ Trade Idea (Example Plan) Sell from Supply • Entry: 4488 – 4500 (sell on rejection / confirmation) • Stop Loss: Above supply zone (~4510–4520) • Targets: • TP1: 4426 (EMA 50) • TP2: 4380–4365 (key support / demand zone) • Final target: ~4367 (marked target point) RR potential: 1:3 to 1:5 depending on entry ⸻ Best Confirmation Signals Wait for one of these at supply: • Bearish engulfing candle (1H or 15m) • Long upper wicks (failed breakout) • Lower-timeframe CHoCH / BOS • Decreasing bullish volume ⸻ Invalidation • Clean 1H close above 4500 • Acceptance above supply zone • Strong continuation with no rejection If that happens → bearish idea is invalid. ⸻ Mr SMC Trading Point Summary This setup is: • Liquidity grab at highs • Supply + overextension • Mean reversion toward EMA & demand Patience matters — wait for confirmation, don’t chase. If you want, I can: • Break this down into a 15m or 5m execution model • Or help you define partial profit & trailing logic Please support boost this analysis
SMC-Trading-Point
BTC/ISD) Beraish trend analysis Read The caption
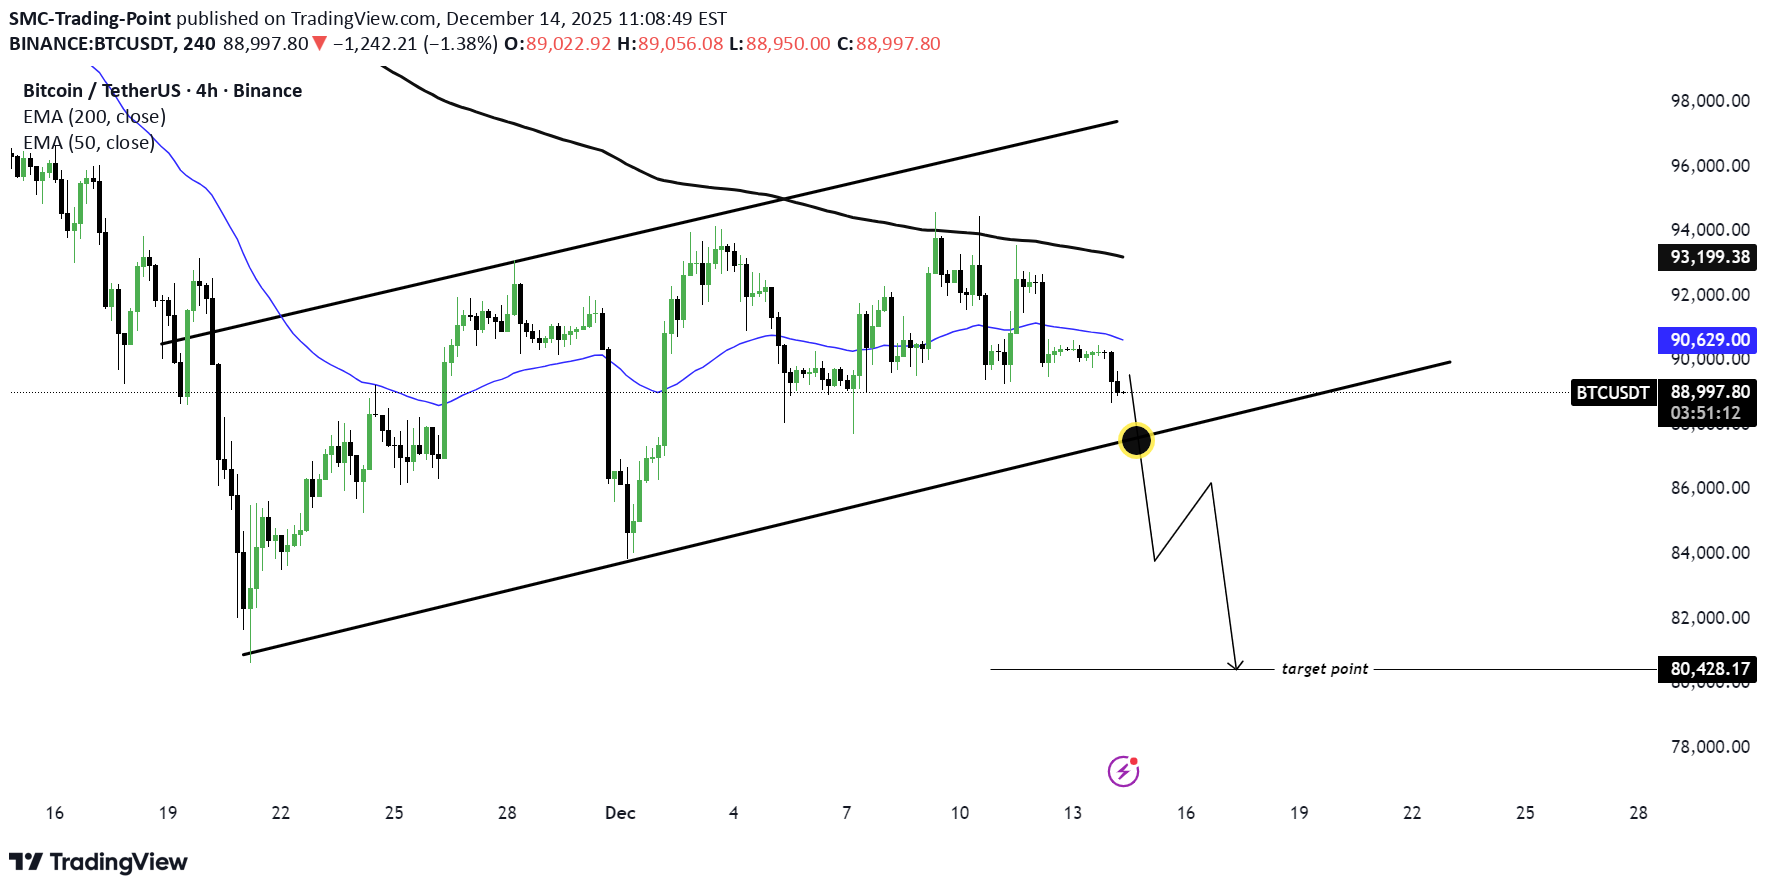
SMC Trading point update Technical of analysis depicts a bearish descending channel* on the BTC/USDT 4-hour chart with the following key elements: 1. Channel structure Price is moving within a clear descending channel (black parallel lines), indicating a sustained downtrend. 2. Breakout point: The black dot marks a recent break below the lower channel line, signaling potential continuation of the bearish momentum. Mr SMC Trading point 3. Target: The projected downside target is ≈80,428.17 USDT, shown by the horizontal “target point” line. 4. EMA (200): The blue exponential moving average (200-period) is acting as dynamic resistance, reinforcing the bearish bias. 5. Price action: The latest candle closes at 89,037.66 USDT down -0.36% for the session, with reduced volume (-1.33% Vol). The overall idea is that after the breakdown from the channel, the analyst expects BTC/USDT to head toward the 80.4k support zone. Please support boost this analysis
SMC-Trading-Point
XAU/USD) bullish trend analysis Read The caption
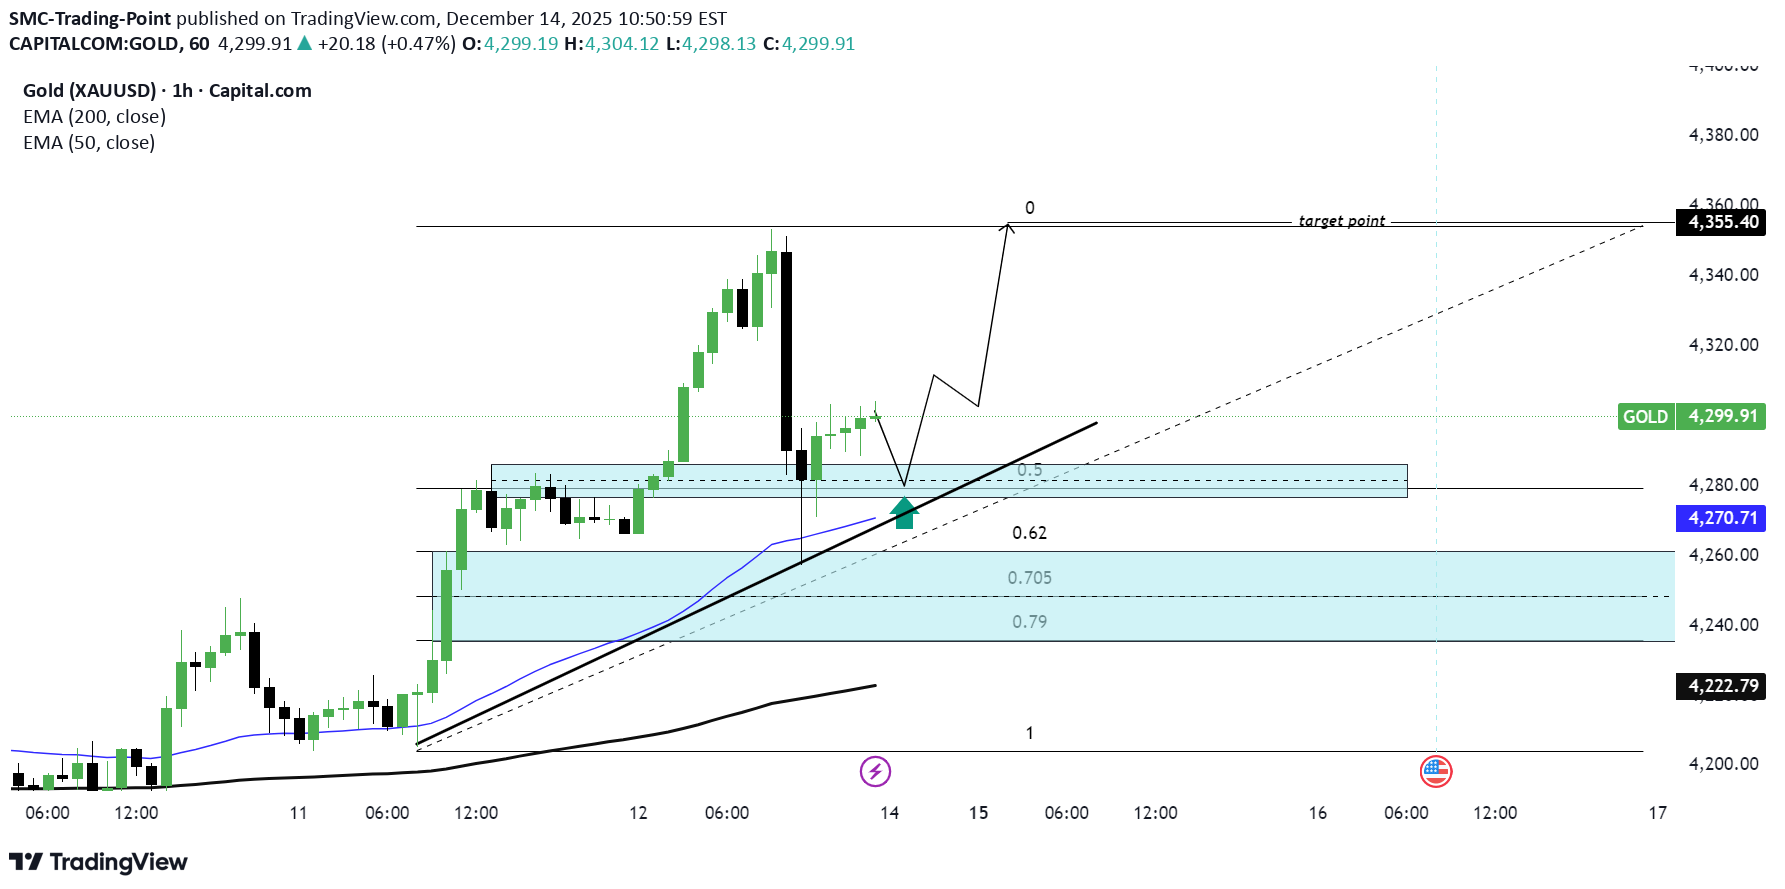
SMC Trading Point Technical analysis of Gold (XAUUSD) 1-hour chart shows a bullish "SMC" (Smart Money Concept) analysis with these key points: 1. Structure: Price breaks out of an ascending channel and forms a consolidation zone (blue shaded area). The breakout suggests potential continuation upward. 2. EMAs - EMA(200) is at 4,222.79. - EMA(50) is at 4,270.71. - Price (4,299.91) is above both EMAs, indicating bullish momentum. 3. Fibonacci levels: - 0.62, 0.705, and 0.79 retracement zones are marked for potential support. 4. Entry: Long position considered after breakout above the consolidation, with price aiming for the "target point" around 4,355.40. Mr SMC Trading Point 5. Target: Upside target set at ~4,355.40, offering roughly a 1.3% move from current price. 6. Stop Loss: Place below the support zone (near 4,270 or EMA 50) to manage risk. 7. Confirmation: Look for strong bullish candles or volume spike post-breakout to validate the move. Please support boost this analysis
Disclaimer
Any content and materials included in Sahmeto's website and official communication channels are a compilation of personal opinions and analyses and are not binding. They do not constitute any recommendation for buying, selling, entering or exiting the stock market and cryptocurrency market. Also, all news and analyses included in the website and channels are merely republished information from official and unofficial domestic and foreign sources, and it is obvious that users of the said content are responsible for following up and ensuring the authenticity and accuracy of the materials. Therefore, while disclaiming responsibility, it is declared that the responsibility for any decision-making, action, and potential profit and loss in the capital market and cryptocurrency market lies with the trader.