Technical analysis by SMC-Trading-Point about Symbol BTC: Buy recommendation (12/26/2025)

SMC-Trading-Point
BTC/ISD)Bullish trend analysis Read The caption
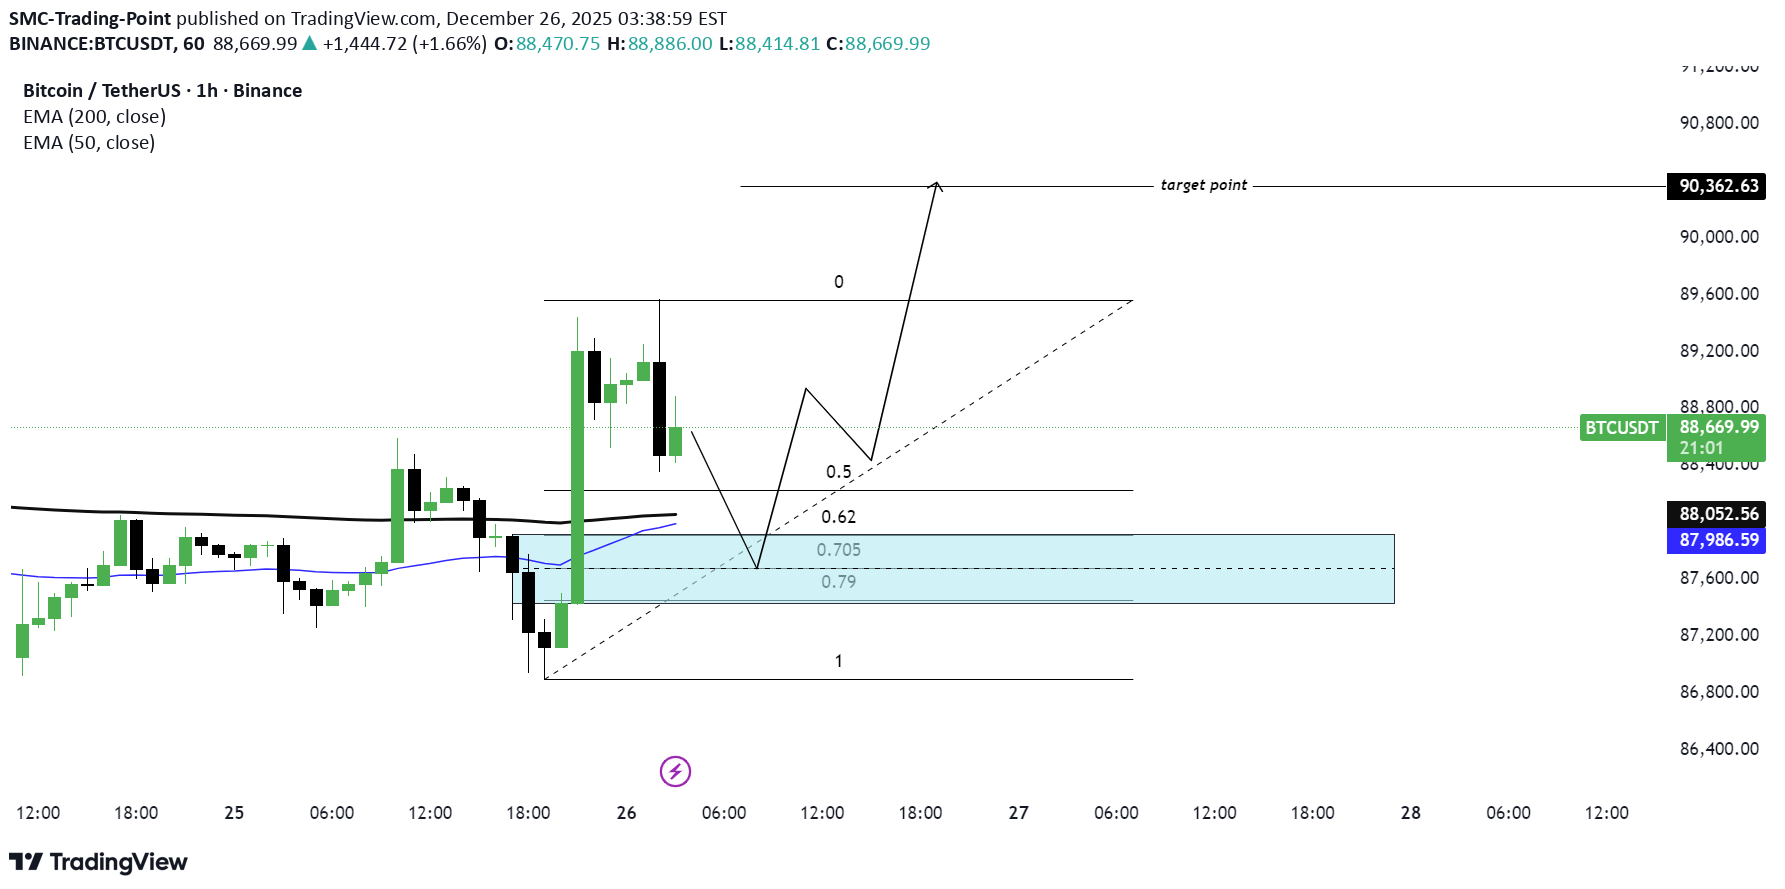
SMC Trading point update Technical analysis of BTCUSDT – 1H chart using SMC + Fibonacci OTE + EMA confluence. ⸻ Market Context • Bias: Bullish continuation • Clear impulsive bullish displacement broke previous structure • Price is holding above EMA 50 & EMA 200 • Current move down is a controlled pullback, not a reversal ⸻ What the Market Is Doing • After the impulse, price retraced to rebalance inefficiency • Pullback is occurring into discount within an uptrend • Structure remains intact → buyers still in control ⸻ Key Buy Zone (Blue Area) ~87,600 – 88,050 This zone is high-probability because of: • Fib OTE zone (0.705 – 0.79) • SMC demand / order block • EMA 50 support (~87,983) • Prior consolidation before impulse • Long lower wicks → sell-side liquidity taken This is where smart money typically reloads longs. ⸻ Fibonacci Logic Measured from the impulse low → high: • 0.5 / 0.62 = shallow retracement • 0.705 – 0.79 = optimal trade entr Ideal location for trend continuation setups ⸻ Trade Idea (Continuation Long) Buy on confirmation inside demand • Entry: 87,650 – 88,050 • Stop Loss: Below demand (~87,100) • Targets: • TP1: 88,900 (recent high) • TP2: 89,600 • Final TP: 90,360 (marked target point / liquidity above highs) Risk–Reward: ~1:3 to 1:4 ⸻ Confirmation Triggers (Important) Only enter if you see: • Bullish engulfing or strong rejection wick • Lower-timeframe CHoCH • Failure to accept below the OTE zone • Momentum expansion after tapping demand ⸻ Invalidation • 1H close below ~87,100 • Acceptance below EMA 50 + demand If this happens → bullish idea is invalid, and price may seek deeper liquidity. ⸻ Mr SMC Trading point Summary This is a textbook bullish continuation setup: • Strong impulse • OTE + demand + EMA confluence • Clear upside liquidity target Please support boost this analysis