
Matthew_TradeRFX
@t_Matthew_TradeRFX

What symbols does the trader recommend buying?
Purchase History
پیام های تریدر
Filter
“ETH Is Repeating the Same Trap — Range First, Direction Later
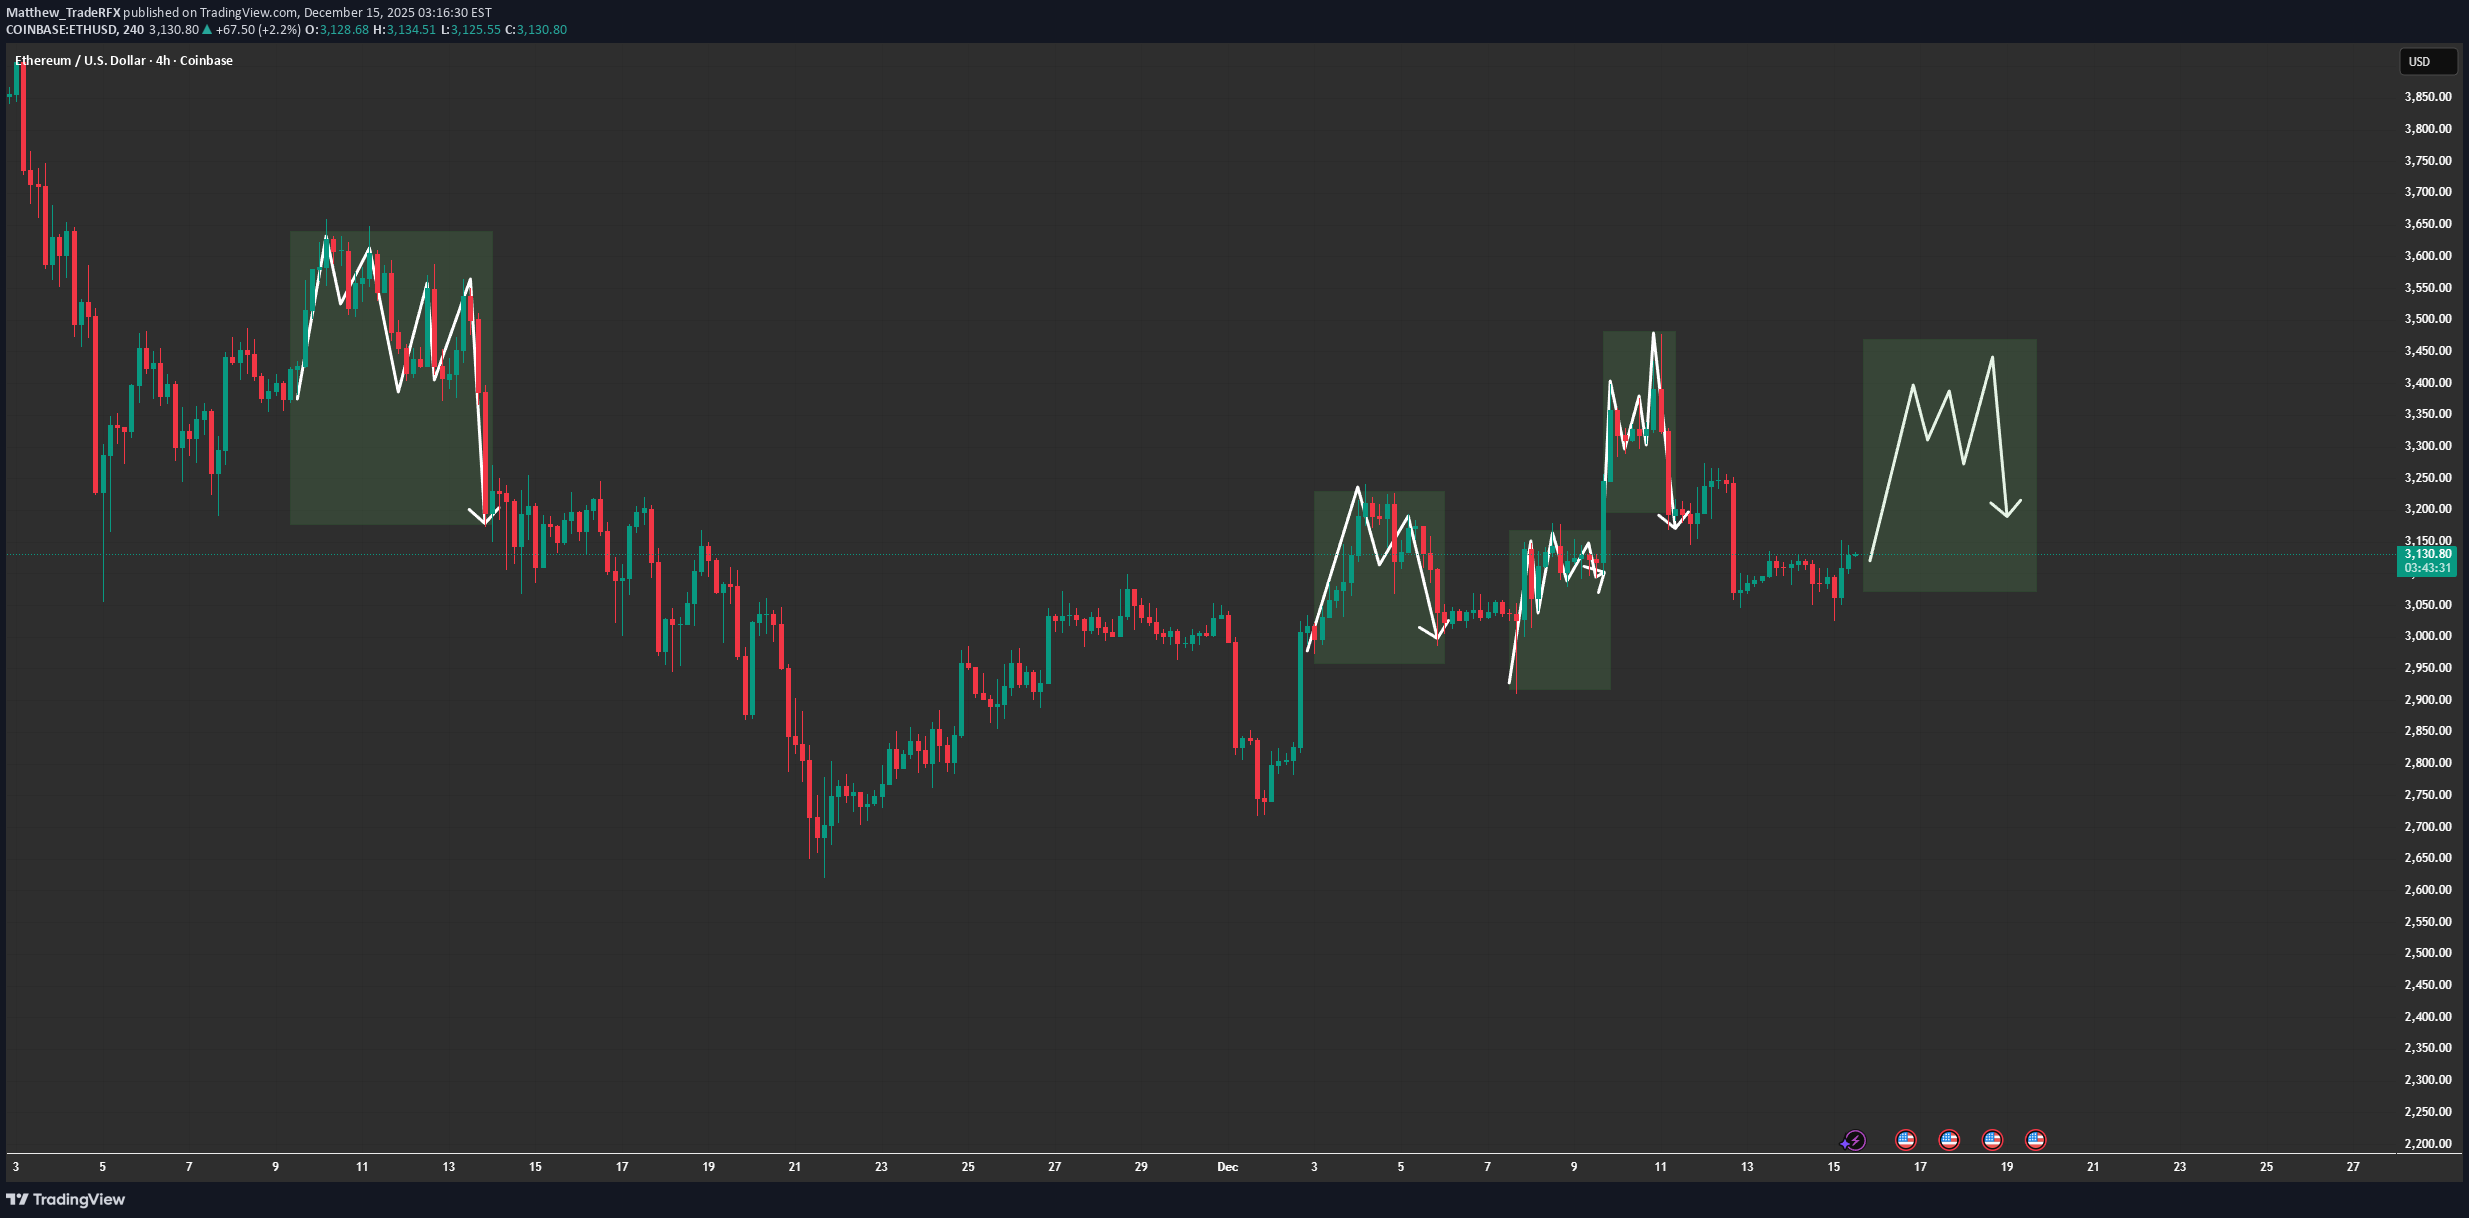
MARKET BRIEFING – ETH/USD (4H) Market State: – Ethereum remains in a range-bound structure, repeatedly forming distribution-like consolidations after short impulsive moves. – Each highlighted box shows the same behavior: push up → choppy consolidation → downside rotation. Current price action is aligning with that same rhythm. Key Levels: – Range Mid / Balance: ~3,120 – 3,150 – Upper Supply Reaction Zone: ~3,300 – 3,450 – Lower Demand / Rotation Target: ~3,000 – 3,050 – Breakout Invalidation: Clean acceptance above ~3,450 Price Action Read: – The market is not trending it is cycling liquidity inside a broad range. – Failed follow-through after bullish pushes signals seller absorption at higher prices. – Current consolidation suggests another rotation phase, not immediate continuation. Next Move: – Sideways to slightly bearish rotation remains favored while below the upper supply zone. – A sweep toward the lower range (~3,000–3,050) is a high-probability magnet. – Only a strong break and acceptance above 3,450 would invalidate the range-play and shift bias bullish. ETH is not breaking out it’s repeating structure. Until price escapes the range with acceptance, rotation beats prediction.
Gold Is Pressing the Old ATH — The Final Break Looks Imminent
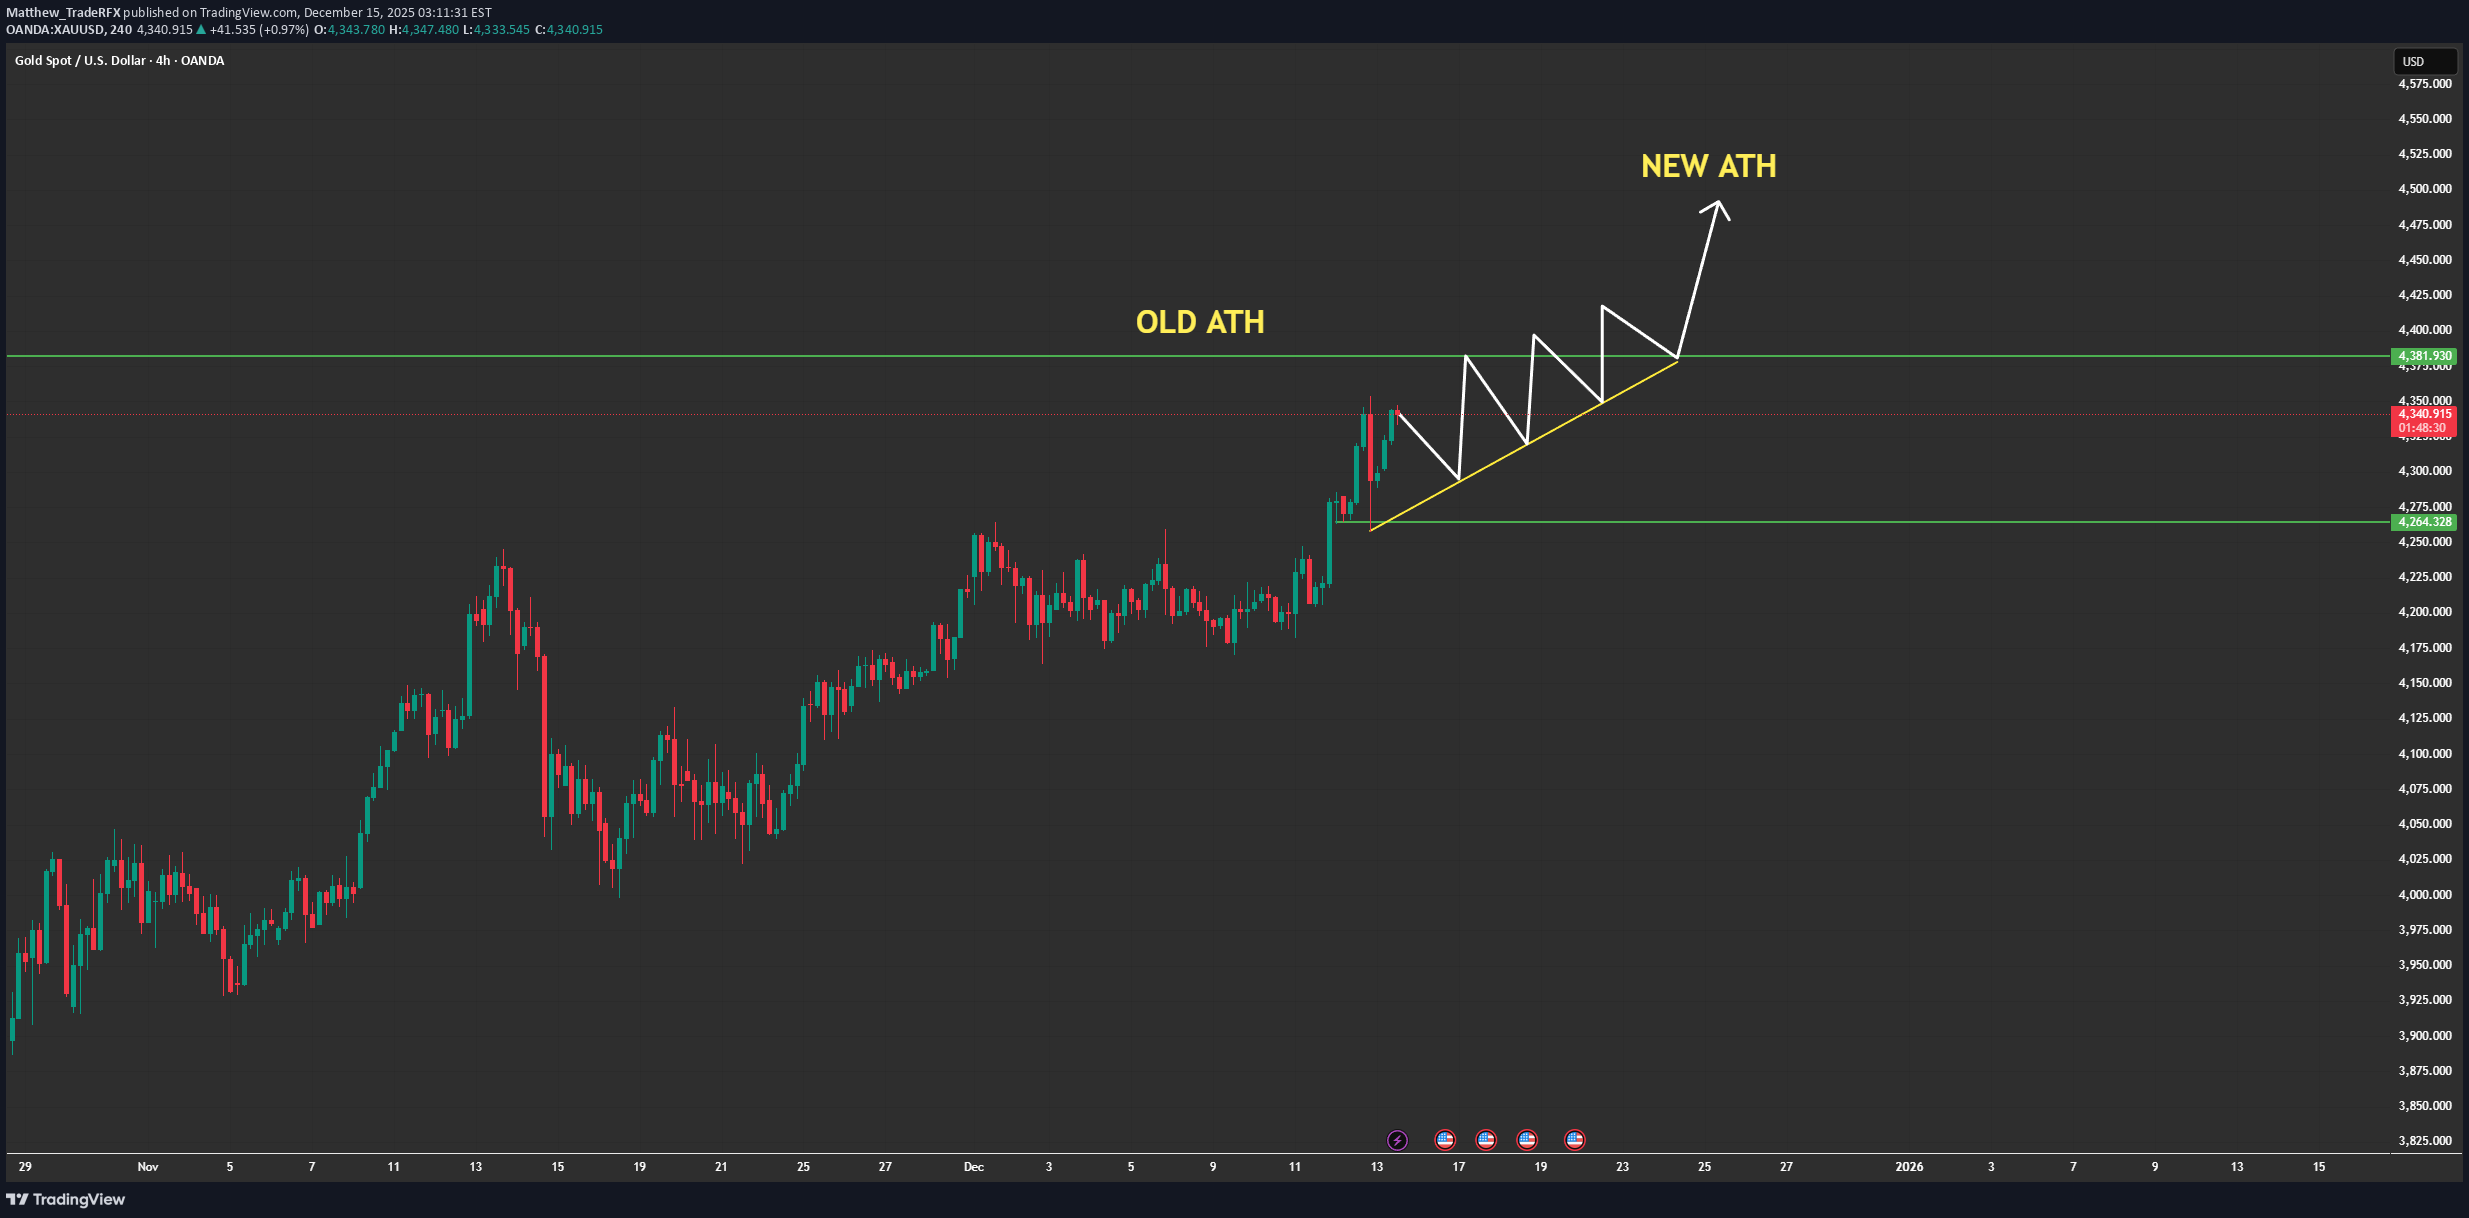
MARKET BRIEFING – XAU/USD (4H) Market State: – Gold is in a strong bullish continuation structure, forming higher lows along an ascending support while compressing directly beneath the old ATH at 4,380. – This is bullish stair-step price action, not exhaustion buyers are accepting higher prices on every pullback. Key Levels: – Old ATH / Decision Zone: 4,360 – 4,380 – Structure Support: ~4,260 – 4,270 – Trend Support (Ascending): intact – Upside Objective: 4,450 → 4,500 (New ATH) Price Action: – Repeated rejections below ATH are getting shallower, signaling supply absorption. – Each pullback is met with faster buying, confirming strong demand control. – Compression against resistance = breakout pressure, not distribution. MACRO CONFIRMATION – WHY THIS BREAK HAS BACKING 1. Fed Policy Caps the Downside – The Fed remains on hold, with markets pricing future easing rather than further tightening. – Real yields struggle to move higher → historically bullish for gold. 2. USD Lacks Follow-Through – The Dollar fails to trend despite elevated rates a late-cycle signal. – This reduces headwinds for gold near key resistance. 3. Persistent Safe-Haven & Central Bank Demand – Geopolitical risk and fiscal uncertainty remain unresolved. – Central banks continue to accumulate gold, reinforcing structural demand beneath price. 4. Liquidity Inflection Favors Hard Assets – As global liquidity stabilizes, gold tends to lead upside expansions before other assets react. Next Move: – Holding above 4,260 keeps the bullish structure intact. – Acceptance above 4,380 opens clean price discovery toward 4,450–4,500. – Any dip into ascending support is a continuation setup, not a reversal signal.
Bitcoin Is Trapped — But Not Weak
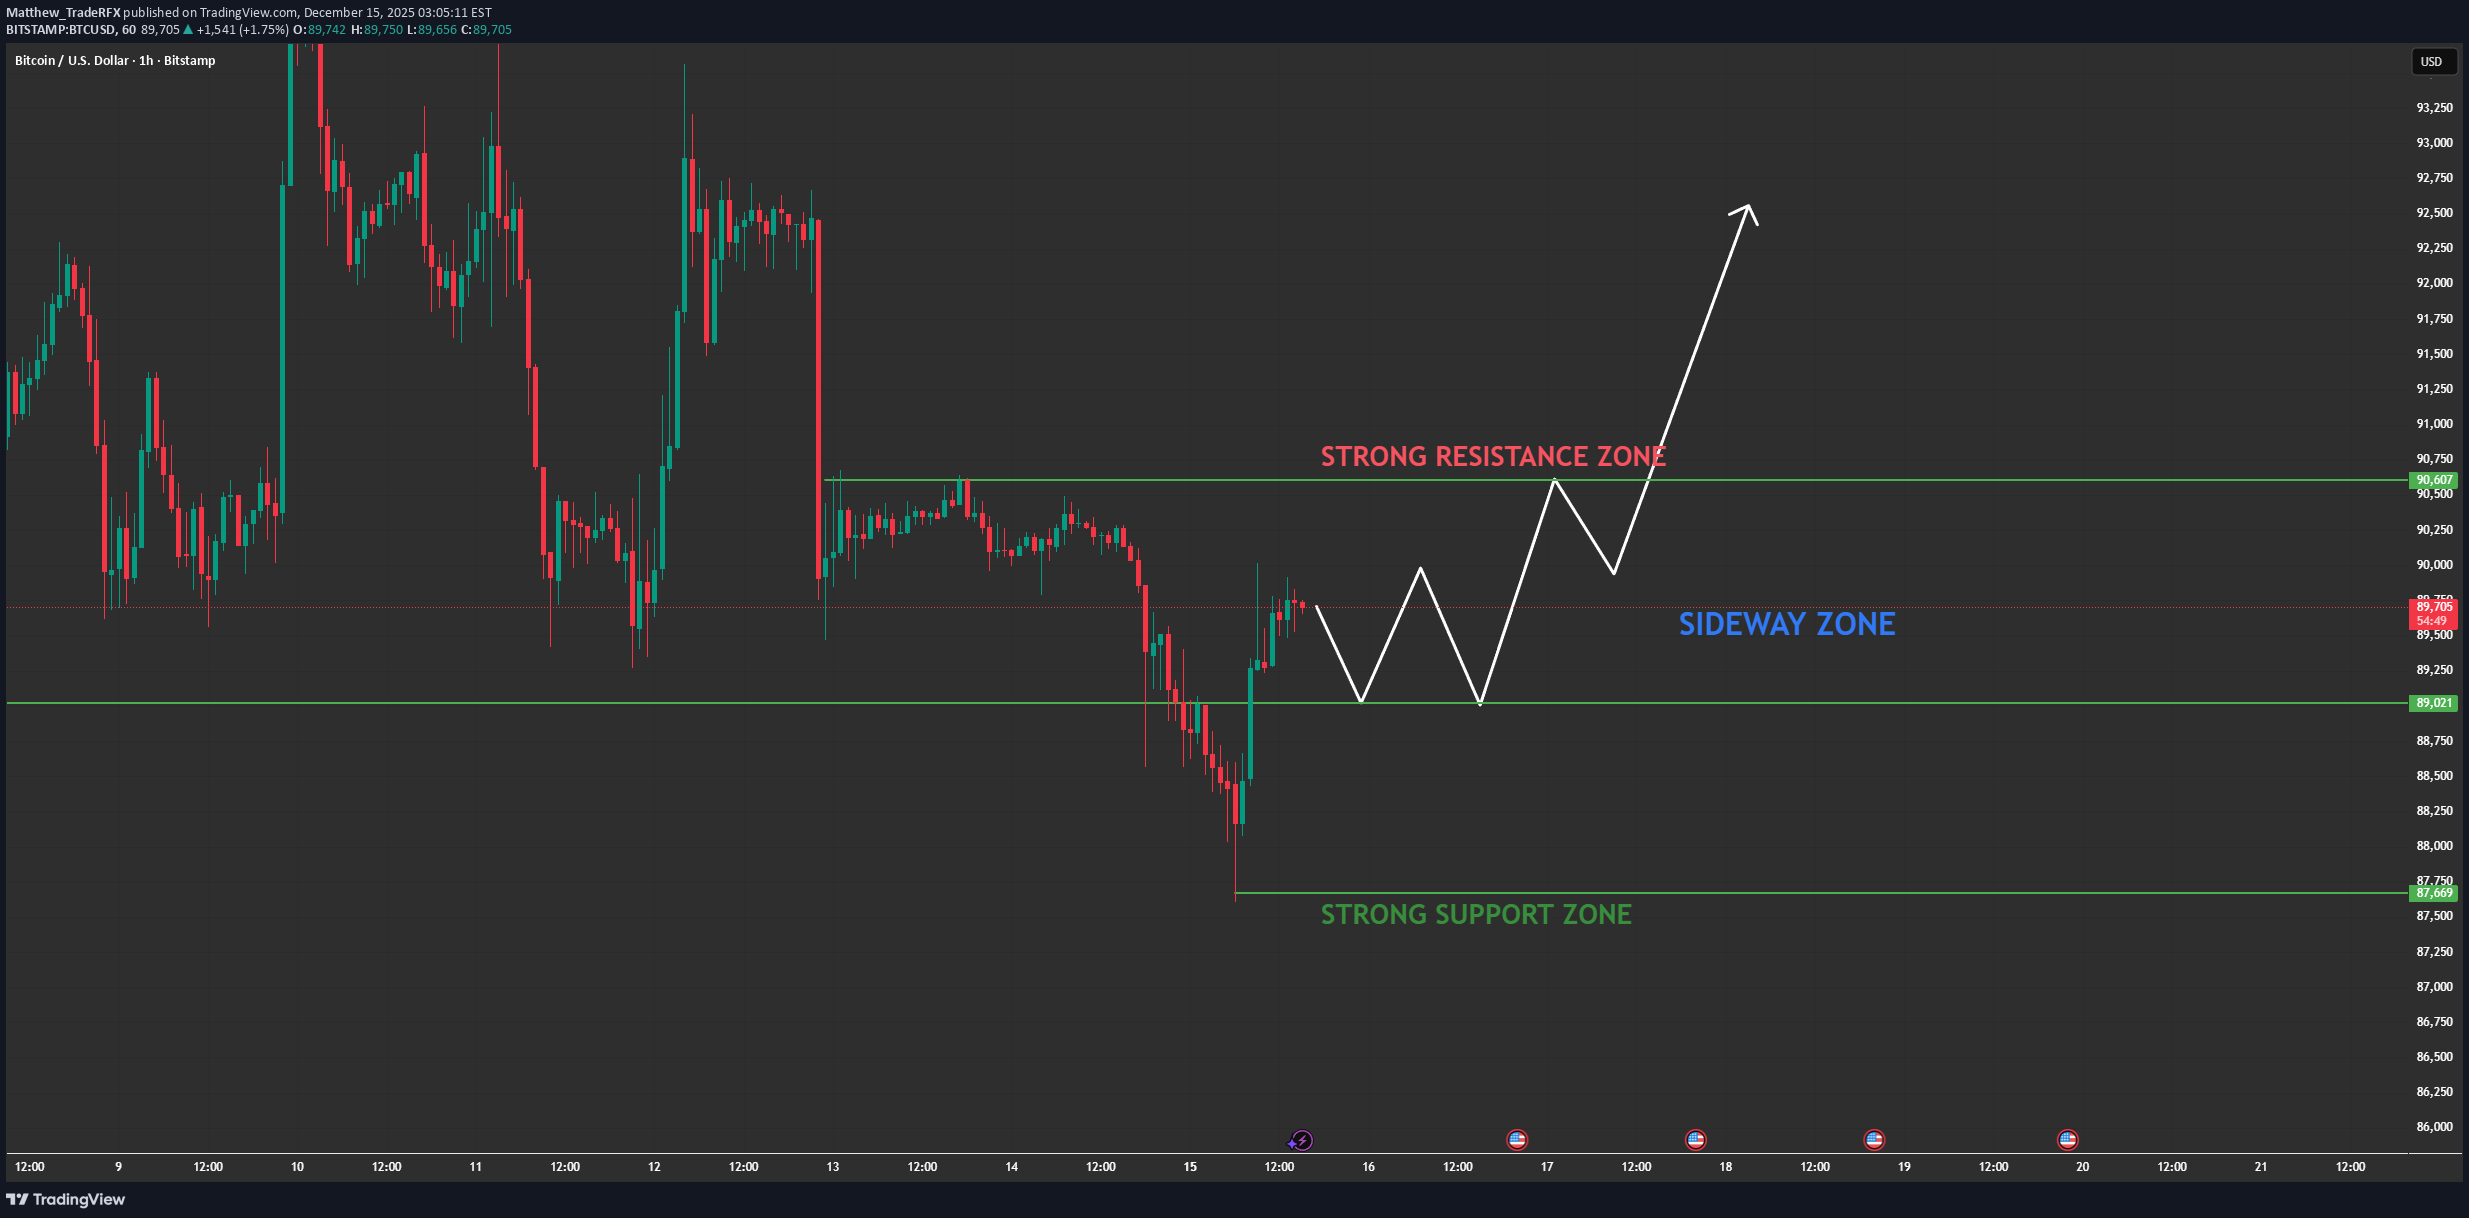
Market State: – Bitcoin is trading inside a defined sideways structure, bounded by a strong support zone near 87,500–88,000 and a heavy resistance band around 90,500–91,000. – The sharp sell-off into support was immediately absorbed, followed by a rebound — confirming buyers are defending the range, not abandoning it. Key Levels: – Strong Support: 87,500 – 88,000 – Range Mid / Balance: ~89,000 – Strong Resistance: 90,500 – 91,000 – Breakout Trigger: Acceptance above 91,000 Price Action Read: – Repeated rejections at resistance and higher lows from support signal range compression. – This is not trend continuation yet — it is market indecision resolved through time, not price. NEXT MOVE SCENARIOS ➡️ Primary Scenario – Range Continuation – Price oscillates between support and resistance. – Buy reactions near 87,500–88,000, fade moves into 90,500–91,000. ➡️ Breakout Scenario (Macro-Driven) – A decisive break and acceptance above 91,000 requires: • Dovish Fed repricing • USD weakness • Broader risk-on rotation – Only then does upside expansion become sustainable. ❌ Invalidation: – A clean breakdown below 87,500 would shift bias to deeper corrective price discovery.
Gold Is Pulling Back Before the Next Expansion
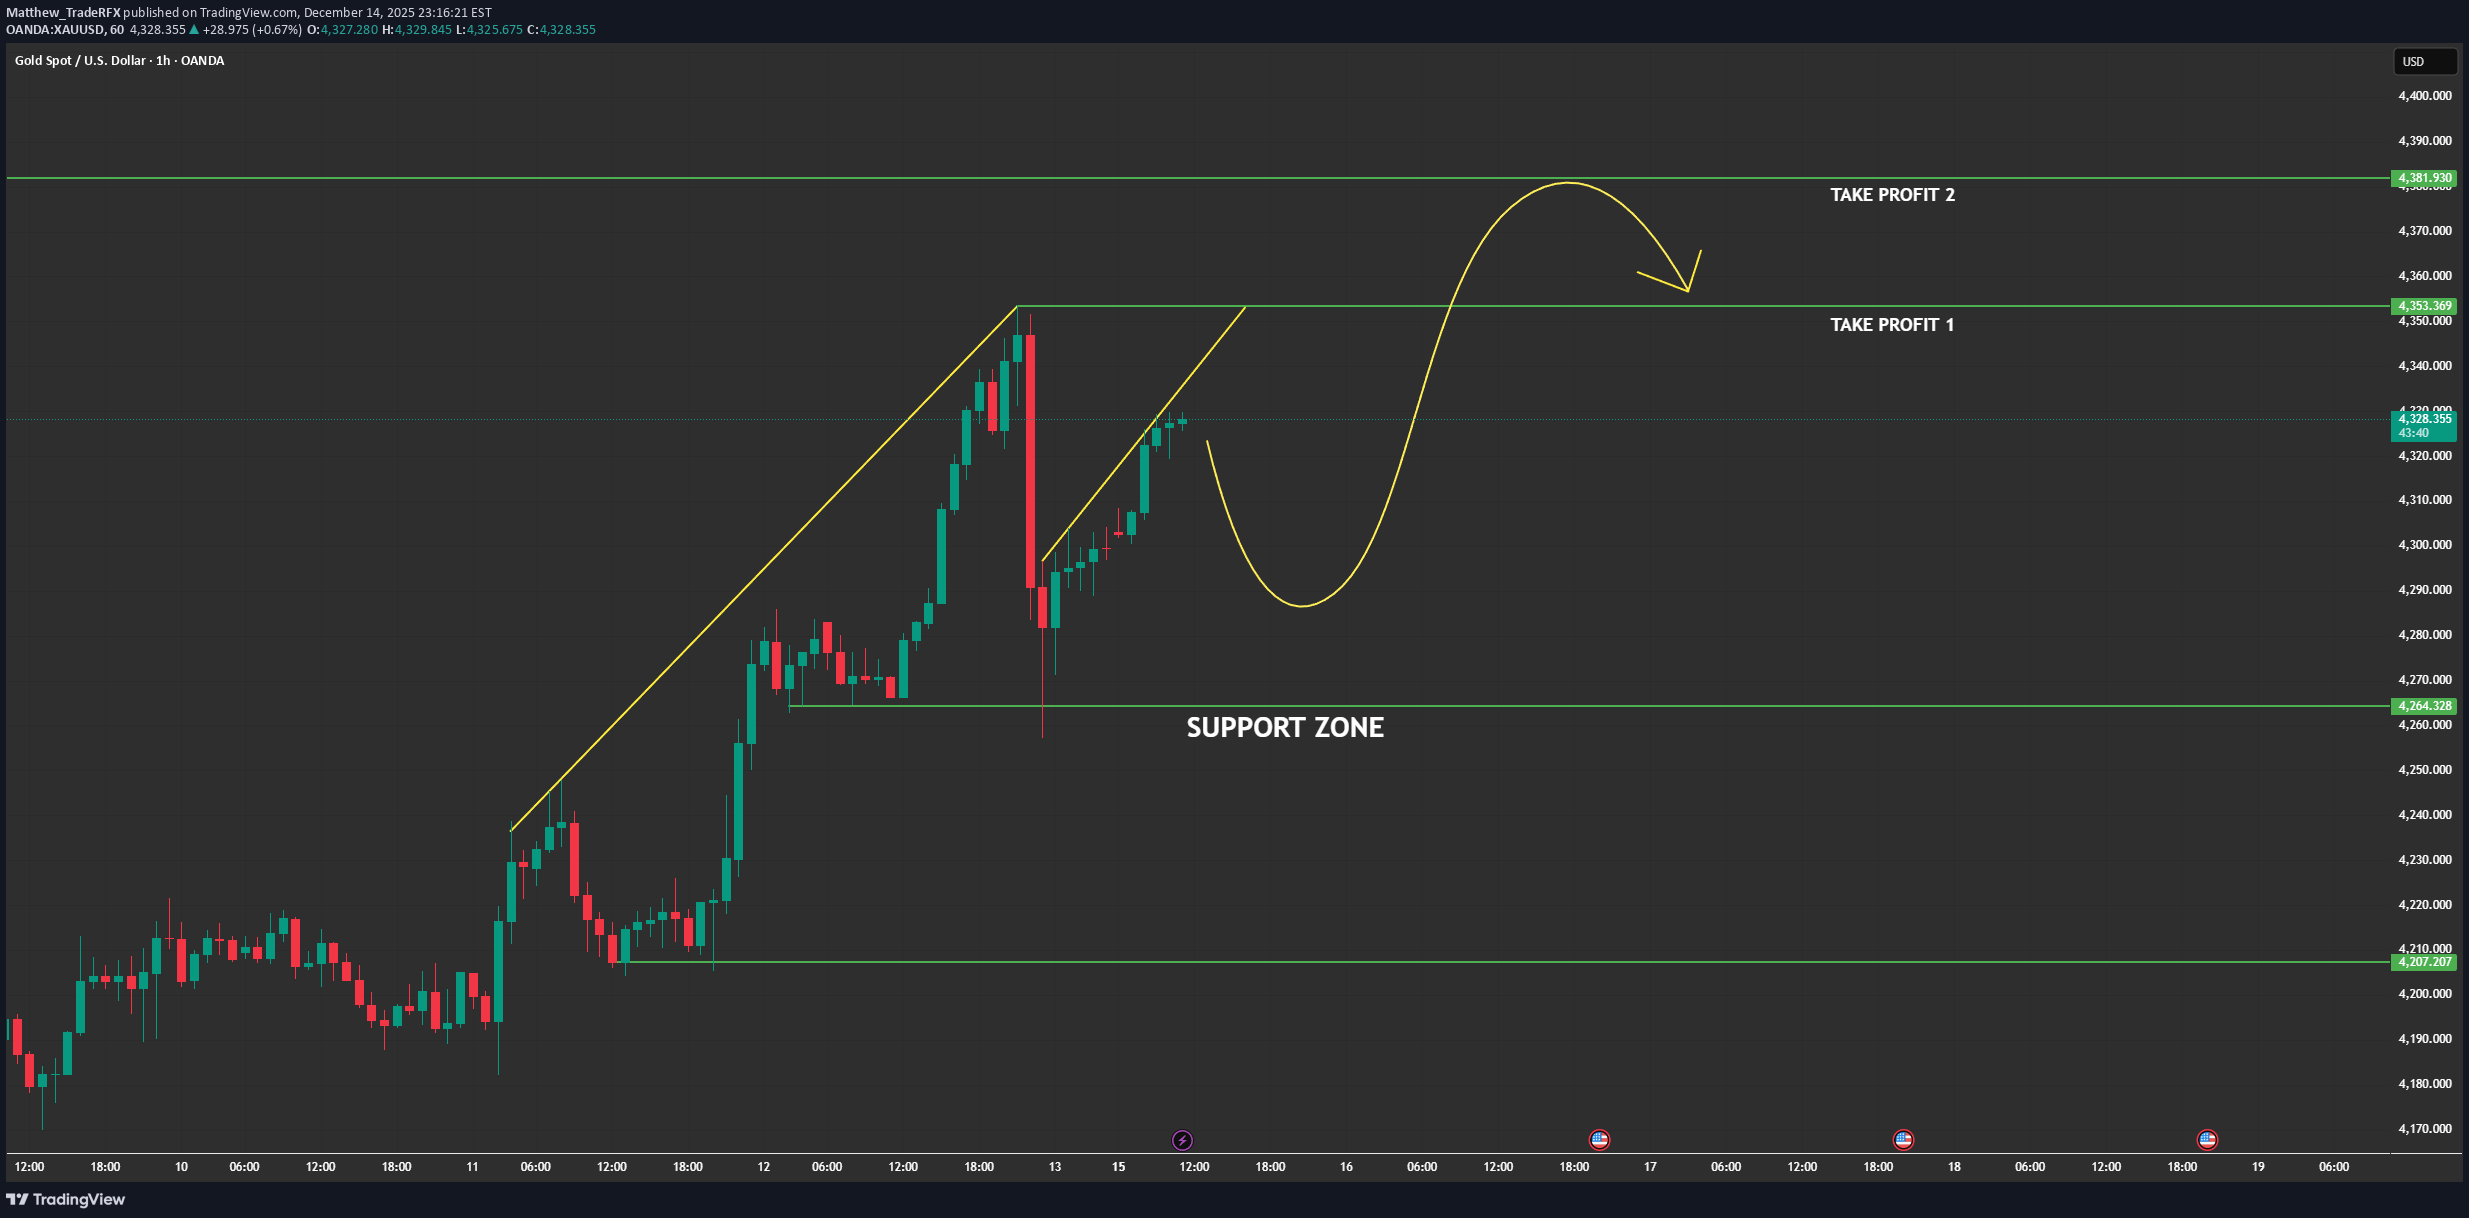
MARKET BRIEFING – XAUUSD (H1) Gold remains in a clean bullish structure on H1. The recent pullback is corrective, not a reversal. The sharp bearish candle was a liquidity sweep, immediately absorbed by strong buying confirming buyers are still in control and structure stays HH–HL. Key Levels: – Main Support (Demand): 4260 – 4270 – Current Range: 4270 – 4350 – Upside Targets: • TP1: 4350 – 4360 • TP2: 4380 – 4390 Price Action Read: Sell-side liquidity has been absorbed inside the support zone. Long lower wicks show aggressive demand. Price is consolidating above support a re-accumulation phase within the uptrend, building energy for the next expansion. Scenario: ➡️ Bullish Continuation (Primary): Hold above 4260 → consolidate → push higher → break toward TP1, then TP2. Pullbacks into support = continuation setups, not weakness. ❌ Invalidation: A decisive H1 close below 4260 would delay the bullish expansion and open room for a deeper correction. Bias: Buy pullbacks. Don’t chase highs. Gold is not distributing it’s loading the next impulsive leg.Gold Update — Short-Term Consolidation, Bullish Bias Intact Gold is currently moving sideways after a strong bullish breakout, which is a healthy pause rather than a sign of reversal. Price is holding above key support and previous breakout structure, showing that buyers remain in control while the market digests recent gains. From a macro perspective, soft U.S. yields, a less aggressive USD, and ongoing safe-haven demand continue to provide a solid floor for gold. This consolidation phase is likely accumulation before the next expansion, not distribution. As long as gold holds above the current support zone and maintains higher lows, the broader trend remains bullish, with the next upside leg expected once liquidity is fully absorbed.
اتریوم در لبه پرتگاه: آیا قیمت ETH به زودی سقوط میکند؟ (تحلیل کلیدی)
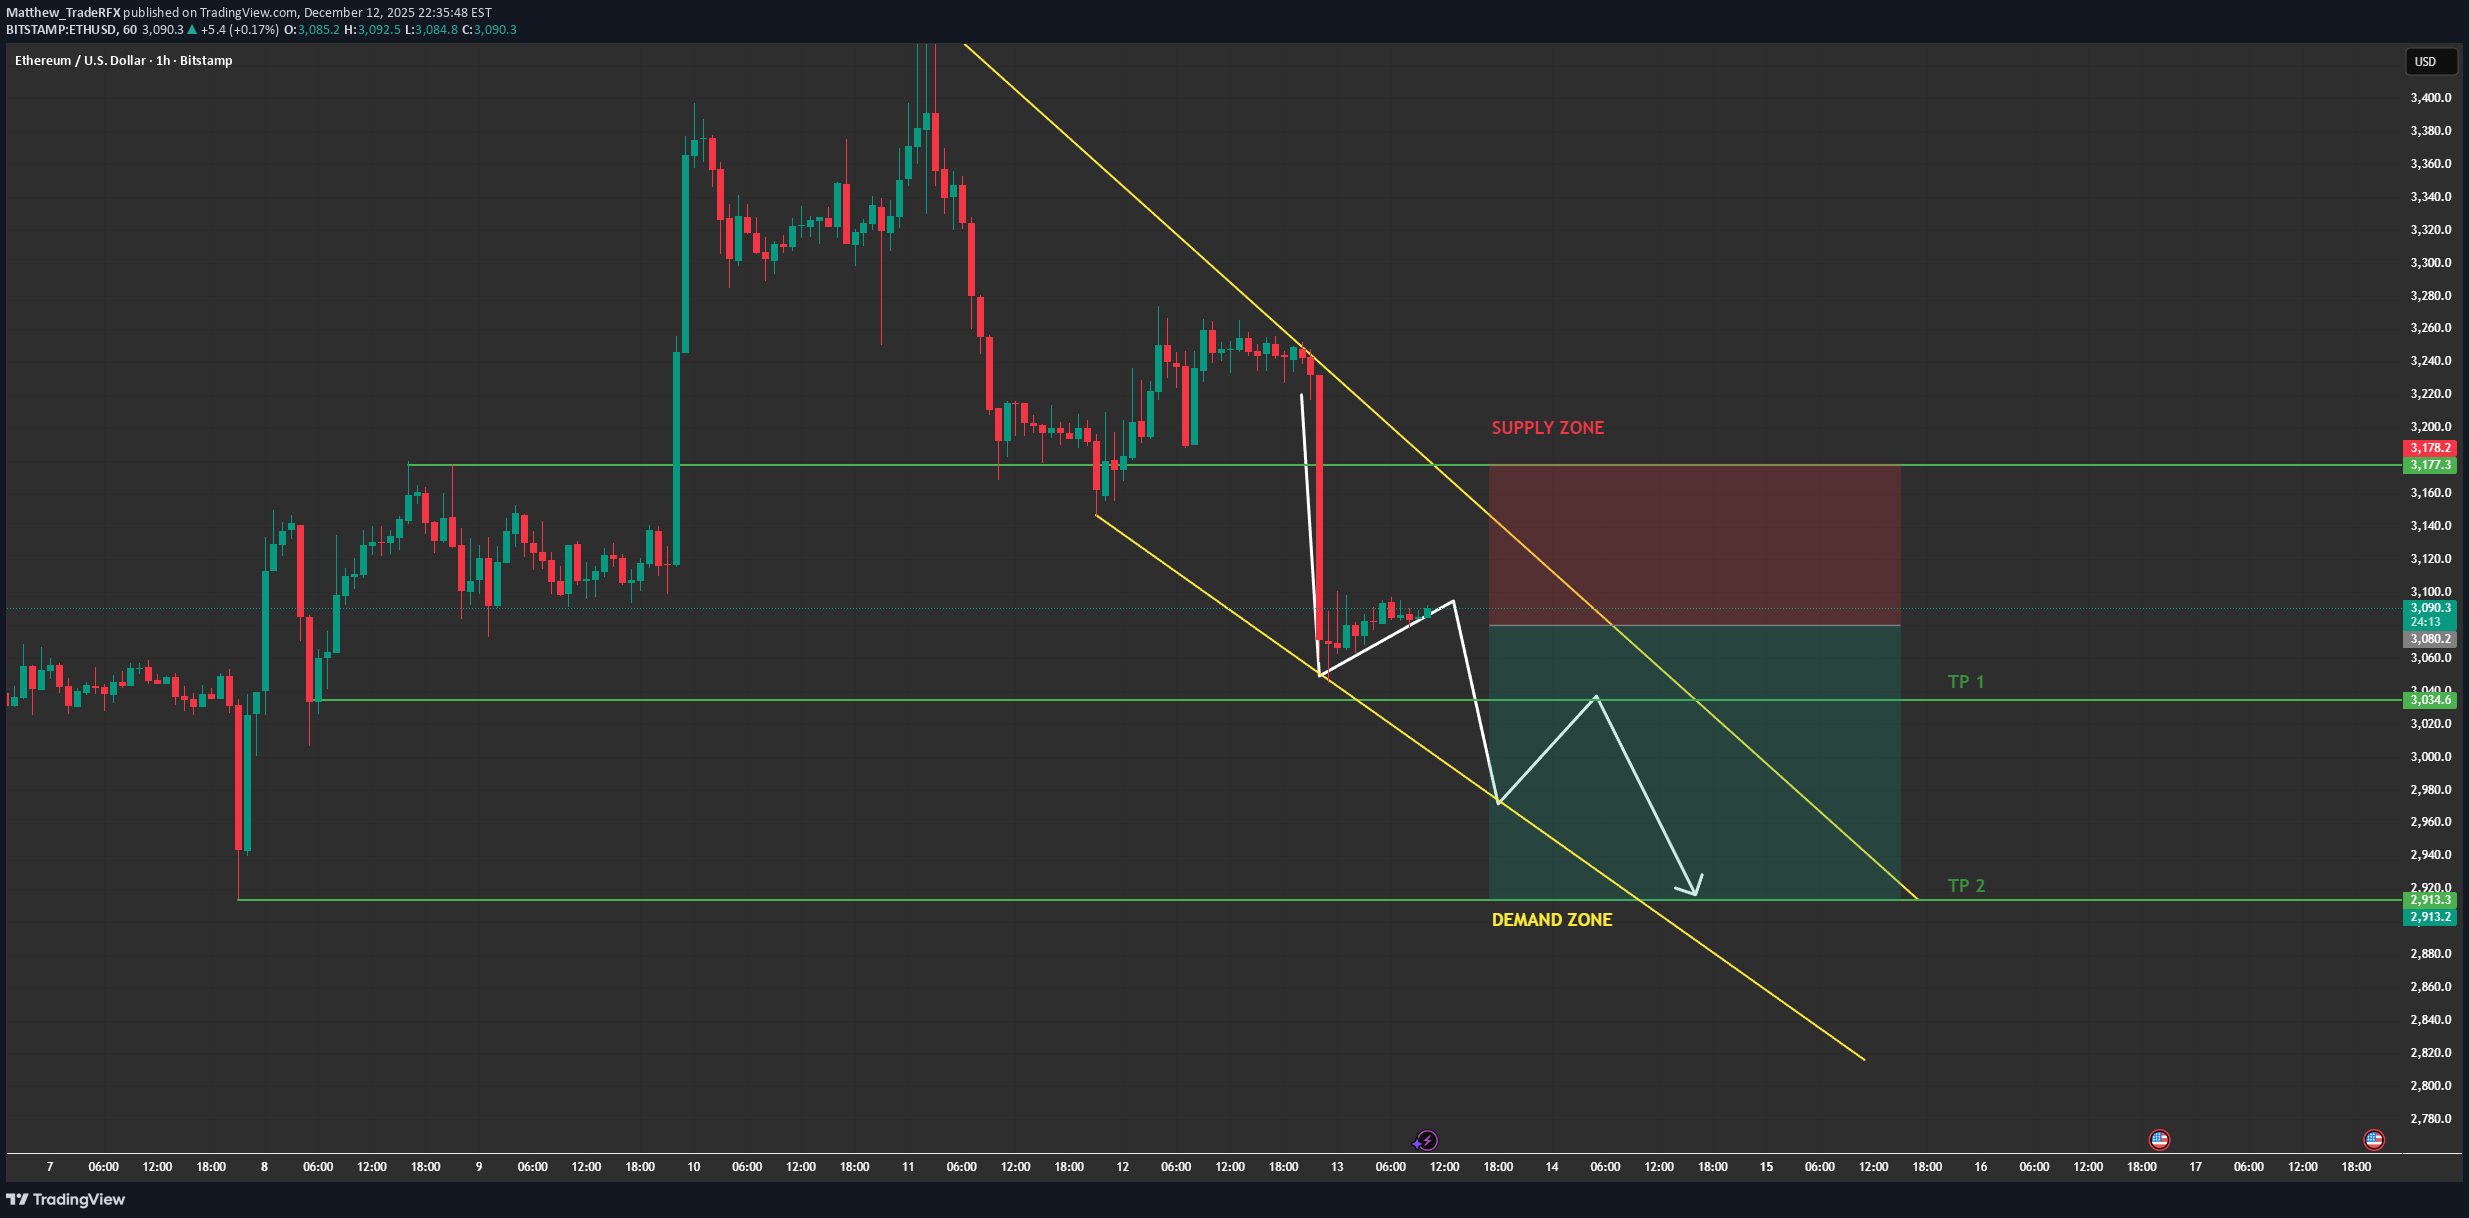
🔹 MARKET BRIEFING – ETH/USD (1H) Market State: – Ethereum is currently trading within a descending channel, with price testing the lower boundary of the demand zone. There’s a clear structure setting up for a potential downside move toward the lower targets. Key Levels: – Supply Zone: ~3,170 – 3,180 – Demand Zone (Support): ~3,060 – 3,070 – Target 1 (TP1): ~3,014 – Target 2 (TP2): ~2,913 Next Move: – A rejection at the supply zone may trigger a strong downside move toward the demand zone, with targets set for 3,014 and 2,913. If the demand zone holds, ETH/USD could rebound to test the upper boundary of the descending channel.
بیت کوین سقوط کرد: تایید روند نزولی و اهداف جدید قیمت زیر ۹۱,۵۶۳ دلار
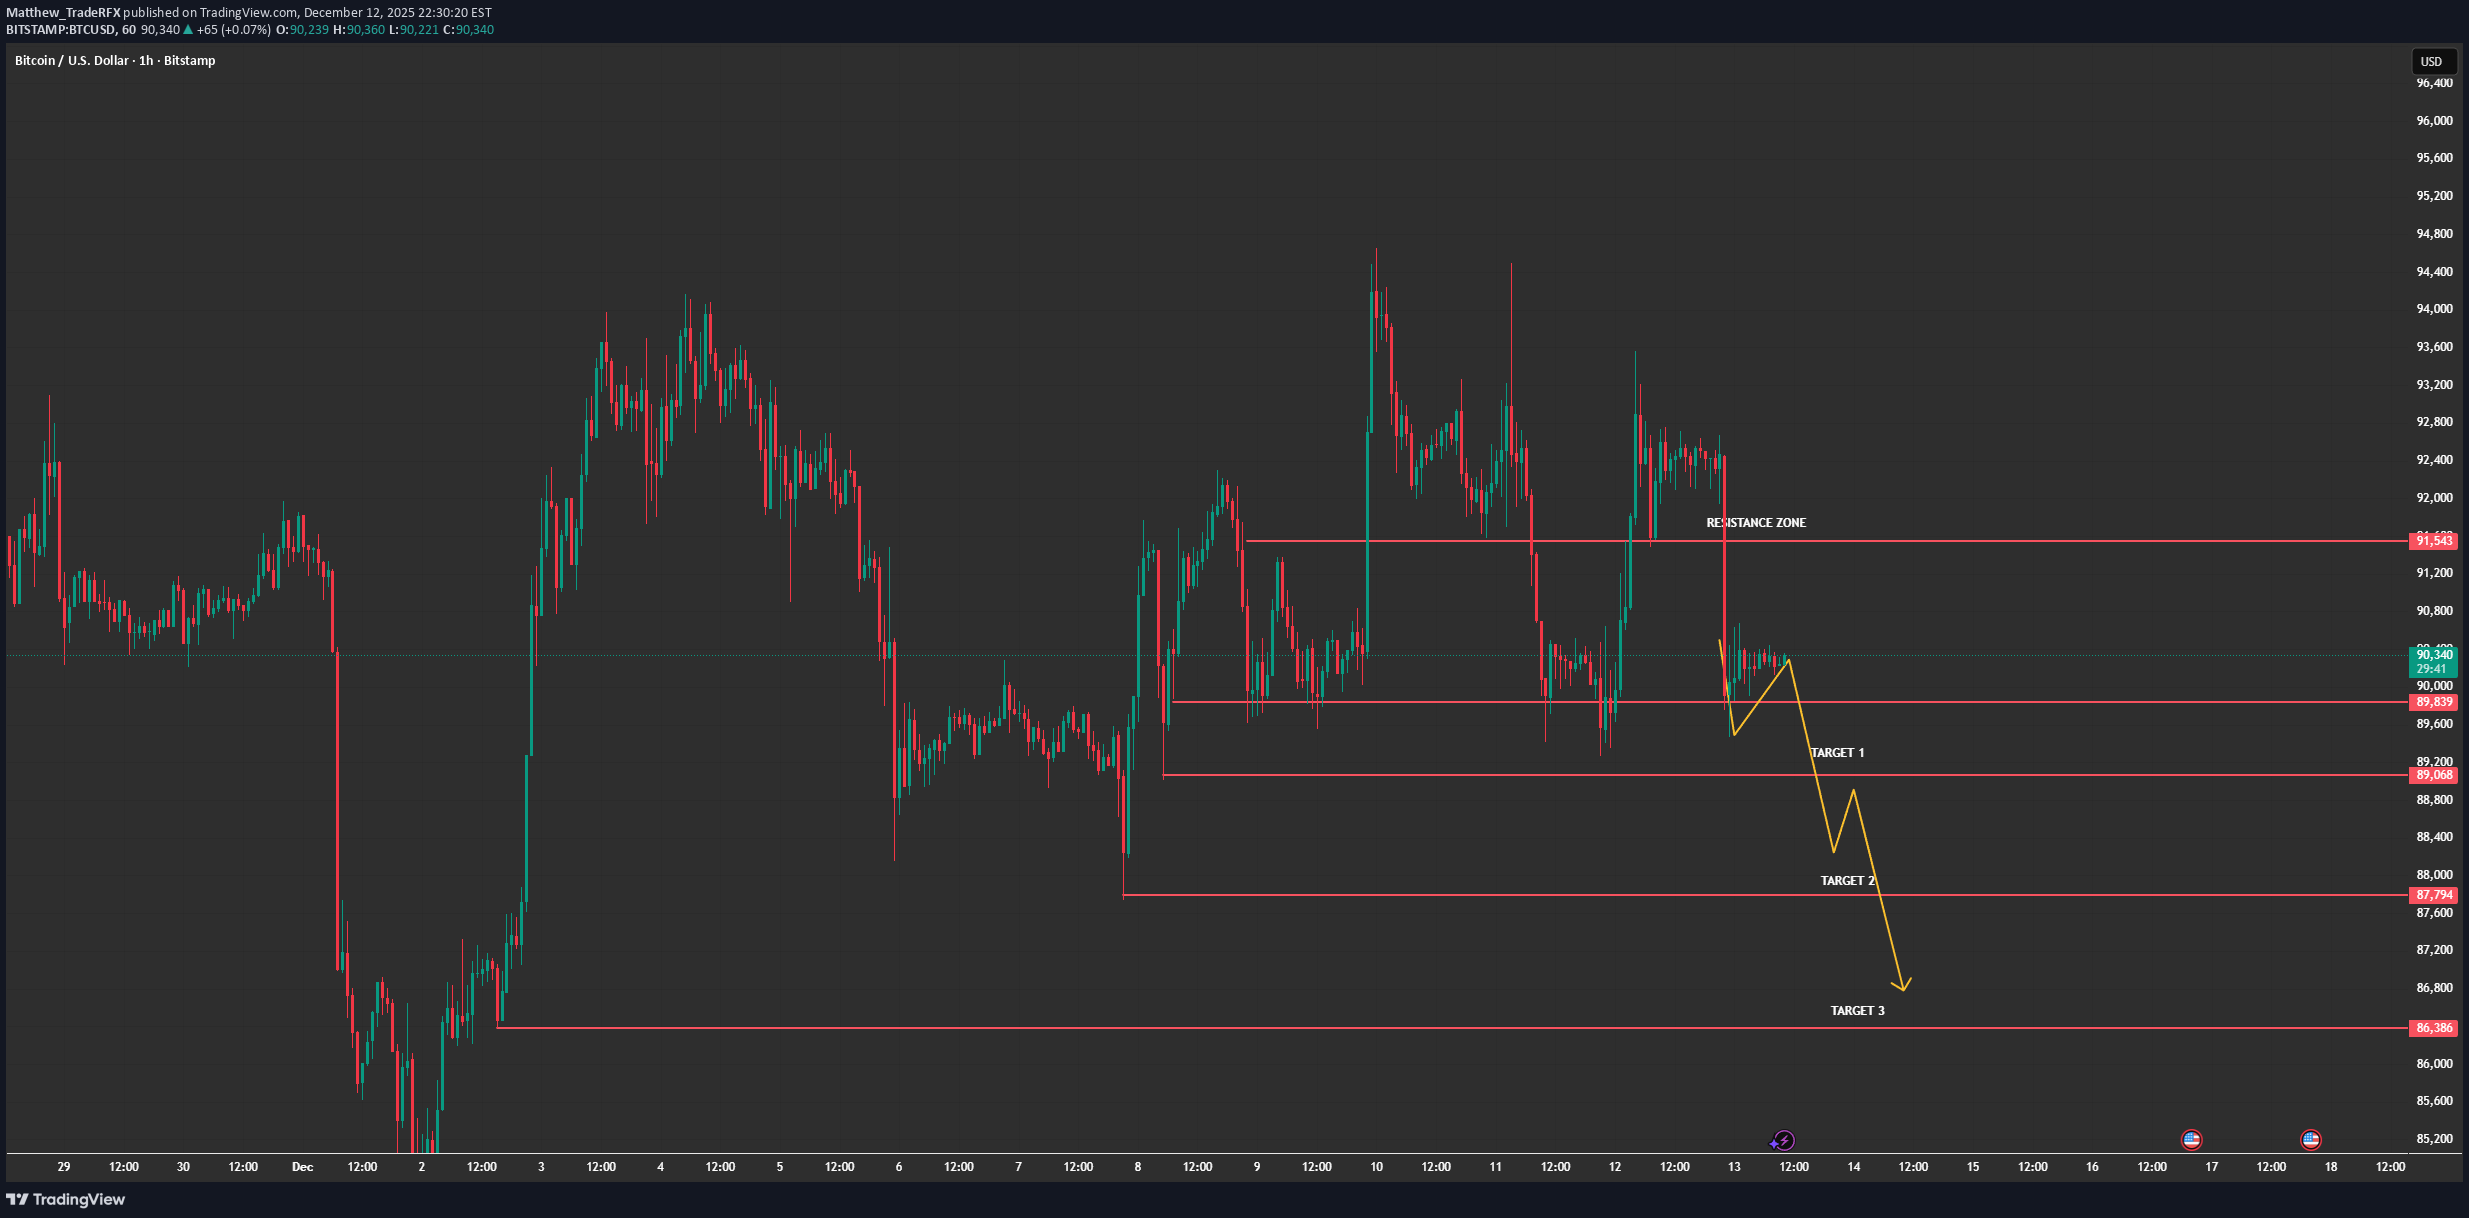
As per the updated analysis, BTCUSD has reversed its previous bullish momentum and is now poised for a downtrend toward lower targets. The chart shows a well-defined resistance zone at 91,563, where price has started to recoil and move lower. 🔹 Market State: Bearish Reversal Confirmed BTCUSD has now entered a consolidation phase below the resistance zone, with price rejecting the higher levels around 91,563. The market is setting up for a downside continuation with clear price action signals. The move lower has already begun, and targets are positioned around 89,200 (Target 1), 88,000 (Target 2), and 86,386 (Target 3). 🔹 Macro Factors Driving the Decline: 1. Risk-Off Sentiment Prevails Yesterday's decline can be attributed to the broad market risk-off sentiment. Concerns about global economic uncertainty, geopolitical tensions, and weaker-than-expected economic data are pressuring risk assets like Bitcoin. 2. Strong USD and Profit-Taking The US dollar’s strength has been a key factor in BTC's retreat. As the dollar rises, investors typically retreat to more secure assets, causing Bitcoin and other risk assets to experience declines. Profit-taking after Bitcoin's recent surge also contributed to the market's downward movement. 3. Fed Rate Expectations Fed's hawkish stance (with interest rates possibly staying higher for longer) is placing further pressure on risk assets, making them less attractive to investors. This also increases the capital inflow into USD and dampens demand for Bitcoin. 4. Macro Data Weakness Poor economic indicators such as reduced job growth or disappointing inflation figures could contribute to the broader market decline. The weak economic data creates more uncertainty, prompting liquidation of higher-risk assets. 🔹 Price Expectations and Targets: Resistance Zone: 91,563 (Key Rejection Point) Target 1: 89,200 Target 2: 88,000 Target 3: 86,386 As long as price remains below 91,563, the bearish continuation setup is intact, and the market is expected to decline towards Target 1, then Target 2 and Target 3.BTCUSD Update — Target 2 Achieved, New Upside Scenario in Play Congratulations to all traders — Target 2 has been completed exactly as planned. Price reacted cleanly from the demand zone, confirming that the prior sell-off was a liquidity sweep rather than a structural breakdown. With downside objectives fulfilled, the market has now shifted into a recovery and re-accumulation phase. Outlook: The preferred scenario is short-term consolidation, formation of a higher low, then a push toward Target 1 → Target 2 → Target 3. A breakout above 91,500 with volume would open upside toward 93,000–94,000. The bullish setup remains valid unless price breaks and holds below 87,700. Macro Support: Risk-off pressure is fading, Fed expectations remain dovish, ETF demand continues to absorb supply, and there is no strong macro catalyst favoring further downside.
تحلیل حرکت اتریوم: حرکتی که هیچ معاملهگری انتظارش را ندارد!
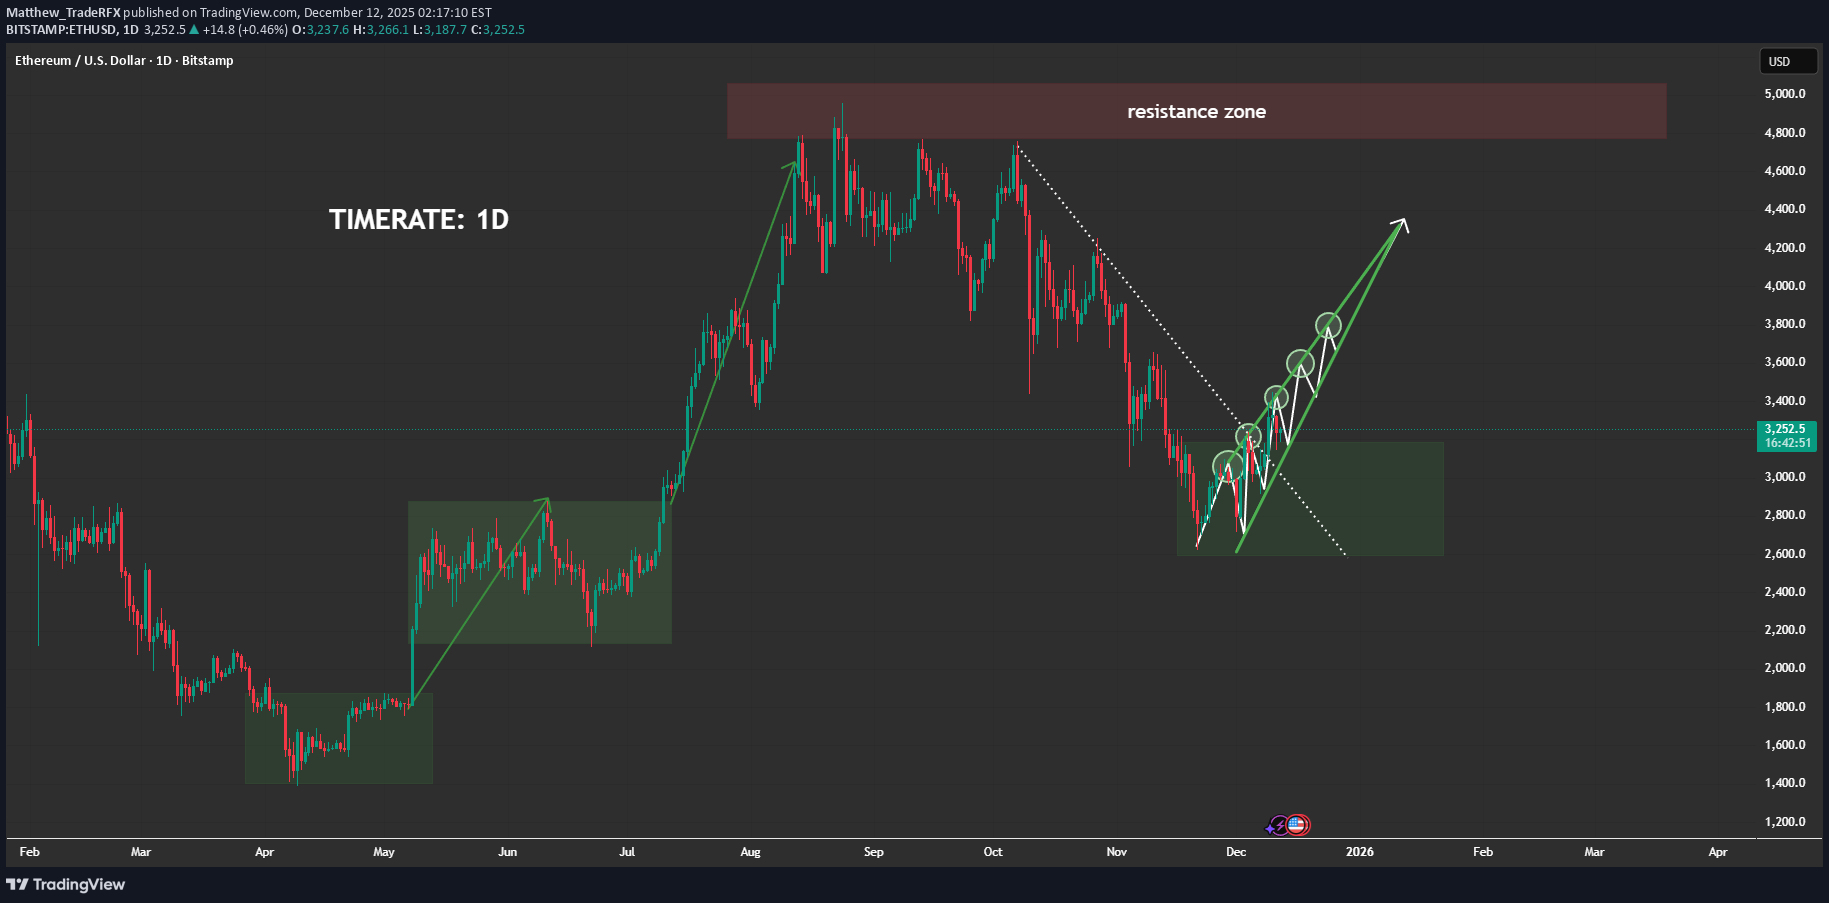
ETHEREUM 1D MARKET ANALYSIS 1. Current Price Structure - ETH previously completed a strong bullish impulsive wave, breaking through multiple resistance levels before reaching the major 4,800–5,000 resistance zone, where the market formed a clear distribution top. -After distribution, price entered a large corrective decline, following the descending dotted trendline visible on your chart. -Recently, ETH has formed a broad accumulation block (highlighted in green), similar to the previous accumulation phases that triggered massive ETH rallies earlier in the year. Inside this zone, ETH is now building a series of higher lows, showing early signs of bullish reconstruction. -The current rising green structure indicates that price is forming a stair-step bullish pattern, preparing for a potential macro reversal. 2. Key Liquidity Zones -Major Resistance Zone: 4,800–5,000 -This is the next major destination if ETH successfully completes the accumulation and transitions into expansion. -Accumulation Block: 2,750–3,150 -This is where smart money is currently active — sweeping liquidity, trapping sellers, and accumulating long positions. -Multiple liquidity grabs have already occurred inside this range, confirming strong institutional absorption. -The current structure closely mirrors previous accumulation rectangles on the chart that led to massive bullish expansions. 3. Today's Market Scenario (1D Outlook) Matches perfectly with the upward projection on your chart. 🔹 Main Scenario – Bullish Continuation After Accumulation ETH is likely to follow this sequence: -Continue building higher lows inside the accumulation block. -Retest the inner structure trendline without breaking the macro zone. -Form a clean break above the descending dotted trendline — signaling a bullish structure shift. -Retest the broken trendline to form the final higher low. -Begin expansion to the next major liquidity magnets: -Short-term targets: 3,600 → 3,800 -Mid-term continuation: 4,200 → 4,500 -Macro target: 4,800–5,000 resistance zone This is fully aligned with the green arrow projection you drew. 4. Market Psychology -Big players are actively accumulating within this wide range clear repeated liquidity sweeps prove institutional activity. -Retail traders are losing positions during sudden spikes and false breakdowns, which is typical behavior during accumulation phases. -The market is more likely preparing for a major trend reversal, not a continuation downward. -The price behavior mirrors earlier patterns: Accumulation → Trendline Break → HL Retest → Massive Expansion -This repetition increases confidence in the bullish outlook. 5. Intraday Strategy Guidance (1D) Given the macro accumulation: -Avoid selling aggressively the probability is against sustained bearish continuation. -Best opportunities come from buying dips inside the accumulation zone. -Watch for liquidity sweeps below local lows to identify smart-money entries. High-probability setups: ✔️ Strategy 1: Buy the Bottom of the Range Entry zones: 2,750–3,150 Targets: 3,600 → 3,800 ✔️ Strategy 2: Buy the Retest After Trendline Breakout This is the cleanest and safest setup. Targets: 4,200 → 4,500 → 4,800+ ETH is currently in the prime zone where large investors position themselves before a new bullish cycle.
اتریوم در انتظار فدرال رزرو؛ سطوح حیاتی برای حفظ یا سقوط قیمت!
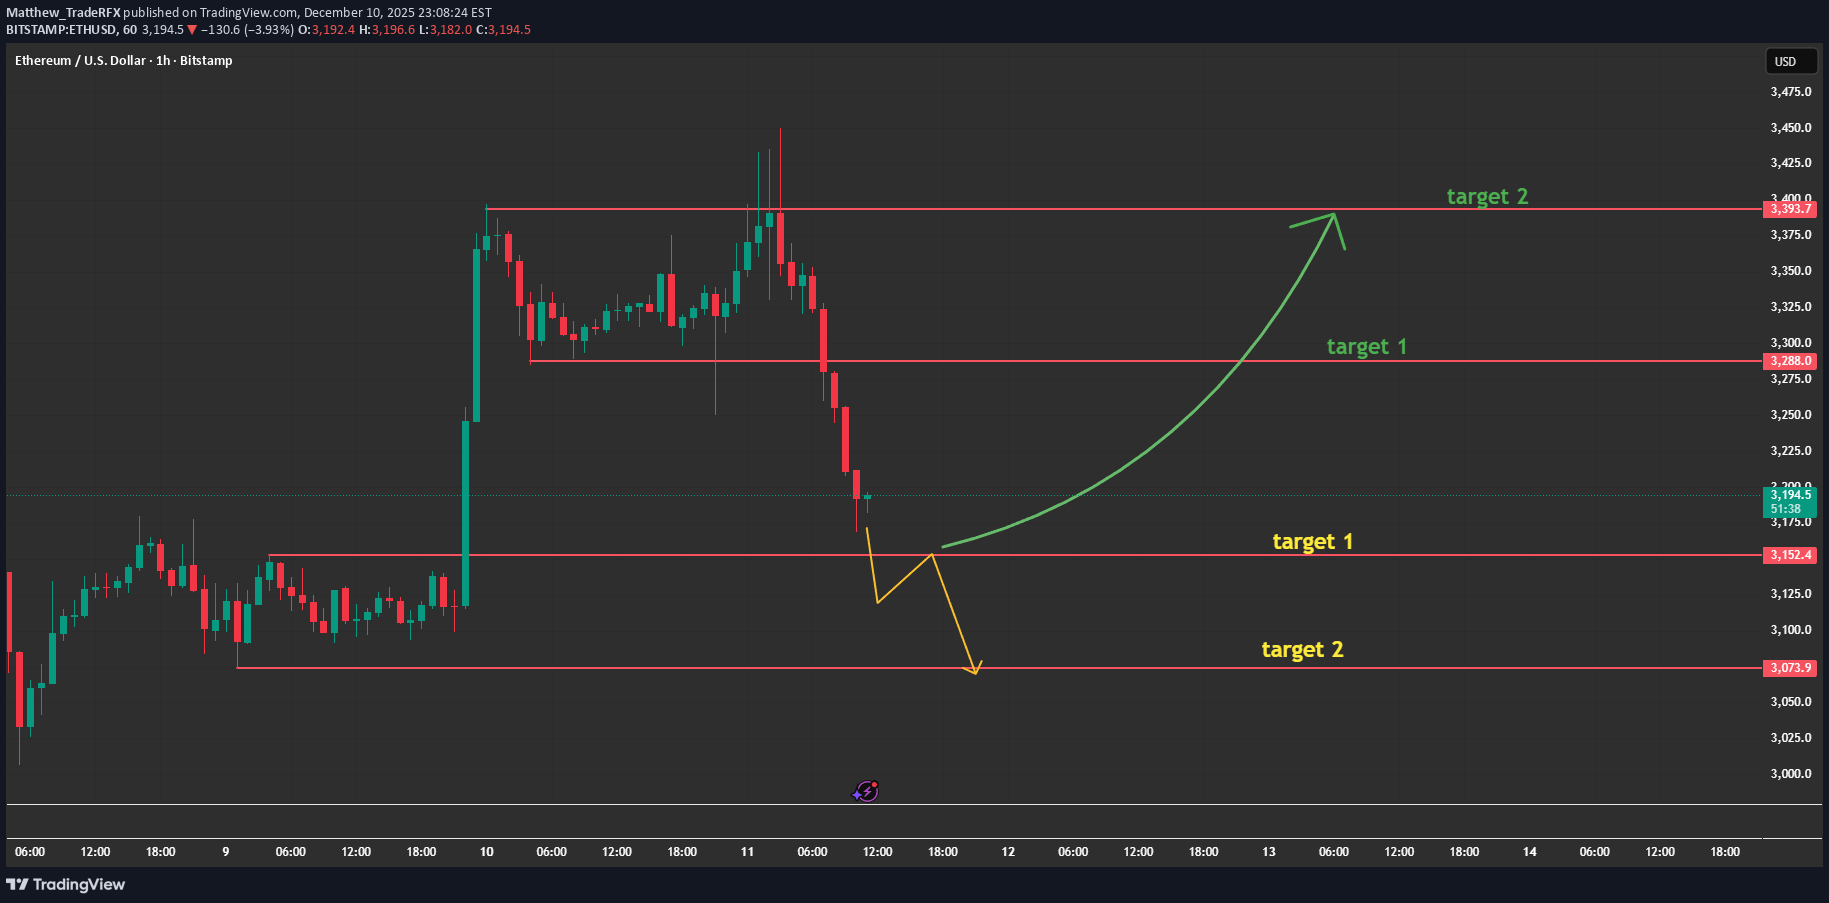
🔹 MARKET BRIEFING – ETH/USD Market State: – Price has broken down from the previous range and is now testing the lower support area, showing weakening momentum after the sharp decline. Key Levels: – Support Zone / Target 1: 3152 – Support Zone / Target 2: 3073 – Resistance / Recovery Target 1: 3288 – Resistance / Recovery Target 2: 3393 Next Move: – Price may form a short-term base around 3152; holding this level could trigger a recovery toward 3288 → 3393. – If 3152 fails to hold, downside continuation toward 3073 remains the more likely scenario.ETH has now entered a clean buy zone — structure, liquidity, and momentum are all aligned. This is exactly where smart money tends to position early before the next expansion phase. With price reacting well to demand and liquidity forming beneath, the zone is officially active for bullish setups. Added Macro & News Factors Supporting the Move Dovish Fed tone and growing expectations of rate cuts are boosting risk-on sentiment across crypto. Improving market liquidity and stronger inflows into major altcoins are supporting upside continuation. ETF discussions & regulatory clarity have increased investor confidence, helping ETH maintain strong structural support. Conclusion: Wait for clean confirmation signals — but fundamentally and technically, ETH is positioned for a potential bullish continuation.
FED Turns Hawkish — Bitcoin Drops Hard
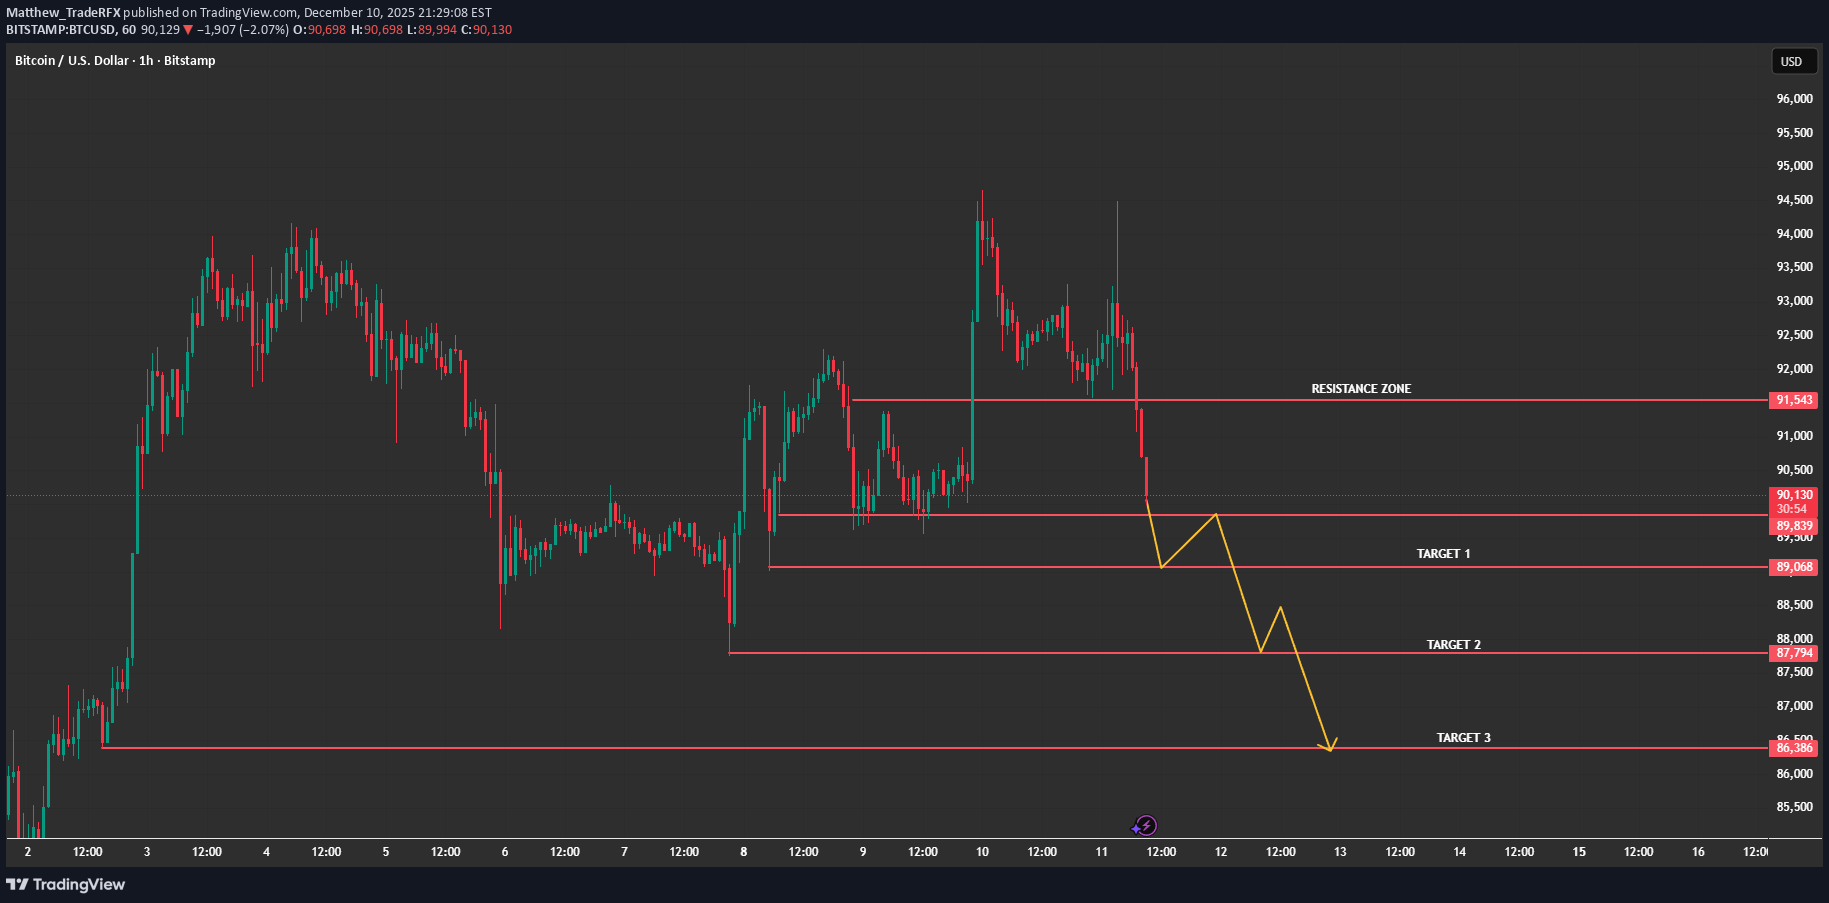
Bitcoin has begun to move exactly in line with the projected downside structure. After rejecting the resistance zone around 91,543, price has broken below the short-term support and is now entering a clean retracement phase. At this stage, BTC is likely to continue following the descending path toward the key liquidity zones highlighted on your chart: Target 1: 89,068 Target 2: 87,794 Target 3: 86,386 The market structure shows clear lower highs and lower lows, signaling that sellers are currently in control. Until BTC can reclaim the mid-range zone above 90,800–91,000, the bearish outlook remains valid. This corrective move is healthy for the broader trend, helping sweep liquidity and rebalance price before any larger directional expansion.BTC Outlook — Bias Turning Bullish as Macro Conditions Improve Bitcoin moved exactly as expected yesterday, hitting your targets cleanly. Now price is holding above key demand zones, showing early signs of a bullish shift even while remaining in short-term consolidation. Structure: Accumulation Inside the Range BTC continues ranging, sweeping liquidity at both edges a typical setup before expansion. Buyers are quietly defending higher-timeframe support, signaling accumulation rather than weakness. Macro Turning Supportive Fed leaning dovish → rate-cut expectations rising → weaker USD → bullish for BTC Global liquidity improving, risk assets rotating higher ETF inflows still strong, absorbing supply on every dip Geopolitical uncertainty keeping hedge demand elevated These factors raise the probability of an upside breakout. Expect BTC may keep ranging short-term, but the bias now favors a bullish breakout once liquidity builds and price breaks the upper range with momentum.BTCUSD Update — Bearish Trend Confirmed with Downside Targets As per the updated analysis, BTCUSD has reversed its previous bullish momentum and is now poised for a downtrend toward lower targets. The chart shows a well-defined resistance zone at 91,563, where price has started to recoil and move lower. 🔹 Market State: Bearish Reversal Confirmed BTCUSD has now entered a consolidation phase below the resistance zone, with price rejecting the higher levels around 91,563. The market is setting up for a downside continuation with clear price action signals. The move lower has already begun, and targets are positioned around 89,200 (Target 1), 88,000 (Target 2), and 86,386 (Target 3). 🔹 Macro Factors Driving the Decline: 1. Risk-Off Sentiment Prevails Yesterday's decline can be attributed to the broad market risk-off sentiment. Concerns about global economic uncertainty, geopolitical tensions, and weaker-than-expected economic data are pressuring risk assets like Bitcoin. 2. Strong USD and Profit-Taking The US dollar’s strength has been a key factor in BTC's retreat. As the dollar rises, investors typically retreat to more secure assets, causing Bitcoin and other risk assets to experience declines. Profit-taking after Bitcoin's recent surge also contributed to the market's downward movement. 3. Fed Rate Expectations Fed's hawkish stance (with interest rates possibly staying higher for longer) is placing further pressure on risk assets, making them less attractive to investors. This also increases the capital inflow into USD and dampens demand for Bitcoin. 4. Macro Data Weakness Poor economic indicators such as reduced job growth or disappointing inflation figures could contribute to the broader market decline. The weak economic data creates more uncertainty, prompting liquidation of higher-risk assets. 🔹 Price Expectations and Targets: Resistance Zone: 91,563 (Key Rejection Point) Target 1: 89,200 Target 2: 88,000 Target 3: 86,386 As long as price remains below 91,563, the bearish continuation setup is intact, and the market is expected to decline towards Target 1, then Target 2 and Target 3.
اتریوم در آستانه انفجار قیمتی: رازهای جمعآوری نهادی پیش از رالی بزرگ
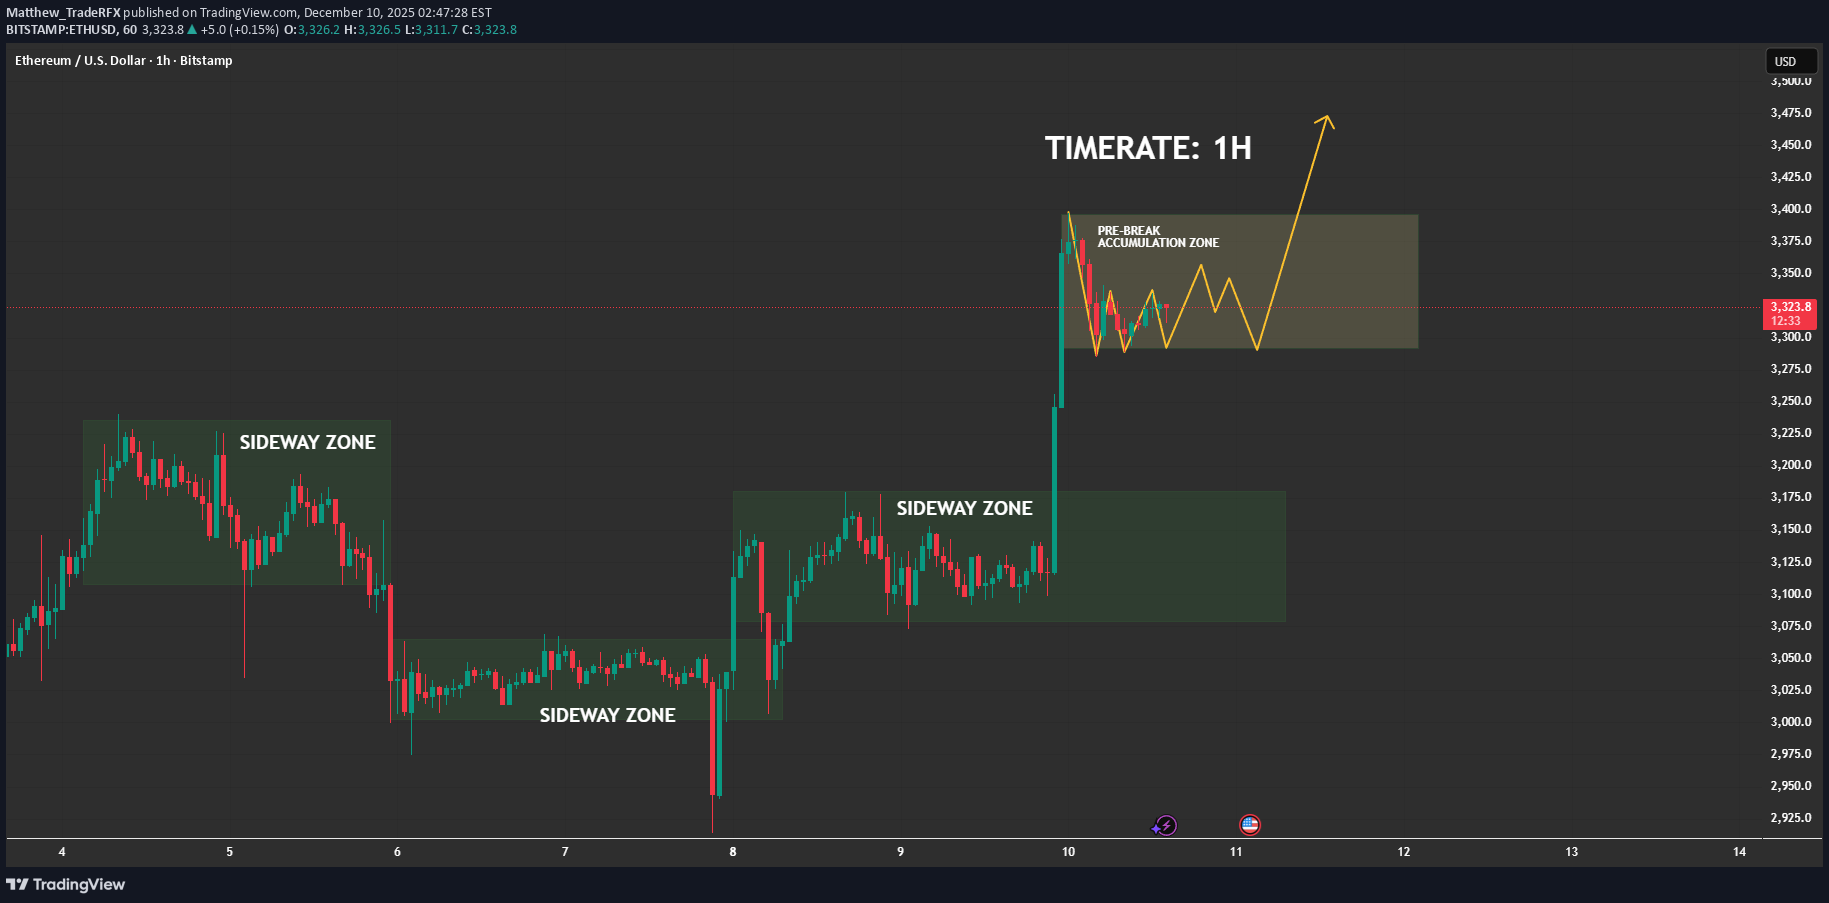
📊 (1) MARKET STRUCTURE — CLEAN SIDEWAY → BREAKOUT → RE-ACCUMULATION The chart shows a repeating pattern: ✔ Phase 1: Sideway Zone ETH repeatedly compresses in sideways zones, forming liquidity pools and equal highs/lows. ✔ Phase 2: Breakout With Strong Momentum Each sideways block ends with a powerful impulsive candle clear evidence of aggressive buy-side imbalance. ✔ Phase 3: Post-Break Re-Accumulation (CURRENT PHASE) Price is now inside the highlighted pre-break accumulation zone, moving in a tight, controlled structure a textbook bullish continuation setup. This is the phase where institutional traders rebalance orders before the next run. 📍 (2) PRICE BEHAVIOR — BULLS IN FULL CONTROL -No sharp rejections after the breakout -Dips are shallow and quickly absorbed -Market is forming higher low micro-structures -Momentum clearly stays in the hands of buyers This confirms the market is not distributing, but absorbing liquidity and building a base. 🌐 (3) MACRO FACTORS SUPPORTING ETH UPSIDE ✔ ETH ETF Approval Momentum (US + Asia) Regulatory mood continues shifting positively, with multiple jurisdictions preparing Ethereum ETF products. Institutional demand keeps increasing quietly in the background. ✔ Falling US Inflation & Dovish Fed Expectations Recent CPI and PPI reports show cooling inflation. The market widely expects 2025–2026 rate cuts, which historically push liquidity into risk assets ETH benefits directly. ✔ Ethereum Supply Shock -Over 27% of ETH is staked -Net supply remains deflationary under high network activity -Reduced exchange reserves signal accumulation This creates a tightening supply environment that amplifies price expansion. ✔ Altcoin Rotation Phase BTC dominance stabilizing → capital increasingly flows into ETH and large-cap alts. Macro + on-chain + liquidity flows all align with a bullish continuation. ⏳ (4) HTF CONTEXT — BULL CYCLE CONFIRMED Higher timeframes show: -ETH broke out of a weekly compression range -Structure is fully bullish -Market currently resetting before next leg -No bearish reversal signals anywhere in sight This supports the thesis that the current 1H accumulation is not random, it is part of a much larger bullish leg forming. 🚀 (5) EXPECTATION — HIGH PROBABILITY SCENARIO ETH is expected to: -Continue oscillating inside the pre-break accumulation zone -Form a series of small higher lows as drawn -Absorb liquidity from both sides -Break out toward 3,400 → 3,450+ The path of least resistance remains upward. 🎯 (6) TRADING INSIGHT (Non-Signal) Markets only explode after liquidity is collected. ETH is doing exactly that holding strong after a breakout and compressing before expansion. This is the signature behaviour of a healthy bullish trend.🔹 MARKET BRIEFING – ETH/USD Market State: – Price has broken down from the previous range and is now testing the lower support area, showing weakening momentum after the sharp decline. Key Levels: – Support Zone / Target 1: 3152 – Support Zone / Target 2: 3073 – Resistance / Recovery Target 1: 3288 – Resistance / Recovery Target 2: 3393 Next Move: – Price may form a short-term base around 3152; holding this level could trigger a recovery toward 3288 → 3393. – If 3152 fails to hold, downside continuation toward 3073 remains the more likely scenario.ETH has now entered a clean buy zone — structure, liquidity, and momentum are all aligned. This is exactly where smart money tends to position early before the next expansion phase. With price reacting well to demand and liquidity forming beneath, the zone is officially active for bullish setups. Added Macro & News Factors Supporting the Move Dovish Fed tone and growing expectations of rate cuts are boosting risk-on sentiment across crypto. Improving market liquidity and stronger inflows into major altcoins are supporting upside continuation. ETF discussions & regulatory clarity have increased investor confidence, helping ETH maintain strong structural support. Conclusion: Wait for clean confirmation signals — but fundamentally and technically, ETH is positioned for a potential bullish continuation.
Disclaimer
Any content and materials included in Sahmeto's website and official communication channels are a compilation of personal opinions and analyses and are not binding. They do not constitute any recommendation for buying, selling, entering or exiting the stock market and cryptocurrency market. Also, all news and analyses included in the website and channels are merely republished information from official and unofficial domestic and foreign sources, and it is obvious that users of the said content are responsible for following up and ensuring the authenticity and accuracy of the materials. Therefore, while disclaiming responsibility, it is declared that the responsibility for any decision-making, action, and potential profit and loss in the capital market and cryptocurrency market lies with the trader.