Harry_Megat
@t_Harry_Megat

What symbols does the trader recommend buying?
Purchase History
پیام های تریدر
Filter
Harry_Megat
تشکیل کف دوقلو در TON/USD: سیگنال خرید یا تله خرسی؟
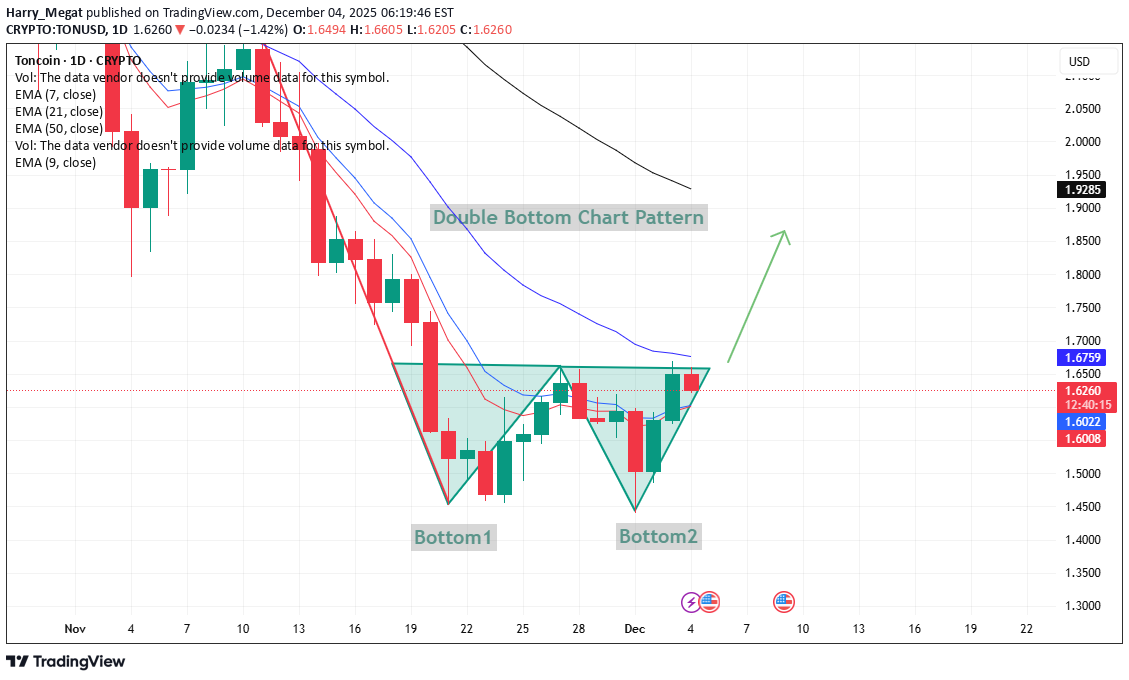
TONUSD – Double Bottom Formation (Neutral Technical View) The chart shows a double bottom structure, where price formed two lows (Bottom 1 and Bottom 2) near the same zone. This is generally watched as a potential reversal signal when price moves back toward the neckline. Key observations: Bottom 1 and Bottom 2 highlight buyers defending the same support area. Price is now approaching the neckline zone around 1.65–1.67, which is an important technical barrier. If candles can hold above the short-term EMAs (9 and 21), it strengthens the idea of momentum shifting upward. A close above the neckline would indicate continuation toward higher resistance levels, while rejection could keep the pair in consolidation. https://www.tradingview.com/x/HmJnmIC0/
Harry_Megat
الگوی پرچم صعودی بیت کوین در تایم فریم 4 ساعته: آیا رالی ادامه دارد؟
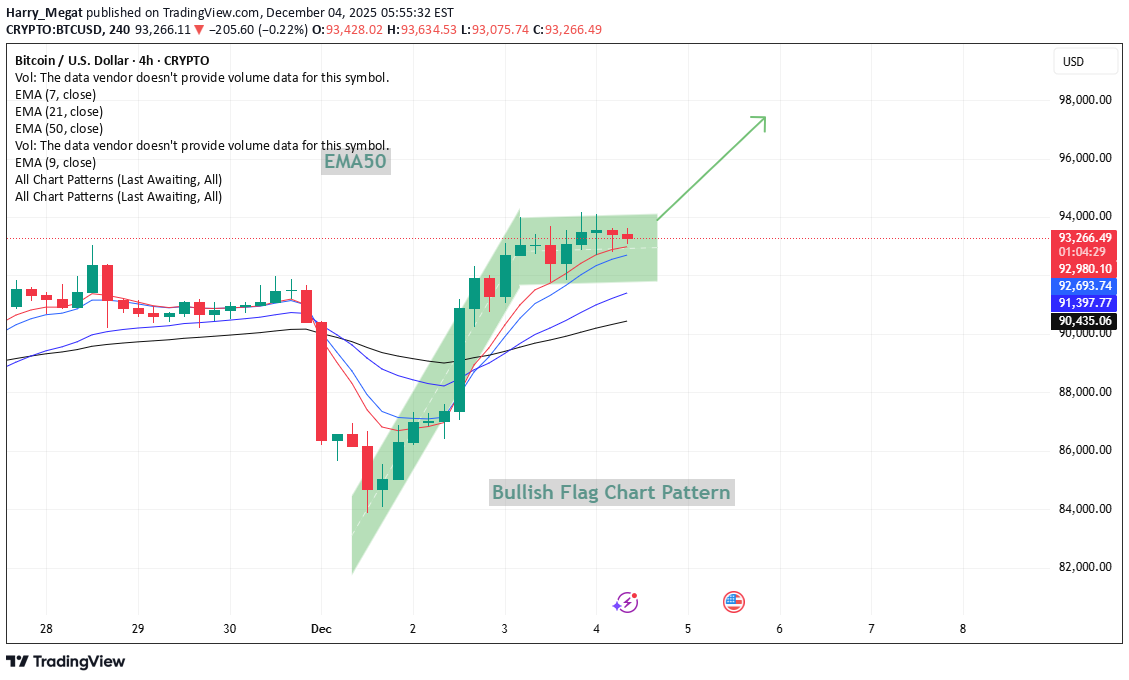
Bitcoin’s 4-hour chart is showing a period of consolidation following a strong upward movement. The recent rally created a steep impulse leg, and price is now moving within a compact range that resembles a bullish flag–type structure. This type of structure often appears when the market is taking a pause after increased momentum. Several moving averages (EMA 7/21/50) are positioned below the current price, indicating that short-term trend conditions continue to lean on the supportive side. Price is holding above these EMAs while staying inside the consolidation zone. If price continues to maintain support near this range, traders will often watch for a potential continuation scenario. On the other hand, if the market slips below the lower boundary, it may signal that the consolidation phase is extending or losing momentum. This idea focuses on illustrating the pattern and highlighting how price is interacting with the EMAs, without suggesting any specific trading action. https://www.tradingview.com/x/Q31zW04Q/
Harry_Megat
تحلیل اجمالی اتریوم (ETH) در ۱۵ دقیقه: رمزگشایی مثلث متقارن برای ورود به معامله!
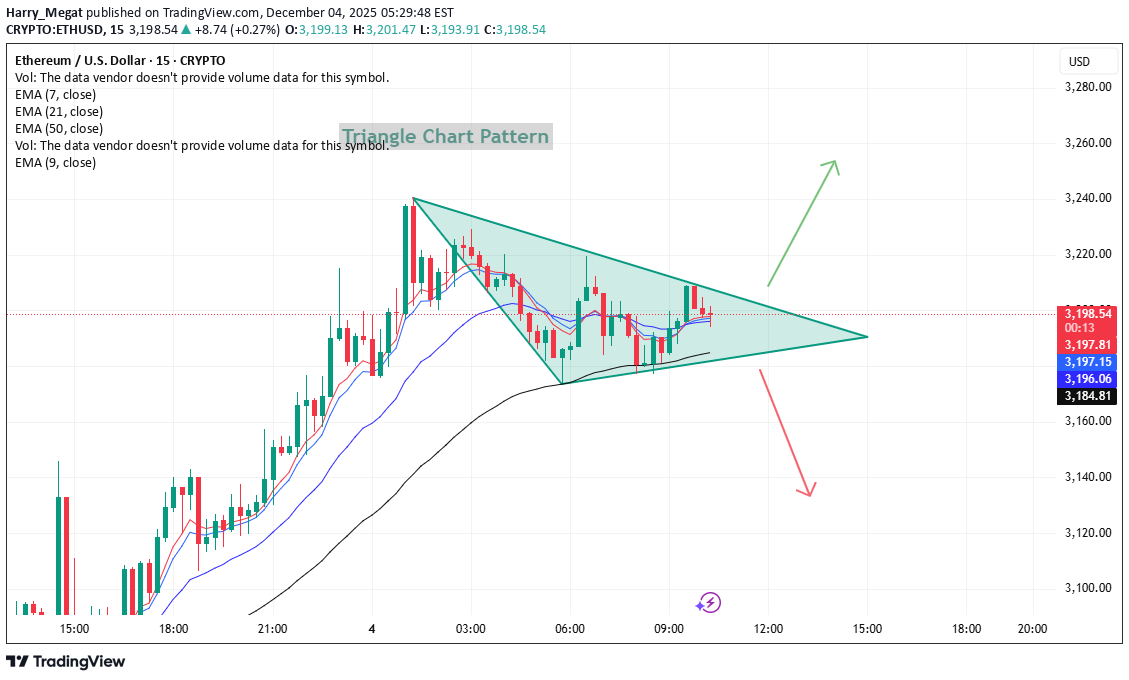
ETH 15m Analysis – Symmetrical Triangle Price is consolidating inside a symmetrical triangle, showing lower highs and higher lows. This pattern usually leads to a directional breakout, and the breakout decides the next move. EMAs (7/21/50) are close together, showing momentum compression before expansion. ✅ 📈 Long Setup (Bullish Breakout) A long setup becomes valid if price breaks above the triangle resistance with a candle close. 🔺 Long Entry Buy above: 3208–3210 🎯 Targets TP1: 3225 TP2: 3240 TP3: 3260 🛑 Stop-Loss SL below breakout: 3192 Reasoning: A breakout above the triangle indicates renewed bullish momentum with EMAs supporting an upward push. ✅ 📉 Short Setup (Bearish Breakdown) A short setup becomes valid if price breaks below triangle support. 🔻 Sell Entry Sell below: 3180–3178 🎯 Targets TP1: 3160 TP2: 3145 TP3: 3125 🛑 Stop-Loss SL above broken support: 3195 Reasoning: A break below the lower trendline signals sellers taking control, likely pulling price back toward EMA50 or lower. 📌 Summary ETH is squeezing inside a symmetrical triangle. Volume contraction confirms the compression phase. Break above = bullish continuation. Break below = bearish correction. https://www.tradingview.com/x/tYOoa37P/
Harry_Megat
تحلیل سرنوشت اتریوم (ETH/USD): ساختار سقف دوتایی و خط گردن حیاتی (تایم فریم 15 دقیقهای)
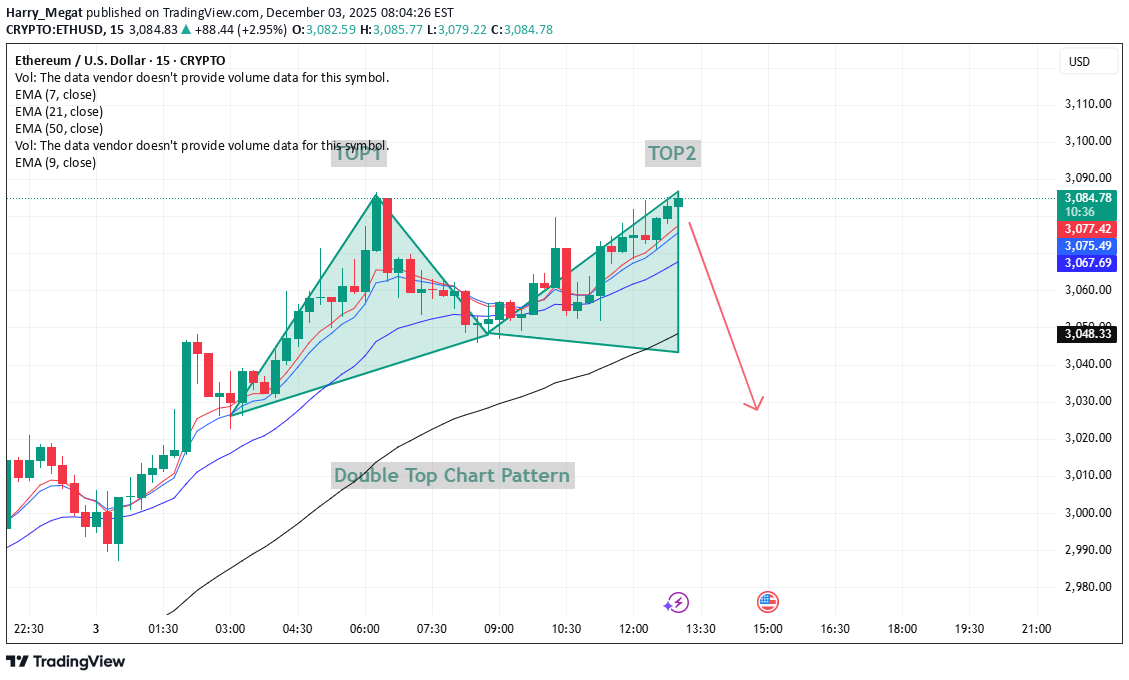
📌 Neutral Price-Action Analysis (ETH/USD – 15M) 1. Double-Top Structure The chart highlights a double-top pattern, formed by two peaks around the 3084–3087 area: TOP 1: Price reached approximately 3084 before pulling back. TOP 2: Price returned to the same region near 3087, creating the second high. This shows that price struggled to break above this zone on two attempts. 2. Neckline Zone The lower boundary of the pattern sits near the 3060–3065 area, where price previously found temporary support. This level acts as the midpoint of the structure. 3. EMA Context The EMA 7, 9, and 21 are closely stacked under price, showing short-term momentum earlier in the move. ETH is currently trading just above these EMAs but showing hesitation near the double-top resistance. The EMA 50 at approximately 3048 sits below as a deeper support reference. 4. Price Reaction After touching the second top near 3087, the latest candles show rejection from this zone, indicating reduced strength as price interacts with resistance. The red arrow on the chart simply illustrates a possible continuation idea based on the structure, not a signal. 5. Summary ETH reached the 3084–3087 resistance area twice, forming a double-top pattern on the 15-minute chart. Price is now showing rejection from this zone while holding above the 3060–3065 neckline region, with the EMA 50 near 3048 acting as a broader support reference. https://www.tradingview.com/x/7vEZ4ipP/ETH showed a completed double-top pattern, with price reacting from the 3080 zone and moving down toward the 3035 area. This move followed the structure already visible on the chart, where the neckline around 3060 was breached and price continued to the lower zone. The chart development is now complete for that pattern.close
Harry_Megat
تحلیل بیت کوین ۱۵ دقیقهای: راز الگوی گُوِه نزولی و احتمال انفجار قیمتی!
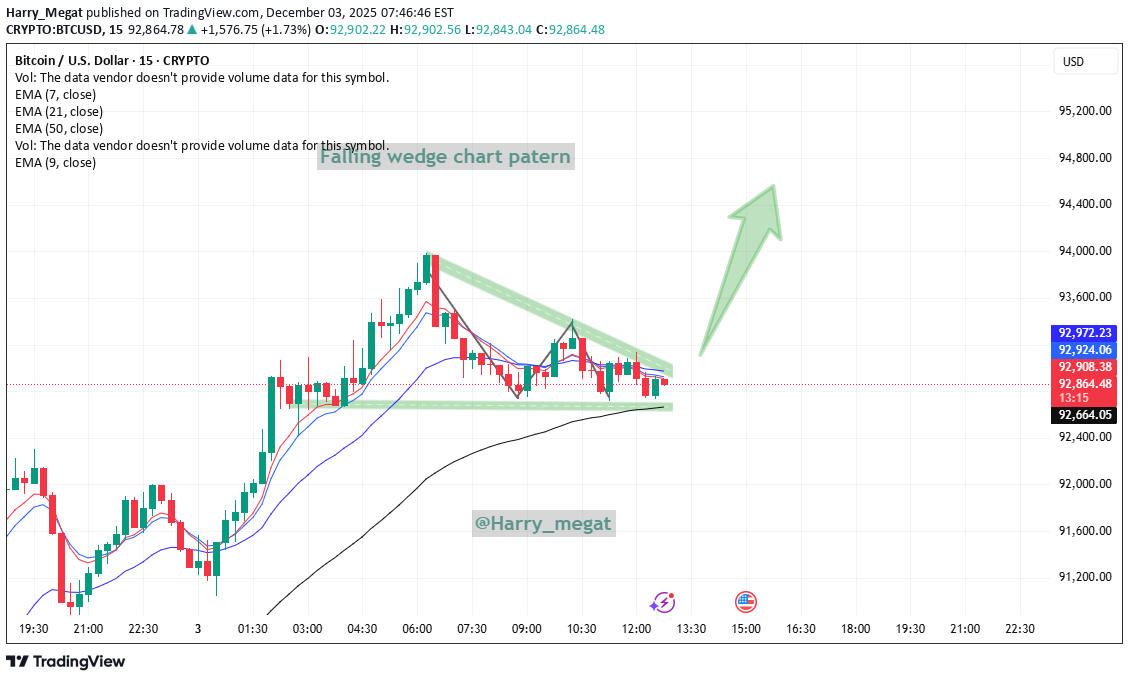
📊 BTC 15m Analysis — Falling Wedge Pattern Bitcoin is trading around $92,870 – $92,920 and forming a falling wedge, which is typically a bullish reversal pattern. 1️⃣ Support Zone Support sits near $92,750 – $92,800. Price has bounced from this area multiple times, showing buyers are active here. 2️⃣ Falling Wedge Structure Lower highs and higher lows are squeezing price inside the wedge. This usually indicates weakening selling pressure and potential breakout to the upside. 3️⃣ Breakout Conditions A strong bullish move can form if BTC breaks above the wedge resistance, around: 👉 $93,000 – $93,100 A breakout and hold above this zone may trigger a push toward higher levels. 4️⃣ Bearish Risk If price breaks below support at $92,750, the pattern invalidates and BTC may drop further. Summary Pattern: Falling wedge (bullish setup) Support: $92,750 Resistance: $93,000 – $93,100 Watching for breakout above resistance or breakdown below support. https://www.tradingview.com/x/hMNuLwV8/Trade closed — the setup didn’t play out as expected. No clear follow-through, so stepping aside and waiting for the next clean opportunity.close
Harry_Megat
تحلیل 30 دقیقهای اتریوم: آیا قیمت در این منطقه حیاتی گیر کرده است؟
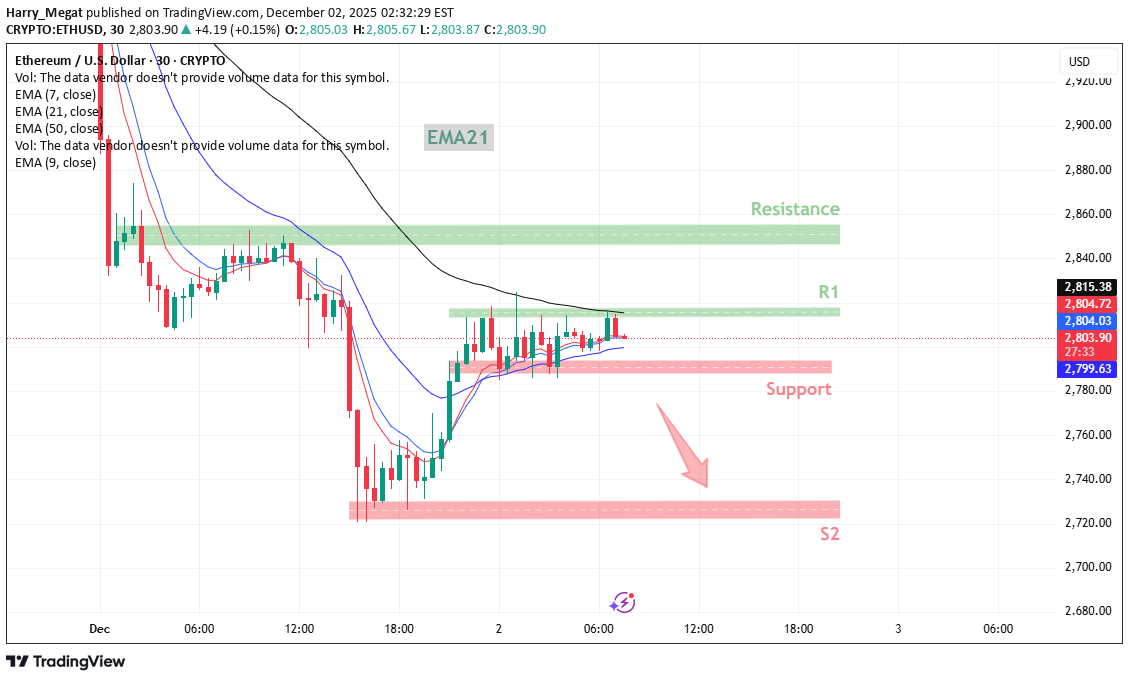
Neutral Chart Interpretation https://www.tradingview.com/x/4GPu893u/ This chart shows ETH/USD on the 30-minute timeframe, with focus on how price is reacting around moving averages and key zones. 1. Price Near Short-Term Compression ETH is moving sideways close to the EMA 7, EMA 9, and EMA 21. This clustering of EMAs usually reflects reduced volatility and a short-term indecision zone. 2. Immediate Resistance (R1) A small green zone (R1) marks the first area where price previously reacted. Price is testing this zone again, suggesting that this is an area where sellers have shown interest before. 3. Higher Resistance Zone A larger green resistance zone is placed above R1. This area reflects a bigger supply region where price may face additional difficulty continuing upward. 4. Support Zone Below Current Price A red support region is highlighted under the EMAs. This shows the nearest area where ETH previously stabilized after downward movement. 5. Lower Support (S2) A deeper support zone is marked further below. This is a broader area where price experienced a strong reaction earlier, possibly indicating stronger interest from buyers. 6. EMA21 Trend Context The EMA21 (black line) is trending downward and still positioned above price. This suggests the broader timeframe is still recovering from prior weakness.ETH/USD continued its upward movement and moved through both marked resistance zones, reaching the 2,970 area. This shows how price reacted once it cleared those structure levels.closed
Harry_Megat
تحلیل خنثی بیت کوین (BTC/USD) در تایم فریم 15 دقیقهای: حمایتها و سناریوی صعودی محتمل
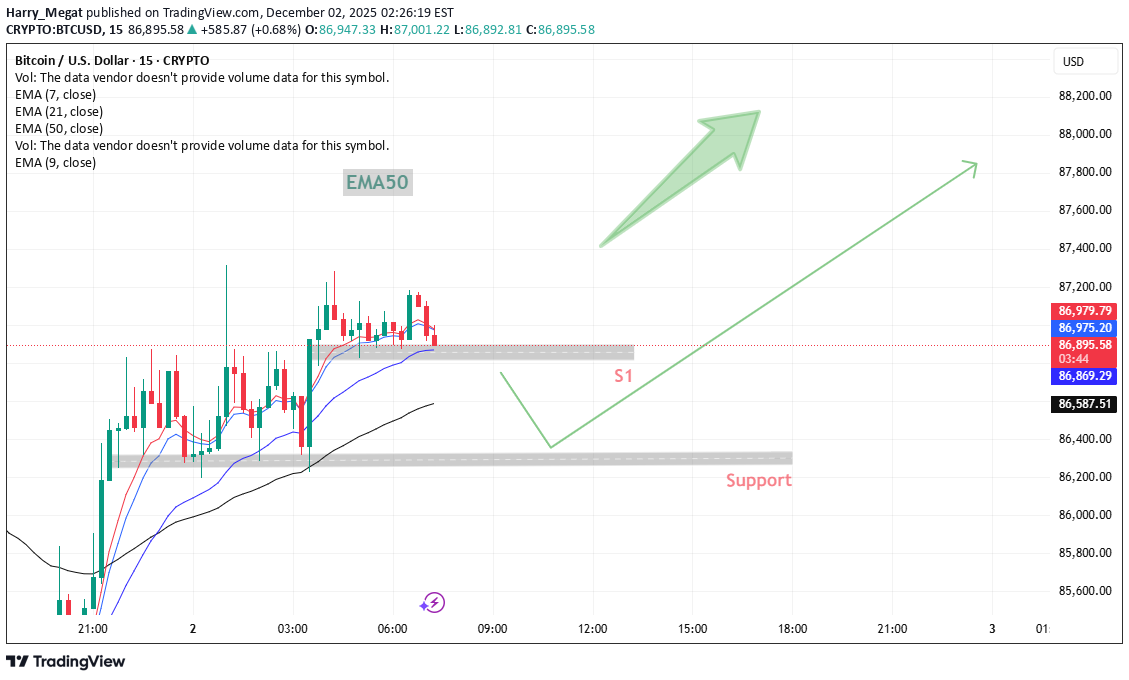
Neutral Chart Interpretation This chart shows BTC/USD on the 15-minute timeframe, using several Exponential Moving Averages (EMA 7, 21, 50, and 9). The main focus appears to be on potential support zones and how price might behave around them. 1. Current Price Area The price is moving sideways near the EMAs. Multiple EMAs are close together, showing a short-term consolidation phase. 2. First Support Zone (S1) A grey box highlights a nearby support area just below the current price. The chart suggests that if price dips into this zone, it may stabilize before attempting another upward move. 3. Second (Stronger) Support Zone A wider support region is marked lower on the chart. This level appears to act as a stronger cushion if the market experiences a deeper pullback. 4. Upward Scenario (Green Arrows) The chart shows an illustrated potential path where the price could rebound from one of the support zones and continue moving upward. These arrows simply represent possible movement — not a prediction or signal. 5. EMA50 Highlight The EMA50 label suggests that this moving average is being watched as a dynamic support during pullbacks. Safe Posting Notes This explanation avoids giving trade signals or recommendations. It sticks to neutral chart interpretation only: price levels, zones, and market structure. https://www.tradingview.com/x/4UqCKpIf/Neutral Rewording The previously outlined bullish scenario on BTC has played out, with price moving up toward the 89,200 zone. This reflects how the market followed the earlier structure and momentum discussed on the chart.closed
Harry_Megat
بیت کوین در حمایت قوی: آیا رالی صعودی آغاز میشود یا سقوط ادامه مییابد؟
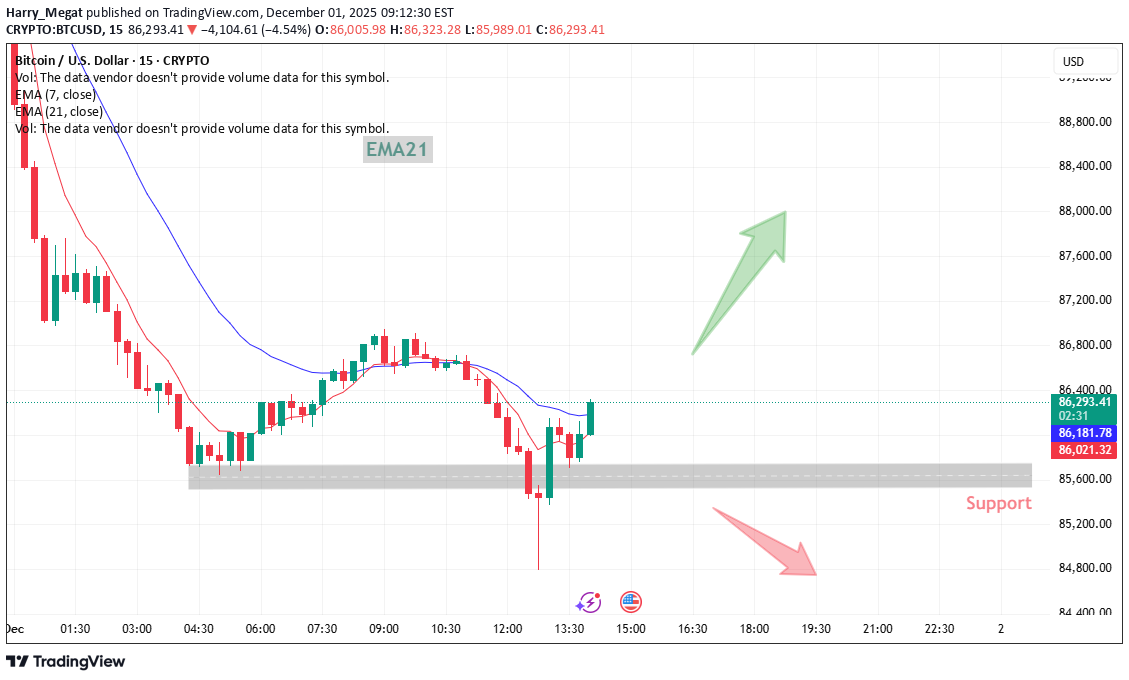
BTCUSD (15m) – Support Rejection & EMA Recovery Bitcoin dropped into a key support zone and showed a strong rejection wick, signaling buyer interest. Price has now pushed back above the 7 EMA and is challenging the 21 EMA, which is the first sign of short-term momentum shifting. Two possible outcomes from this area: 1. Bullish Scenario (Green Path) If BTC holds above the support zone and continues reclaiming the EMAs, price may look for a short-term recovery toward the next intraday highs. 2. Bearish Scenario (Red Path) If price fails at the EMAs and falls back below the support zone, continuation to the downside becomes more likely. Summary Strong support reaction. EMAs acting as early momentum indicators. Both bounce and breakdown are possible depending on how price behaves around 21 EMA. https://www.tradingview.com/x/ZBXD99Qq/📊 BTC Update — Break, Sweep, Reclaim Bitcoin broke support, flushed down to $84,000, and then reclaimed the $86,700 resistance — a classic liquidity sweep + bullish reclaim pattern. What This Price Action Means: 1️⃣ Liquidity Grab at $84,000 Price dipped below support to hunt stops/liquidity, then buyers stepped in aggressively. This is often a bullish signal if the level is quickly reclaimed. 2️⃣ Strong Reclaim of $86,700 BTC pushing back above $86,700 shows: Sellers failed to continue the breakdown Buyers regained control Market sentiment shifting bullish again 3️⃣ This Structure Is Bullish A break → sweep → reclaim pattern usually suggests continuation to the upside as long as price stays above the reclaimed level. Key Levels Now Support: $86,700 (must hold to keep bullish structure) Next Bullish Targets: • $88,500 • $90,000 • $92,000 (major liquidity pocket)
Harry_Megat
تحلیل روزانه بیت کوین (BTC/USD): استراتژی معاملاتی دقیق با نقاط ورود و خروج مشخص!
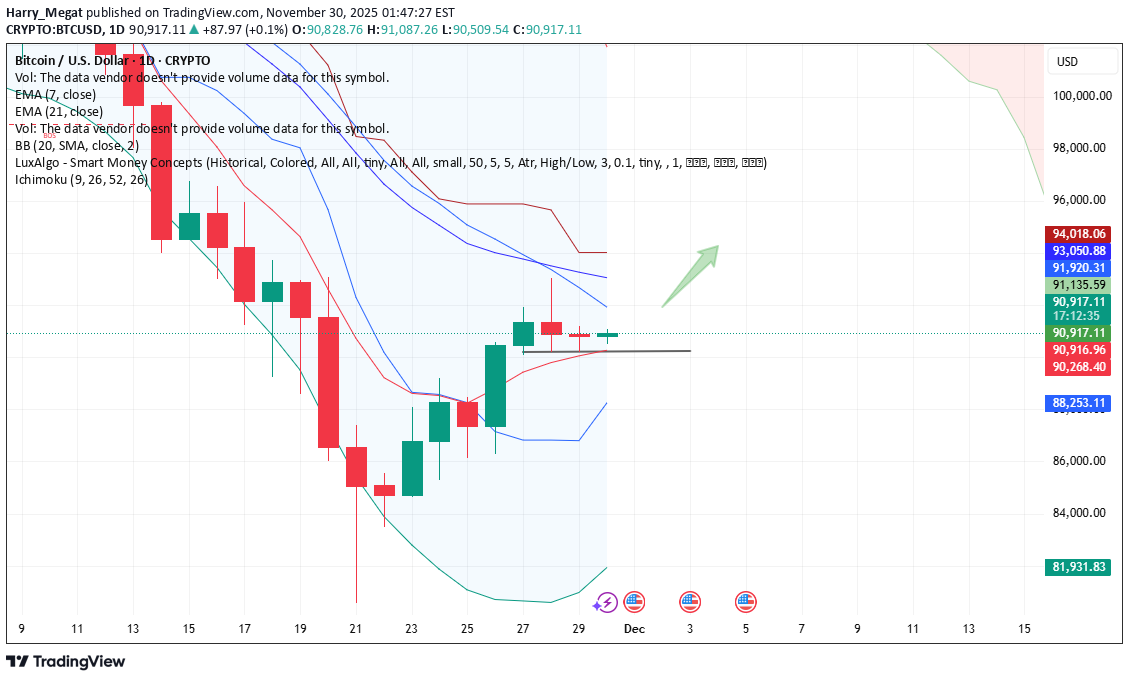
✅ BTC/USD – Clean Trading Setup (1D) 1. Market Structure Trend recently turned short-term bullish (green candles) Long-term trend still mixed because EMAs are above price Doji candle shows indecision near resistance --- 🔥 2. Key Levels Resistance: 91,135 (very important) 93,051 94,018 Support: 90,269 89,800 88,253 (BB lower – strong support) --- 📈 3. Buy (Long) Setup Use only if daily candle closes above 91,135. Entry: 👉 91,200 – 91,300 Targets (TP): 92,500 93,500 94,200 Stop-loss: 👉 89,800 Reason: Break of resistance + close above Doji confirmation → continuation. --- 📉 4. Sell (Short) Setup Use only if daily candle closes below 90,269. Entry: 👉 90,200 – 90,000 Targets (TP): 89,200 88,500 88,000 Stop-loss: 👉 91,400 Reason: Rejection from resistance + Doji weakness → pullback. --- ⚠️ 5. Important Notice The Doji means the next candle decides the direction. Bullish close → BTC moves upward Bearish close → BTC pulls back to 89–88kBTC 91,600 hit 🎯🔥 This is a bullish sign, especially after breaking above the resistance zone around 91,135. ✅ What this move means: Buyers are in control Breakout confirmation is getting stronger Next upside targets remain the same: Next Targets 92,500 93,500 94,200 ⚠️ Watch this: If BTC stays above 91,135, bullish continuation is strong. If it falls back below 91,135, then it becomes a fake breakoutclosed
Harry_Megat
Ethereum (ETH/USD) Technical Insights
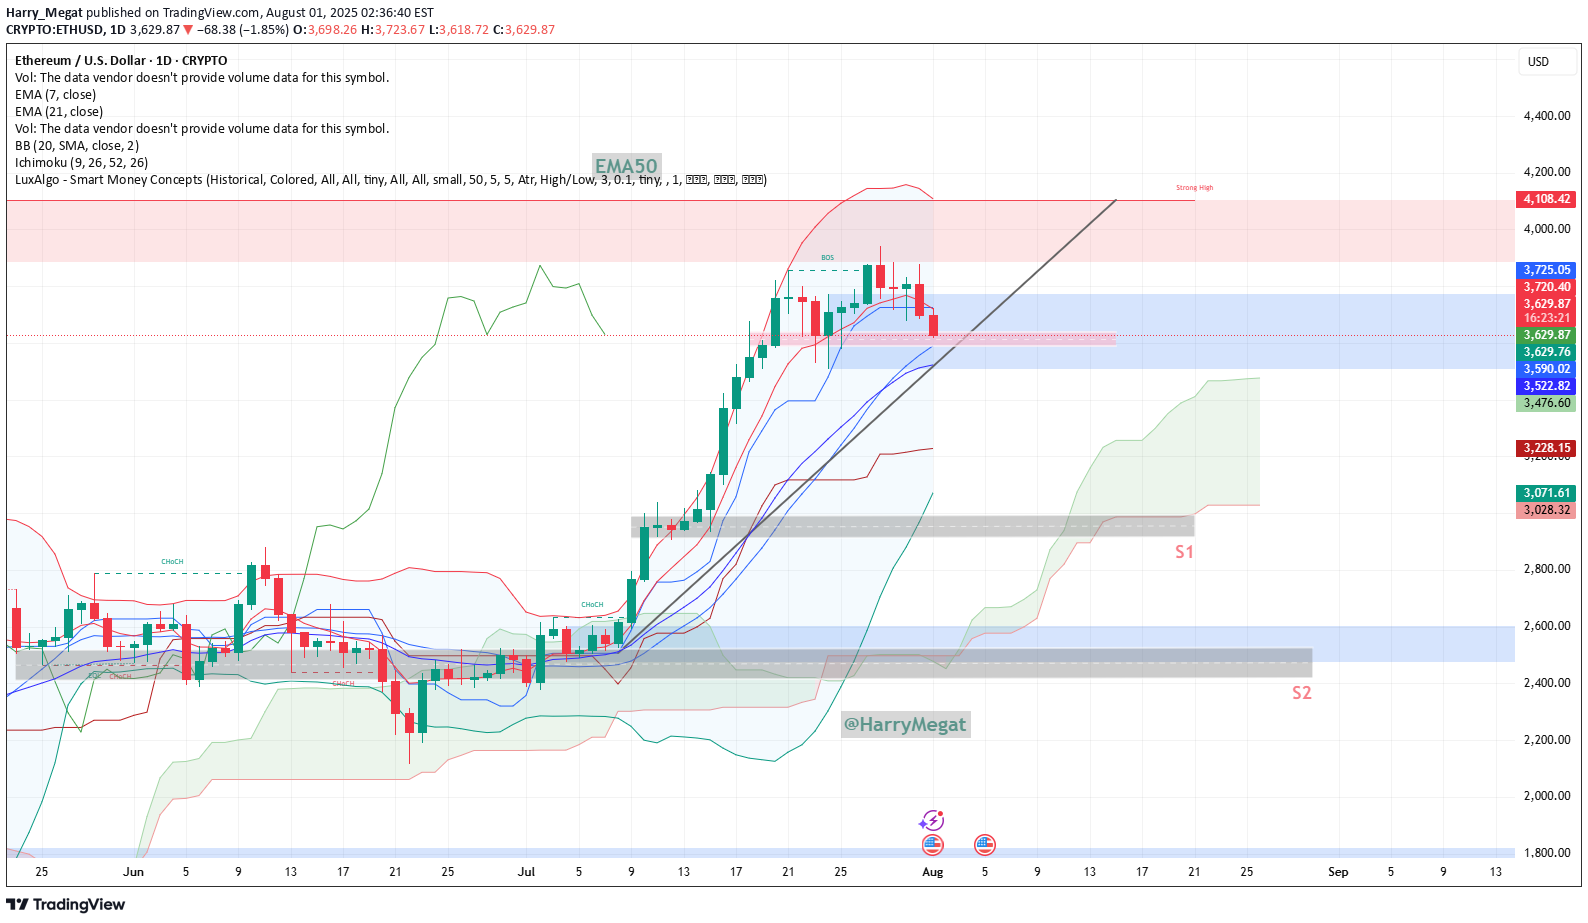
Ethereum (ETH/USD) Technical Insights **Chart Overview** * **Current Price**: \~\$3,631 * **EMA 7 (Red Line)**: \$3,720.80 * **EMA 21 (Blue Line)**: \$3,522.96 * **Key Support Zone (Pink area)**: \~\$3,600–\$3,650 * **Support 1 (S1)**: \~\$2,950 * **Support 2 (S2)**: \~\$2,500 * **Uptrend Line**: Still intact, but under pressure **Technical Insights** * **Price Breakdown**: ETH has dropped below the **EMA 7**, and is now testing a **critical horizontal support zone** around **\$3,600–\$3,650**. * **Trendline**: Still holds, but ETH is **hovering just above it**, signaling a potential bounce or breakdown. * **EMA 21** near \$3,522 is the next short-term support if \$3,600 fails. * **Momentum**: Recent candles show **strong selling**, indicating weakness, but no full breakdown yet. **Bullish Scenario** *Conditions**: * Price **holds above** \$3,600–\$3,620 zone and the **trendline** * **Bounce** with bullish daily candle from current zone or above \$3,650 **Buy Setup**: * **Entry**: \$3,620–\$3,650 on confirmation * **Stop-loss**: Below \$3,520 (just under EMA 21) * **Targets**: * TP1: \$3,720 (reclaim EMA 7) * TP2: \$3,850–\$3,940 * TP3: \$4,100+ **Bearish Scenario** **Conditions**: * Price **breaks below** \$3,600 and **the trendline** * EMA 21 is lost with strong bearish candle **Sell Setup**: * **Entry**: Below \$3,580 on breakdown * **Stop-loss**: Above \$3,650 * **Targets**: * TP1: \$3,520 (EMA 21) * TP2: \$2,950 (S1) * TP3: \$2,500 (S2) **Bias: Neutral with Bearish Lean** * **Decision Zone**: ETH is at a key inflection point * Wait for **confirmation**: bounce or breakdown before entering
Disclaimer
Any content and materials included in Sahmeto's website and official communication channels are a compilation of personal opinions and analyses and are not binding. They do not constitute any recommendation for buying, selling, entering or exiting the stock market and cryptocurrency market. Also, all news and analyses included in the website and channels are merely republished information from official and unofficial domestic and foreign sources, and it is obvious that users of the said content are responsible for following up and ensuring the authenticity and accuracy of the materials. Therefore, while disclaiming responsibility, it is declared that the responsibility for any decision-making, action, and potential profit and loss in the capital market and cryptocurrency market lies with the trader.