Technical analysis by Harry_Megat about Symbol BTC: Buy recommendation (11/30/2025)
Harry_Megat
تحلیل روزانه بیت کوین (BTC/USD): استراتژی معاملاتی دقیق با نقاط ورود و خروج مشخص!
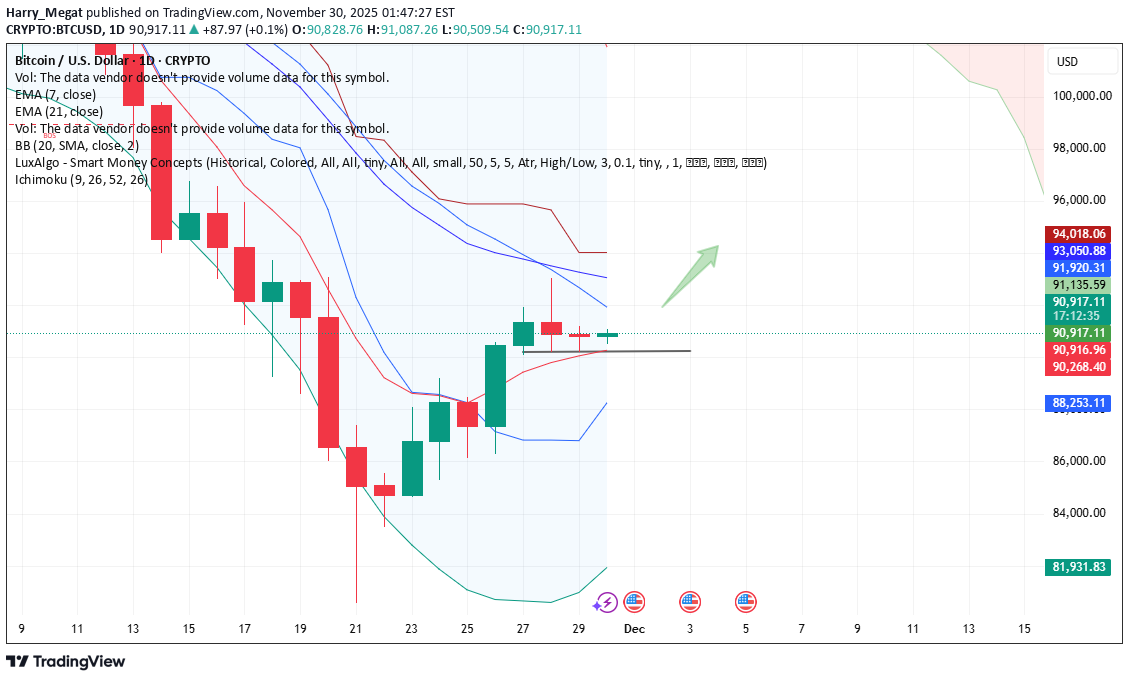
✅ BTC/USD – Clean Trading Setup (1D) 1. Market Structure Trend recently turned short-term bullish (green candles) Long-term trend still mixed because EMAs are above price Doji candle shows indecision near resistance --- 🔥 2. Key Levels Resistance: 91,135 (very important) 93,051 94,018 Support: 90,269 89,800 88,253 (BB lower – strong support) --- 📈 3. Buy (Long) Setup Use only if daily candle closes above 91,135. Entry: 👉 91,200 – 91,300 Targets (TP): 92,500 93,500 94,200 Stop-loss: 👉 89,800 Reason: Break of resistance + close above Doji confirmation → continuation. --- 📉 4. Sell (Short) Setup Use only if daily candle closes below 90,269. Entry: 👉 90,200 – 90,000 Targets (TP): 89,200 88,500 88,000 Stop-loss: 👉 91,400 Reason: Rejection from resistance + Doji weakness → pullback. --- ⚠️ 5. Important Notice The Doji means the next candle decides the direction. Bullish close → BTC moves upward Bearish close → BTC pulls back to 89–88kBTC 91,600 hit 🎯🔥 This is a bullish sign, especially after breaking above the resistance zone around 91,135. ✅ What this move means: Buyers are in control Breakout confirmation is getting stronger Next upside targets remain the same: Next Targets 92,500 93,500 94,200 ⚠️ Watch this: If BTC stays above 91,135, bullish continuation is strong. If it falls back below 91,135, then it becomes a fake breakoutclosed