Technical analysis by Harry_Megat about Symbol ETH on 12/4/2025
Harry_Megat
تحلیل اجمالی اتریوم (ETH) در ۱۵ دقیقه: رمزگشایی مثلث متقارن برای ورود به معامله!
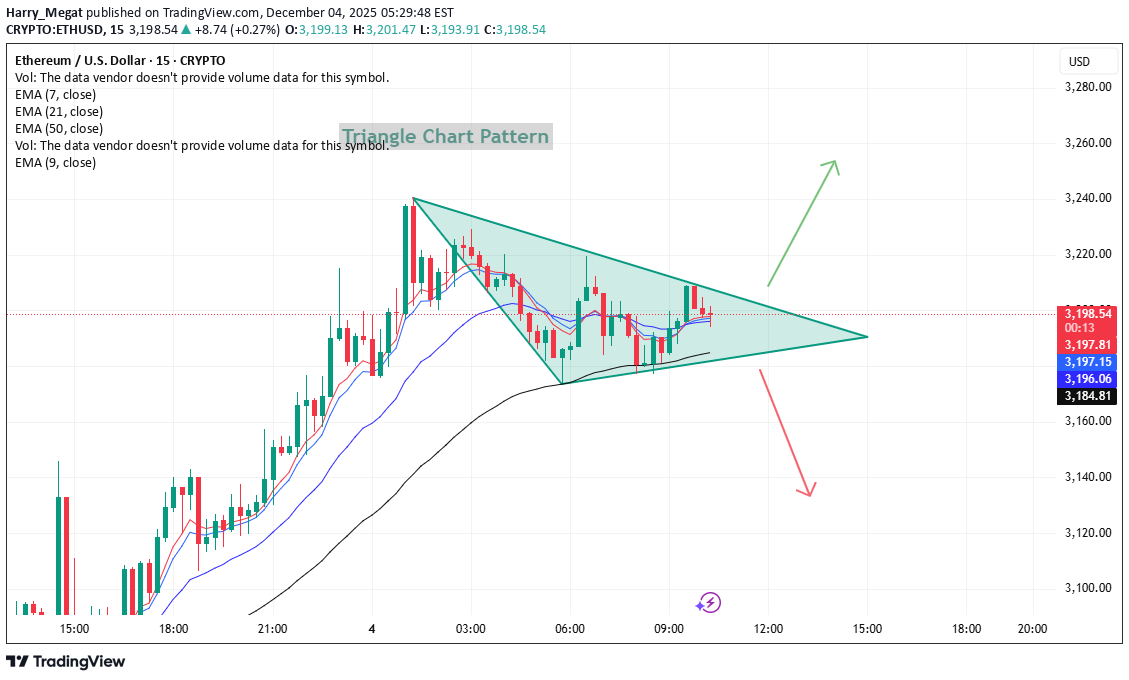
ETH 15m Analysis – Symmetrical Triangle Price is consolidating inside a symmetrical triangle, showing lower highs and higher lows. This pattern usually leads to a directional breakout, and the breakout decides the next move. EMAs (7/21/50) are close together, showing momentum compression before expansion. ✅ 📈 Long Setup (Bullish Breakout) A long setup becomes valid if price breaks above the triangle resistance with a candle close. 🔺 Long Entry Buy above: 3208–3210 🎯 Targets TP1: 3225 TP2: 3240 TP3: 3260 🛑 Stop-Loss SL below breakout: 3192 Reasoning: A breakout above the triangle indicates renewed bullish momentum with EMAs supporting an upward push. ✅ 📉 Short Setup (Bearish Breakdown) A short setup becomes valid if price breaks below triangle support. 🔻 Sell Entry Sell below: 3180–3178 🎯 Targets TP1: 3160 TP2: 3145 TP3: 3125 🛑 Stop-Loss SL above broken support: 3195 Reasoning: A break below the lower trendline signals sellers taking control, likely pulling price back toward EMA50 or lower. 📌 Summary ETH is squeezing inside a symmetrical triangle. Volume contraction confirms the compression phase. Break above = bullish continuation. Break below = bearish correction. https://www.tradingview.com/x/tYOoa37P/