Technical analysis by Harry_Megat about Symbol BTC: Buy recommendation (12/2/2025)
Harry_Megat
تحلیل خنثی بیت کوین (BTC/USD) در تایم فریم 15 دقیقهای: حمایتها و سناریوی صعودی محتمل
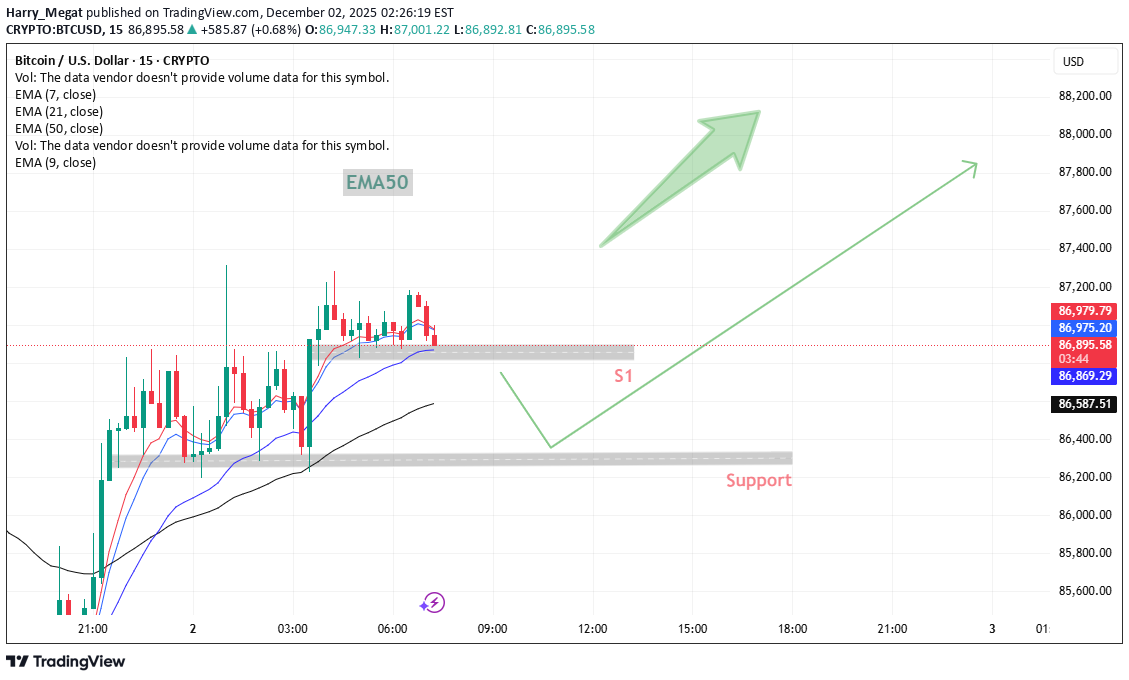
Neutral Chart Interpretation This chart shows BTC/USD on the 15-minute timeframe, using several Exponential Moving Averages (EMA 7, 21, 50, and 9). The main focus appears to be on potential support zones and how price might behave around them. 1. Current Price Area The price is moving sideways near the EMAs. Multiple EMAs are close together, showing a short-term consolidation phase. 2. First Support Zone (S1) A grey box highlights a nearby support area just below the current price. The chart suggests that if price dips into this zone, it may stabilize before attempting another upward move. 3. Second (Stronger) Support Zone A wider support region is marked lower on the chart. This level appears to act as a stronger cushion if the market experiences a deeper pullback. 4. Upward Scenario (Green Arrows) The chart shows an illustrated potential path where the price could rebound from one of the support zones and continue moving upward. These arrows simply represent possible movement — not a prediction or signal. 5. EMA50 Highlight The EMA50 label suggests that this moving average is being watched as a dynamic support during pullbacks. Safe Posting Notes This explanation avoids giving trade signals or recommendations. It sticks to neutral chart interpretation only: price levels, zones, and market structure. https://www.tradingview.com/x/4UqCKpIf/Neutral Rewording The previously outlined bullish scenario on BTC has played out, with price moving up toward the 89,200 zone. This reflects how the market followed the earlier structure and momentum discussed on the chart.closed