Technical analysis by Harry_Megat about Symbol BTC: Buy recommendation (12/3/2025)

Harry_Megat
تحلیل بیت کوین ۱۵ دقیقهای: راز الگوی گُوِه نزولی و احتمال انفجار قیمتی!
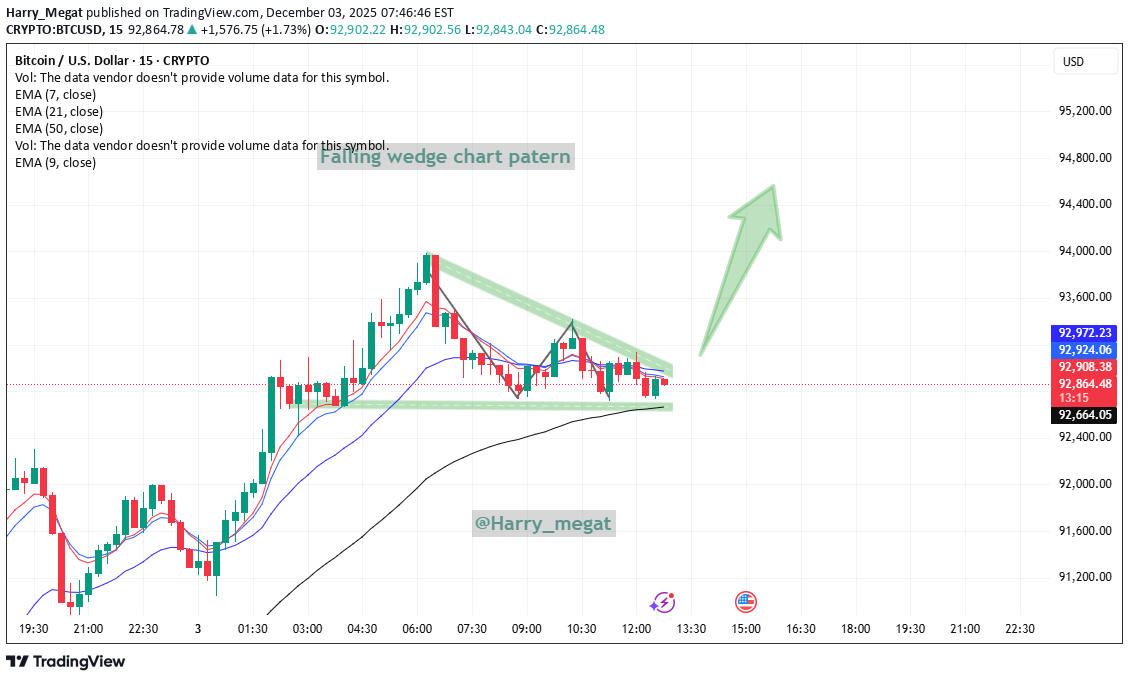
📊 BTC 15m Analysis — Falling Wedge Pattern Bitcoin is trading around $92,870 – $92,920 and forming a falling wedge, which is typically a bullish reversal pattern. 1️⃣ Support Zone Support sits near $92,750 – $92,800. Price has bounced from this area multiple times, showing buyers are active here. 2️⃣ Falling Wedge Structure Lower highs and higher lows are squeezing price inside the wedge. This usually indicates weakening selling pressure and potential breakout to the upside. 3️⃣ Breakout Conditions A strong bullish move can form if BTC breaks above the wedge resistance, around: 👉 $93,000 – $93,100 A breakout and hold above this zone may trigger a push toward higher levels. 4️⃣ Bearish Risk If price breaks below support at $92,750, the pattern invalidates and BTC may drop further. Summary Pattern: Falling wedge (bullish setup) Support: $92,750 Resistance: $93,000 – $93,100 Watching for breakout above resistance or breakdown below support. https://www.tradingview.com/x/hMNuLwV8/Trade closed — the setup didn’t play out as expected. No clear follow-through, so stepping aside and waiting for the next clean opportunity.close