Technical analysis by Harry_Megat about Symbol ETH: Sell recommendation (12/2/2025)
Harry_Megat
تحلیل 30 دقیقهای اتریوم: آیا قیمت در این منطقه حیاتی گیر کرده است؟
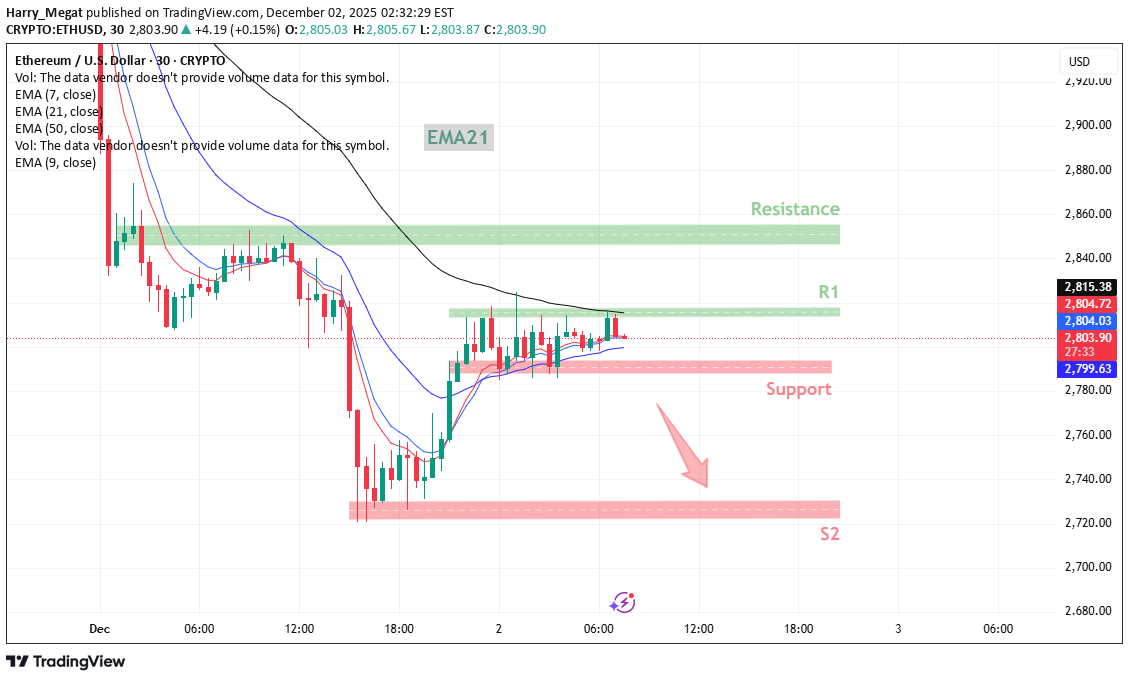
Neutral Chart Interpretation https://www.tradingview.com/x/4GPu893u/ This chart shows ETH/USD on the 30-minute timeframe, with focus on how price is reacting around moving averages and key zones. 1. Price Near Short-Term Compression ETH is moving sideways close to the EMA 7, EMA 9, and EMA 21. This clustering of EMAs usually reflects reduced volatility and a short-term indecision zone. 2. Immediate Resistance (R1) A small green zone (R1) marks the first area where price previously reacted. Price is testing this zone again, suggesting that this is an area where sellers have shown interest before. 3. Higher Resistance Zone A larger green resistance zone is placed above R1. This area reflects a bigger supply region where price may face additional difficulty continuing upward. 4. Support Zone Below Current Price A red support region is highlighted under the EMAs. This shows the nearest area where ETH previously stabilized after downward movement. 5. Lower Support (S2) A deeper support zone is marked further below. This is a broader area where price experienced a strong reaction earlier, possibly indicating stronger interest from buyers. 6. EMA21 Trend Context The EMA21 (black line) is trending downward and still positioned above price. This suggests the broader timeframe is still recovering from prior weakness.ETH/USD continued its upward movement and moved through both marked resistance zones, reaching the 2,970 area. This shows how price reacted once it cleared those structure levels.closed