
ForexGoldkinggg
@t_ForexGoldkinggg

What symbols does the trader recommend buying?
Purchase History
پیام های تریدر
Filter
ForexGoldkinggg
XAUUSD – SELL SETUP ANALYSIS (1H)
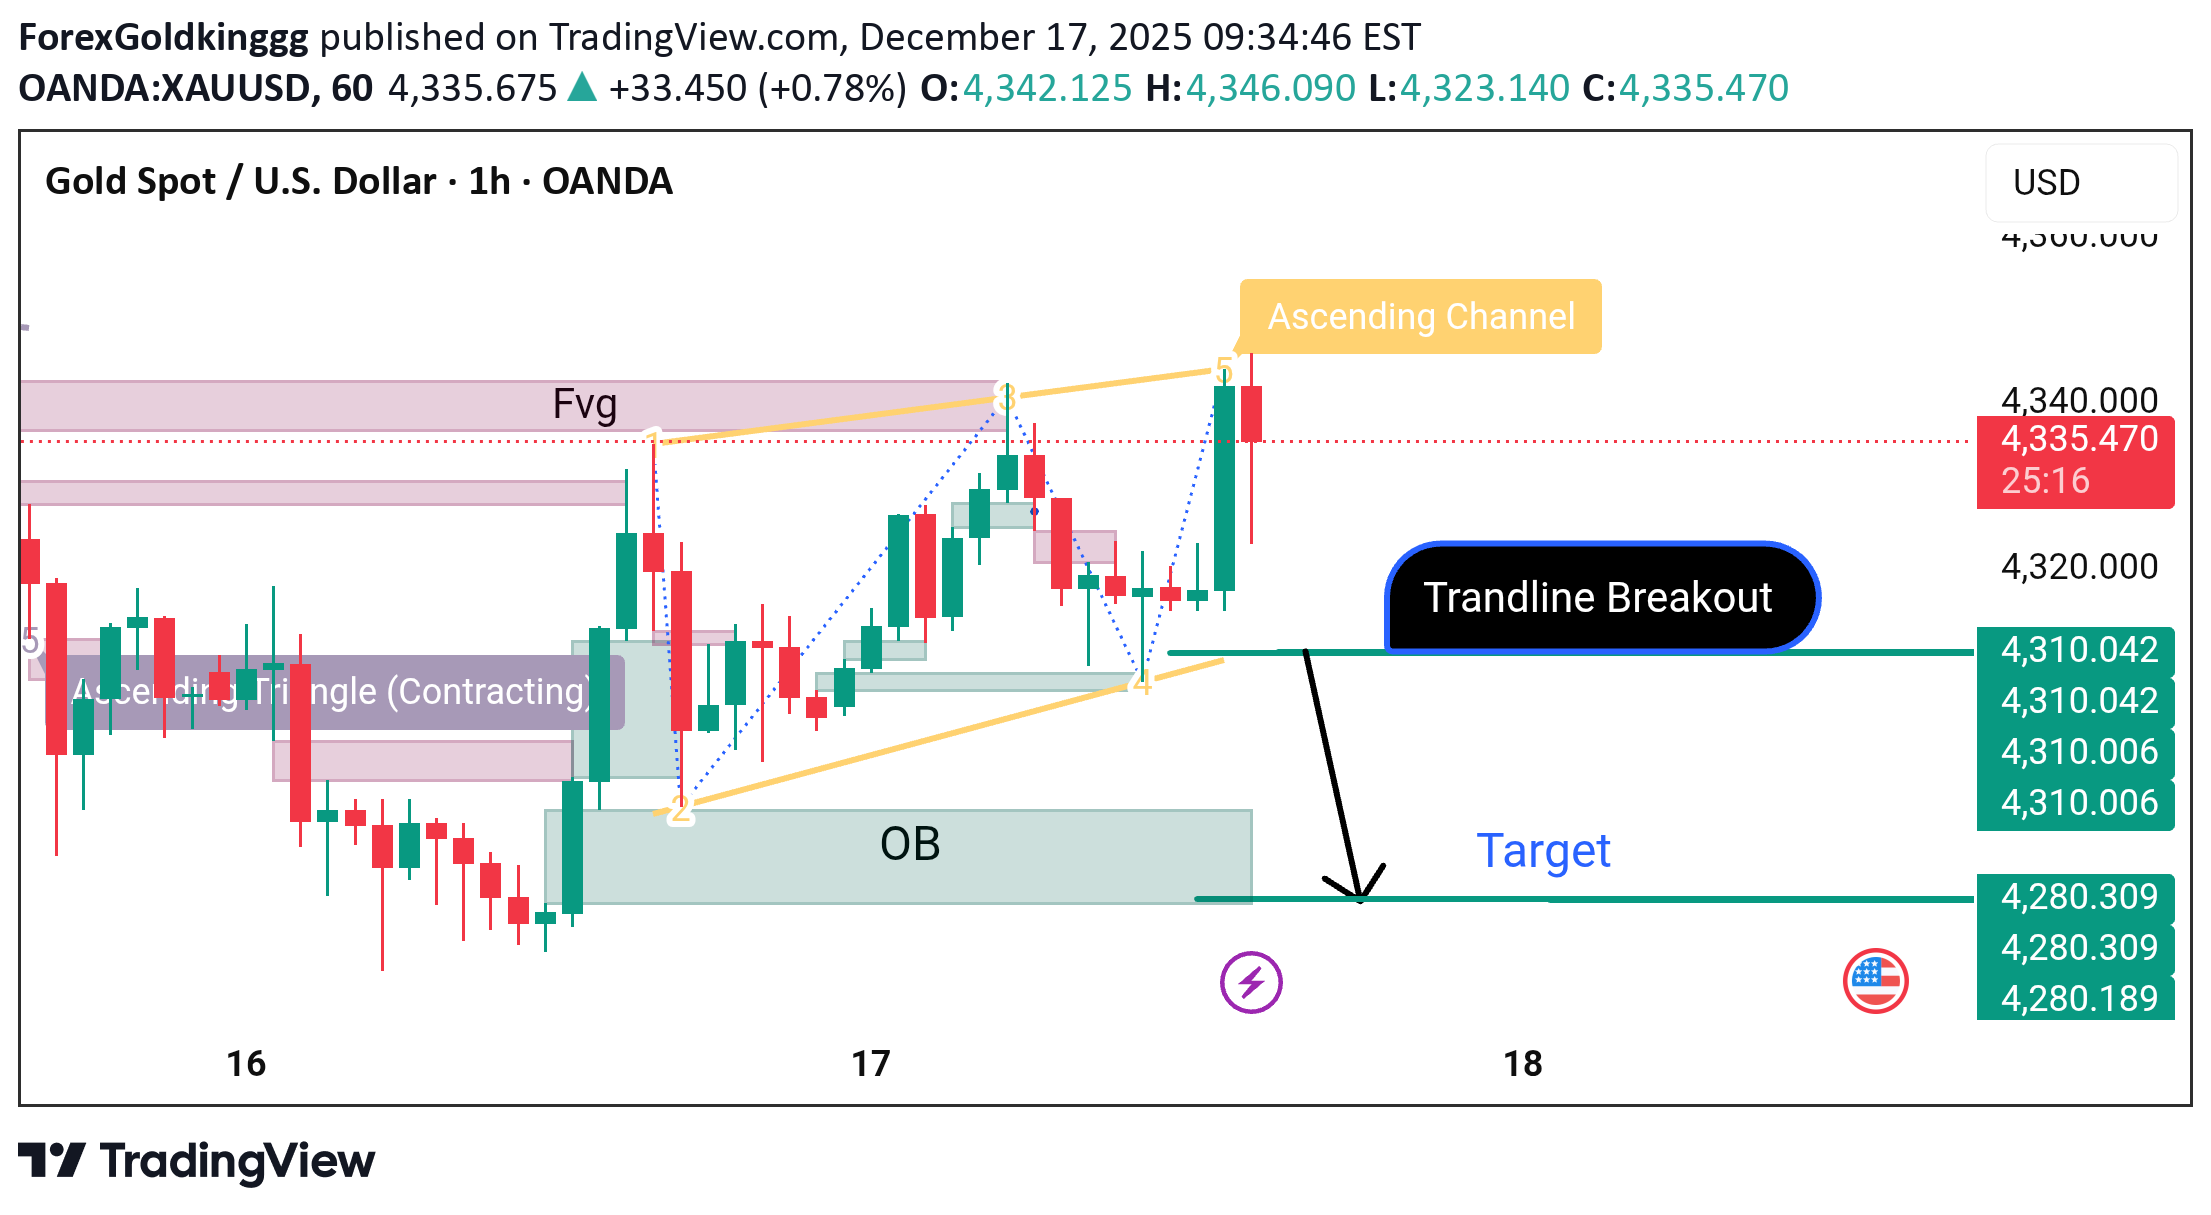
Hello Traders 🙋 Hope Everyone is Ok Let's Talk About our Chart 👇 📉 XAUUSD – SELL SETUP ANALYSIS (1H) 📉 Gold has shown a clear bearish signal after failing to hold above the ascending channel. 🔍 Technical Reasons: ▪️ Price was moving inside an ascending channel ▪️ Strong rejection from the channel top (4335–4340 resistance) ▪️ Bearish trendline breakout confirmed ▪️ Buyers lost momentum after FVG reaction ▪️ Smart money distribution seen above, now targeting lower liquidity 📦 Order Block Logic: Price failed to continue bullish from the OB, indicating sell pressure and possible OB mitigation below. 🎯 Targets: 🔹 First support: 4310 🔹 Main target: (4305) (4290) ( 4280) Liquidity + demand zone ⚠️ Bias: BEARISH As long as price stays below 4335, sell pressure remains strong. Bullish only if a strong close above resistance. 📊 Conclusion: Fake breakout up ➝ real move down. Trade with proper risk management. 📌 Gold doesn’t move randomly, it hunts liquidity. 🚀 Support the Idea! 👍 Like | 🔔 Follow | 💬 Comment | 🔁 Share Your engagement boosts visibility and helps our community stay strong. Share your own charts and setups in the comments — let’s analyse together!
ForexGoldkinggg
Analysis of BTCUSD 4H chart
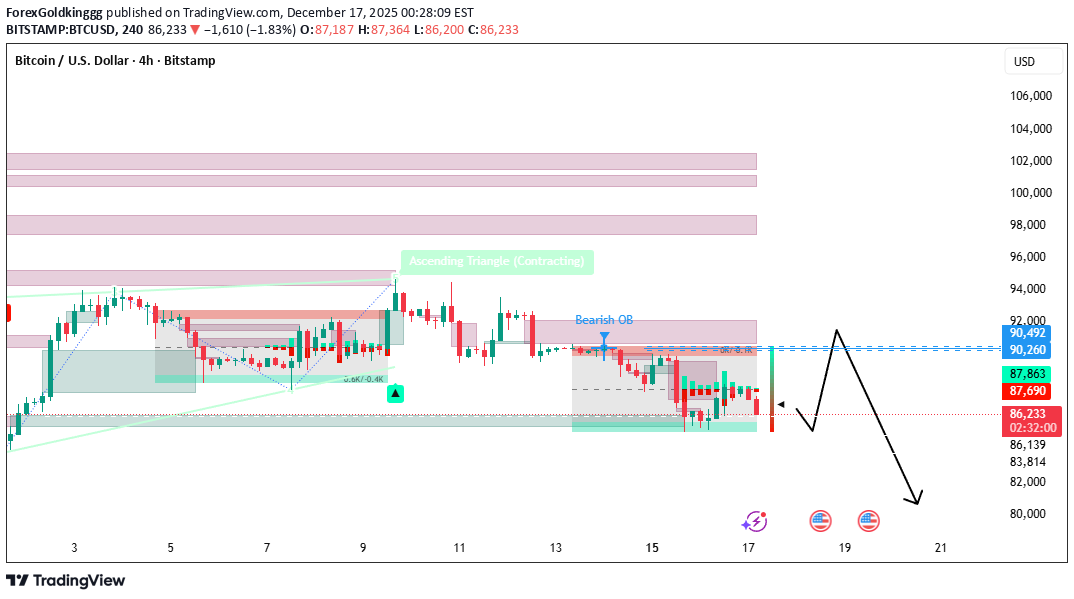
Hello Traders 🙋 Hope Everyone is Ok Let's Talk About our Chart 👇 🔎 Market Structure (4H) Bias: Bearish / distribution BTC failed to continue higher after the ascending triangle breakout Price is now below key structure, making lower highs Market is trading inside a bearish dealing range 📐 Key Technical Observations 1️⃣ Ascending Triangle (Failed Breakout) Breakout above ~94k lacked follow-through Classic bull trap Strong signal that smart money distributed into strength 2️⃣ Bearish Order Block (OB) Zone: ~90,200 – 90,500 Multiple rejections Price is currently respecting this OB This zone is now premium for shorts 3️⃣ Support / Demand Zone Local support: ~87,700 – 88,000 Price is reacting here, but: No strong bullish displacement Weak bounces → support likely to fail 🟥 Resistance Zones 90,200 – 90,500 (Major) 92,000 – 94,000 (Higher TF supply) As long as BTC stays below 90.5k, rallies are selling opportunities. 🟩 Support & Downside Targets If Support Breaks: 86,100 84,000 80,000 (Major HTF liquidity) Your projected path on the chart aligns perfectly with this structure. 📊 Trade Scenarios ✅ Primary Setup — Sell the Pullback (High Probability) Entry: 89,800 – 90,400 Stop Loss: Above 91,200 Targets: TP1: 88,000 TP2: 86,100 TP3: 84,000 TP4: 80,000 📉 Trend-following, structure-based short. ⚠️ Alternative — Breakdown Entry Entry: 4H close below 87,500 Stop Loss: Above 88,800 Targets: Same downside targets as above ❌ Bullish Invalidation 4H close above 92,000 Would reclaim OB and shift structure Until then → no swing longs 🧠 Smart Money Insight Liquidity above 94k already swept Now price is targeting sell-side liquidity Consolidation near support usually precedes expansion lower 📌 Summary ✔ Failed bullish pattern ✔ Strong bearish OB overhead ✔ Weak demand holding price ✔ Downside liquidity magnet below Bias: Sell rallies, not bottoms. 🚀 Support the Idea! 👍 Like | 🔔 Follow | 💬 Comment | 🔁 Share Your engagement boosts visibility and helps our community stay strong. Share your own charts and setups in the comments — let’s analyse together!
ForexGoldkinggg
Technical analysis of XAUUSD (Gold) 1H
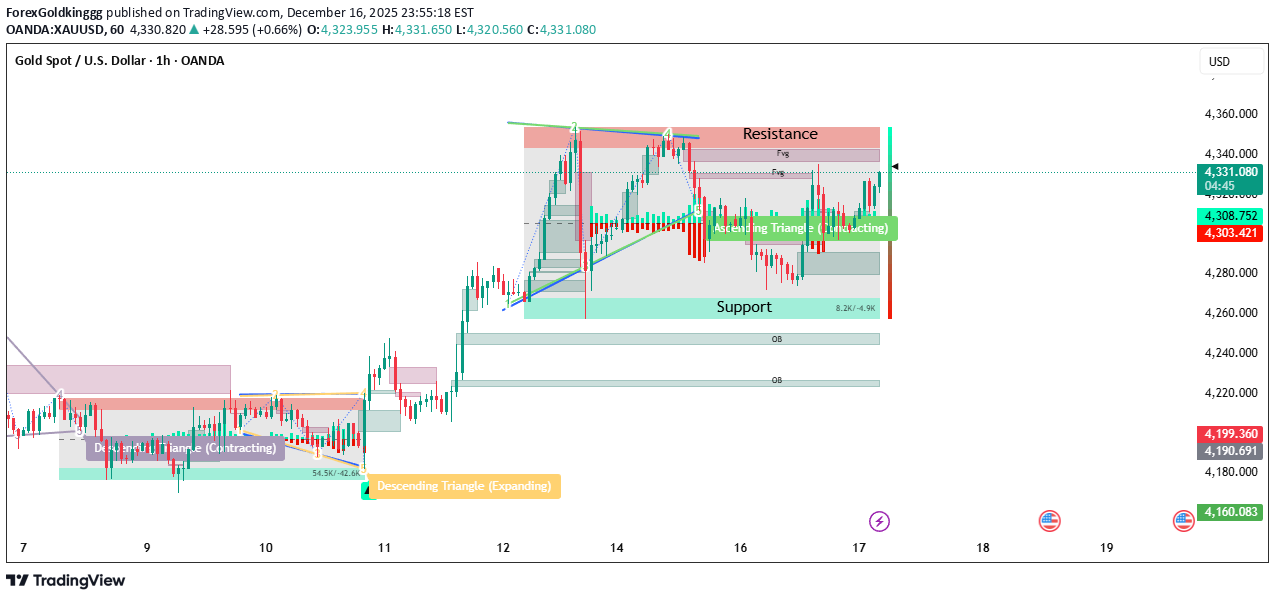
Hello Traders 🙋 Hope Everyone is Ok Let's Talk About our Chart 👇 🔎 Market Structure Overall bias: Bullish but consolidating Price previously made a strong impulsive move up and is now compressing inside an Ascending Triangle (contracting). This usually acts as a continuation pattern if resistance breaks with volume. 📐 Key Technical Patterns 1️⃣ Ascending Triangle (Right Side) Higher lows → buyers stepping in Flat / sloping resistance → sellers defending a key zone Pattern suggests pressure building for a breakout 2️⃣ Previous Breakout Context Earlier descending triangle → bullish expansion Confirms buyers are in control on higher timeframe 🟥 Resistance Zone 4,340 – 4,360 Multiple rejections + liquidity resting above This is the make-or-break level Bullish confirmation only if: Strong H1 close above 4,360 Preferably with displacement (large bullish candle) 🟩 Support Zones Major Support 4,300 – 4,280 Triangle base + demand zone Strong reaction area for buys Deeper Support (If Breakdown) 4,260 4,220 (OB zone) 📊 Trade Scenarios ✅ Bullish Breakout Setup (Preferred) Entry: H1 close above 4,360 or pullback to 4,340 Stop Loss: Below 4,310 Targets: TP1: 4,380 TP2: 4,410 TP3: 4,450+ 📈 Structure favors continuation if resistance flips to support. ⚠️ Bearish Rejection Setup (Countertrend) Entry: Rejection wick / bearish engulfing at 4,350–4,360 Stop Loss: Above 4,370 Targets: TP1: 4,310 TP2: 4,280 TP3: 4,260 ⚠️ Countertrend → manage risk tightly. 🧠 Smart Money Insight Price is sweeping liquidity near resistance If breakout happens, expect fast expansion If rejected, price likely seeks equal lows / demand 📌 Conclusion Bias: Bullish Wait for confirmation Best trade = break & retest of 4,340–4,360 🔹 What London Typically Does Tests Asian range highs/lows Hunts liquidity at key resistance Sets the directional bias for NY ✅ London Bullish Scenario Condition: H1 / M15 close above 4,360 Entry (Aggressive): Break & hold above 4,360 Entry (Safer): Pullback to 4,340–4,350 SL: Below 4,315 Targets: 4,380 4,410 📌 If London breaks resistance cleanly → NY usually continues. ❌ London Fake Break / Rejection Signs: Long upper wicks at 4,350–4,360 Bearish engulfing on M15/H1 Volume spike with no follow-through Sell Entry: Below 4,340 SL: Above 4,370 Targets: 4,310 4,280 ⚠️ This is common if London sweeps liquidity but doesn’t close above resistance. 🇺🇸 New York Session Plan (Expansion Phase) 🔥 NY Bullish Expansion (Best Setup) Condition: London holds above 4,340 No deep pullback into triangle Buy Entry: NY open pullback to 4,340–4,350 SL: Below 4,320 Targets: 4,410 4,450+ 📈 This is where real momentum usually enters. 🐻 NY Reversal / Deep Pullback Condition: London fails breakout NY opens with strong bearish displacement Sell Entry: Break below 4,300 SL: Above 4,330 Targets: 4,280 4,260 4,220 (OB) 🧠 Session-Based Rules (Very Important) ❌ No trades in Asia (range + manipulation) ✅ Trade London confirmation 💥 Execute during NY or overlap If London traps traders, NY usually reverses hard 📌 High-Probability Summary Best buy: ✔ London break + NY continuation above 4,360 Best sell: ✔ London liquidity sweep + NY reversal from 4,360 🚀 Support the Idea! 👍 Like | 🔔 Follow | 💬 Comment | 🔁 Share Your engagement boosts visibility and helps our community stay strong. Share your own charts and setups in the comments — let’s analyse together!Active
ForexGoldkinggg
XAUUSD Bullish Reason
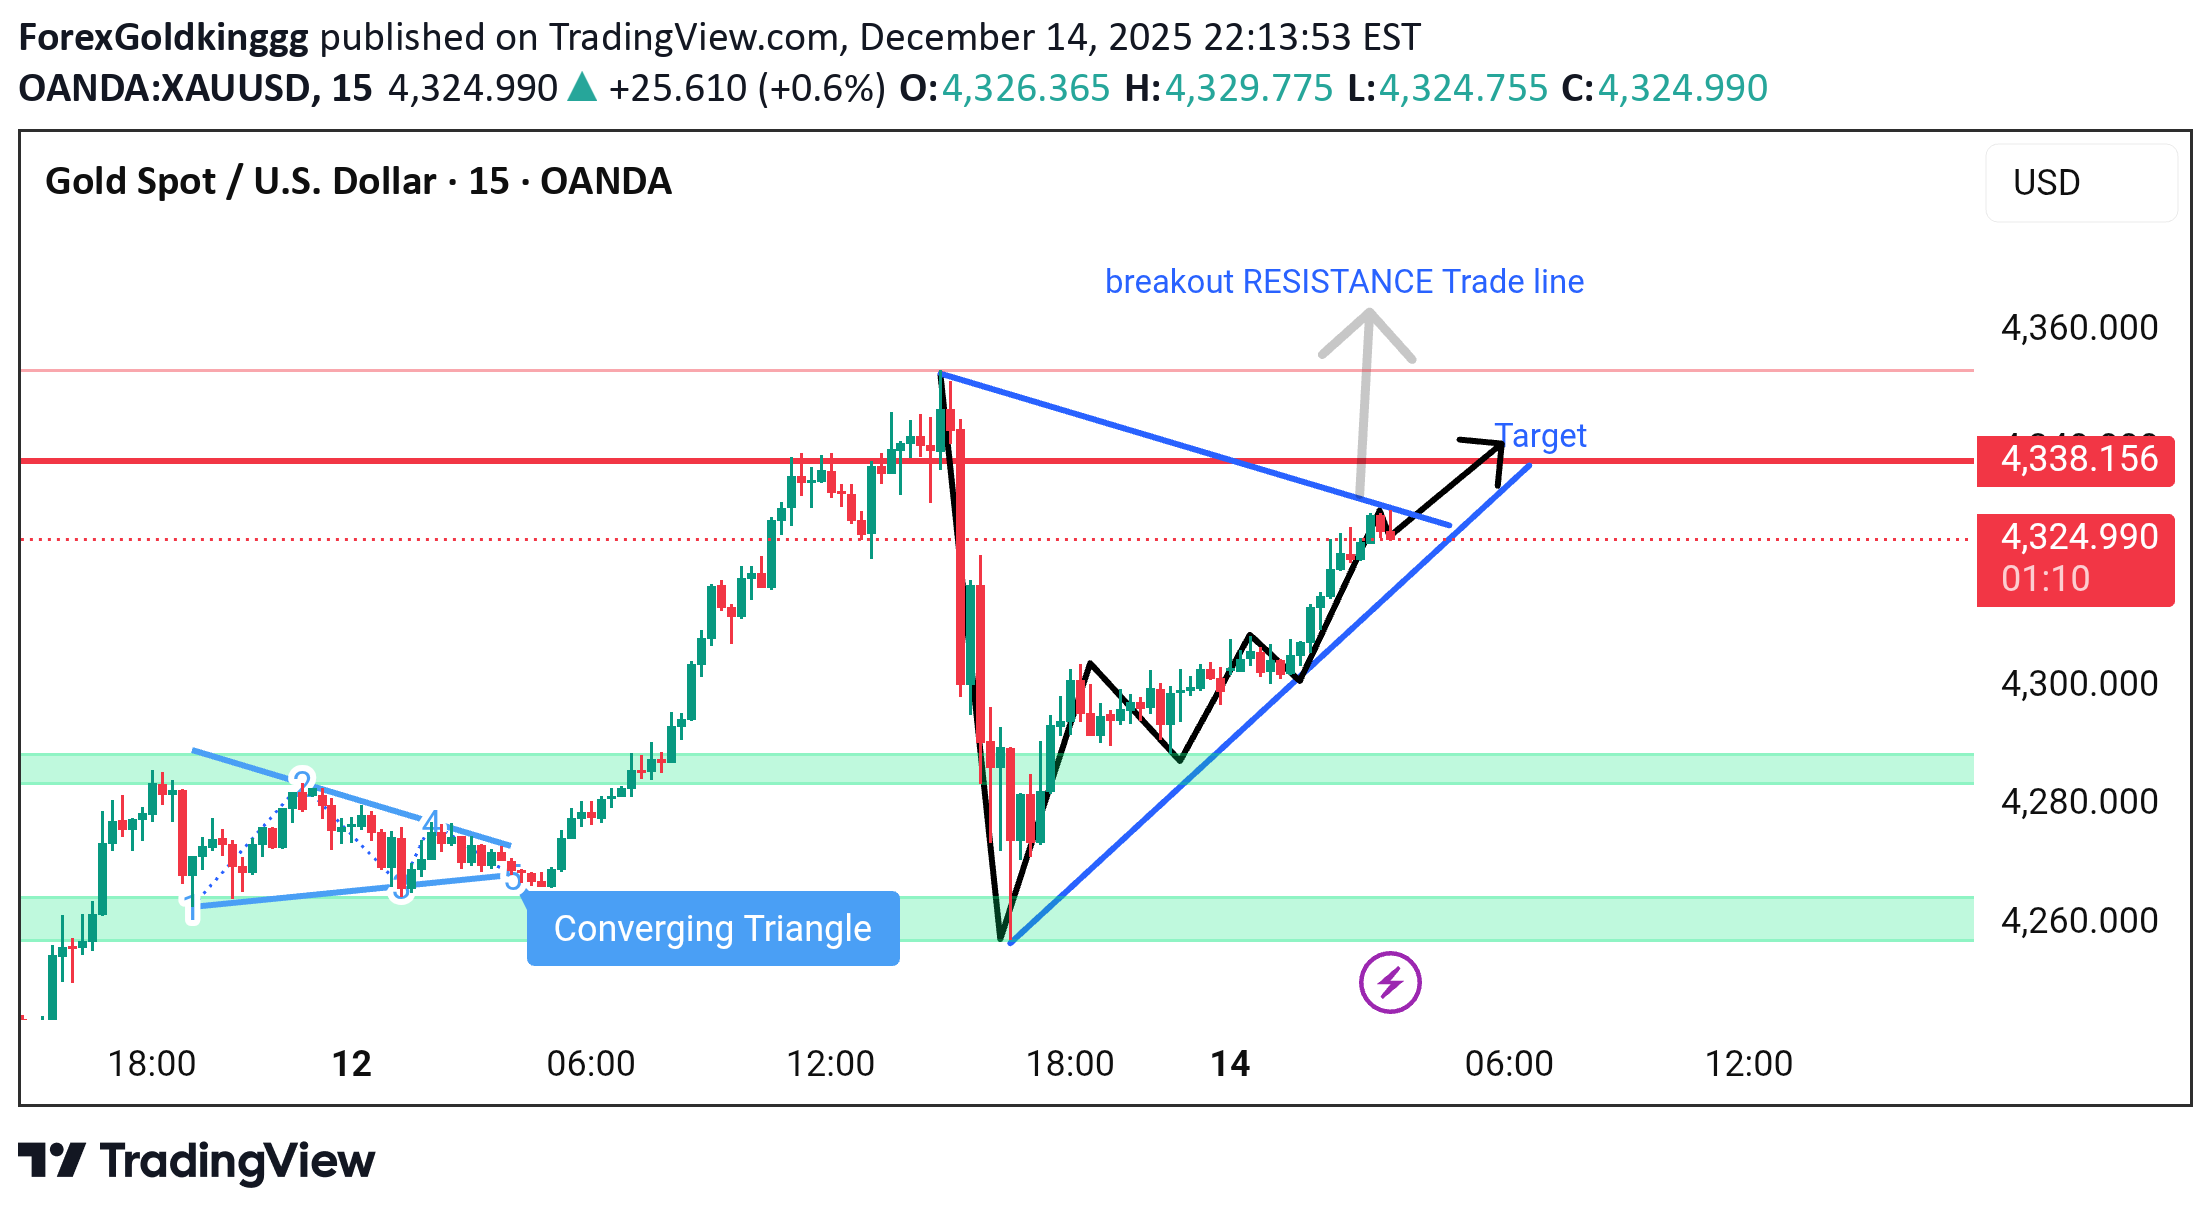
XAUUSD BUY – Trade Reason Strong Demand Zone (4326–4323): Price is reacting from a key support area where buyers previously stepped in. Bullish Rejection Candles: Long lower wicks / bullish candle close indicate strong buying pressure. Trend Continuation: Overall structure remains bullish with higher highs and higher lows. Liquidity Grab Below Support: Stop-hunt below recent lows followed by quick recovery supports buy bias. Indicator Confirmation: RSI holding above mid-level and momentum turning upward. Targets: 4329 → 4332 → 4338 Stop Loss: 4317 (below demand for protection) This setup favors a buy from support with trend continuation and a good risk-to-reward ratio.Active Trade
ForexGoldkinggg
تحلیل بیت کوین (BTC/USD) ۴ ساعته: آیا ریزش بزرگ به سمت ۸۰ هزار دلار در راه است؟
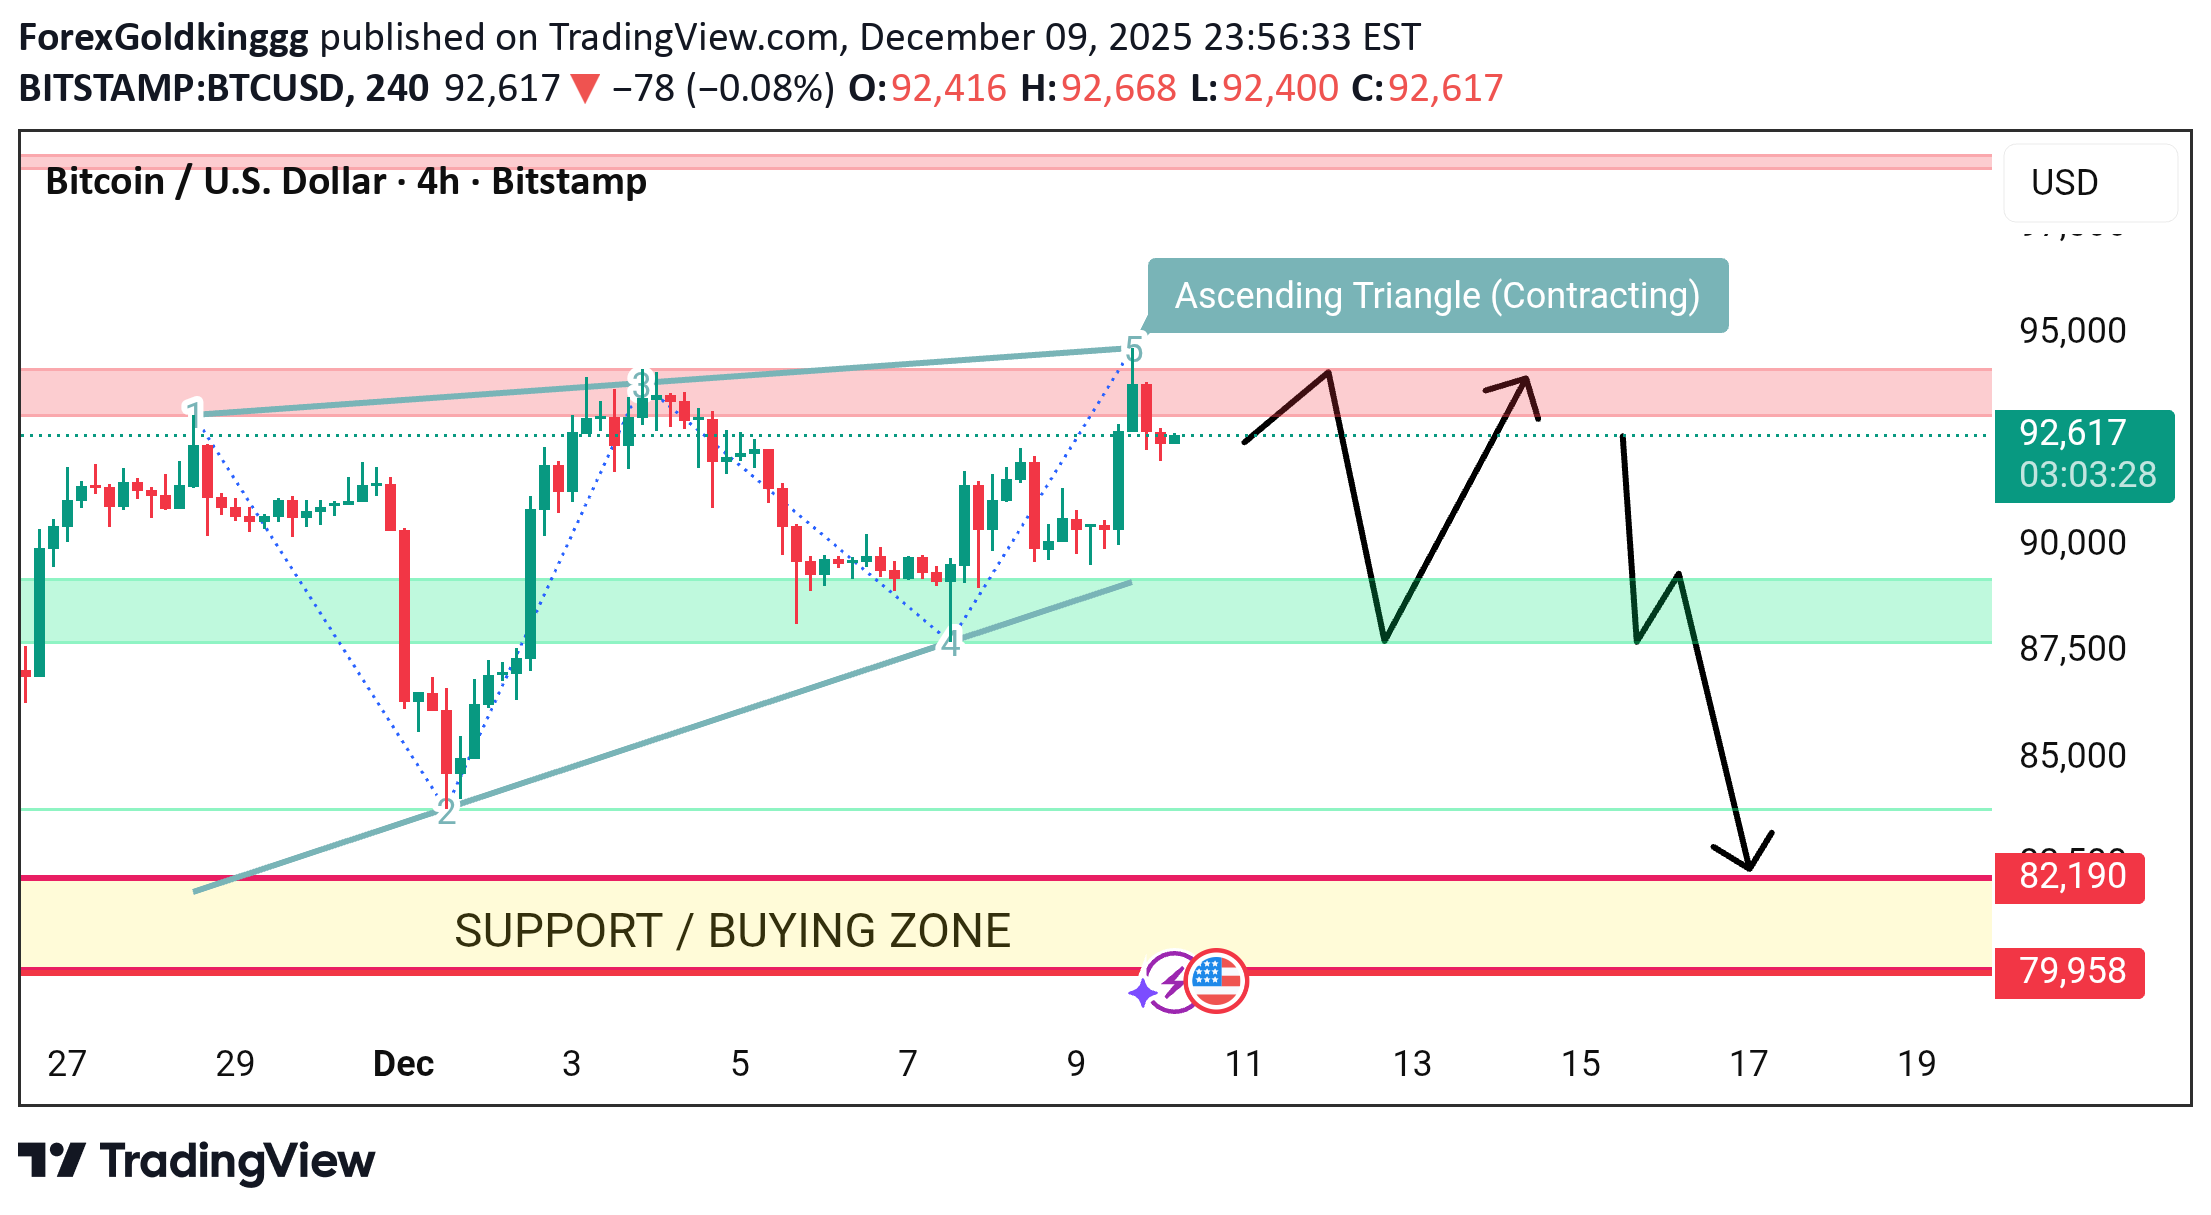
Hello Traders 🙋 Hope Everyone is Ok Let's Talk About our Chart 👇 Resistance is flattening near 92,800–93,200. Higher lows from points 2 → 4 → current price confirm the structure. This pattern often signals weakening bullish momentum when contracting. 🔴 Major Resistance Zone 92,800–93,200 Price has rejected this level multiple times (1 → 3 → 5), showing strong selling pressure. 🟢 Immediate Support Zone 88,000–89,000 This is the zone where price may pull back and retest before any major move. 🟡 Support / Buying Zone (Strong) 82,000–80,000 This is the major demand block. A deeper correction could target this area. 3. Expected Price Scenarios (Based on Your Arrows) Scenario 1 – Short-Term Pullback & Bounce Price rejects resistance Falls toward 88k–89k Small bounce may occur before deciding direction This shows consolidation inside the larger pattern. Scenario 2 – Breakdown Toward Demand Zone If price breaks below 88k support Momentum shift turns bearish Target becomes 82k–80k buying zone This is consistent with triangle failure + market structure change. Market Structure Insight Price has already rejected point 5 (top of triangle). Lower timeframe signals suggest buyers are weakening. Sellers appear stronger each time price hits resistance. This increases risk of a downside breakout. Contracting ascending triangle ✔ Rejection at key resistance ✔ Support at 88k is critical ✔ Breakdown could send BTC toward 82k–80k ✔ A bounce from 88k is possible before any major move 🚀 Support the Idea! 👍 Like | 🔔 Follow | 💬 Comment | 🔁 Share Your engagement boosts visibility and helps our community stay strong. Share your own charts and setups in the comments — let’s analyse together!
ForexGoldkinggg
تحلیل تکنیکال روزانه: آیا تون کوین (TON) آماده انفجار به سمت ۳.۵۸ دلار است؟
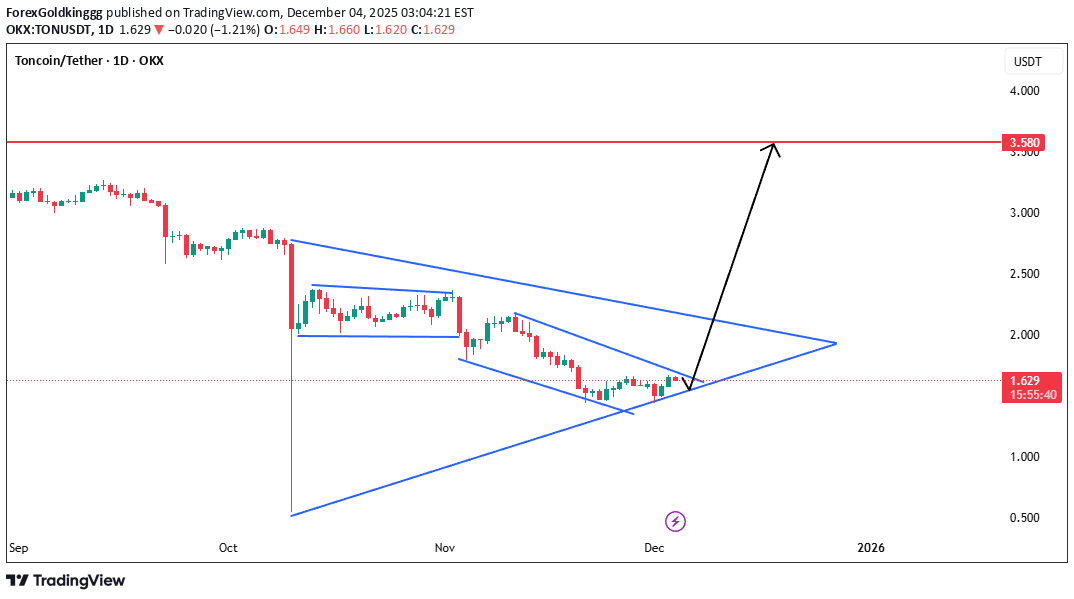
Hello Traders 🙋 Hope Everyone is Ok Let's Talk About our Chart 👇 TON forming a large symmetrical wedge after a major sell-off. This is a classic compression–accumulation pattern that often leads to a breakout. Major Drop → Consolidation Phase A big vertical drop (red line) happened earlier, followed by: Sideways consolidation Lower highs Higher lows This is a textbook price compression, which usually ends with a sharp expansion. Large Symmetrical Triangle (Primary Pattern) The wide blue structure marks a major symmetrical wedge. Meaning: Sellers losing momentum Buyers starting to defend lows Volatility squeezing Breakout can be explosive TON is nearing the apex, and typically breakouts occur before reaching the exact tip. Smaller Falling Wedge (Secondary Pattern) Inside the big structure, TON created a smaller falling wedge, which it has already broken or is testing. This is a bullish reversal pattern, indicating early accumulation before a larger trend reversal. This smaller wedge gives extra confirmation that buyers are stepping in. Price Sitting at Breakout Point The current candle is sitting directly on the: Lower wedge support Small wedge breakout point Triangle convergence area This region is a high-probability pivot zone where a strong directional move typically forms. Your arrow showing a bounce from this zone is technically valid. Upside Target: 3.58 USDT Your marked target is realistic based on: Previous major supply zone Horizontal resistance Measured move from wedge height Market structure imbalance left above 3.40 – 3.60 A confirmed breakout above the upper triangle line could easily send TON into a fast upside rally toward 3.58. The reward-to-risk is very good if support holds. Bullish Scenario (Higher probability) ✔ Price bounces off triangle support ✔ Breaks through the upper wedge line ✔ Retests 1.90–2.00 region ✔ Initiates a rally toward 3.58 This matches the trajectory you drew. This scenario is supported by both the macro wedge and the micro falling wedge. Bearish Scenario (Low probability but important) If the lower wedge support (around ~1.55–1.60) fails: Structure invalidates TON drops back into free-fall Next support is around 1.25 – 1.30 But current structure favors buyers more. 📌 Summary Your analysis is accurate: TON is compressing inside a large symmetrical triangle A smaller bullish wedge supports momentum shift Breakout potential is high Target 3.58 is justified and realistic Bulls need to protect the 1.55–1.60 region 🚀 Support the Idea! 👍 Like | 🔔 Follow | 💬 Comment | 🔁 Share Your engagement boosts visibility and helps our community stay strong. Share your own charts and setups in the comments — let’s analyse together!ACTIVE
ForexGoldkinggg
تحلیل تکنیکال سولانا (SOL/USD): هدف نزولی ۱33 دلار در کمین است!
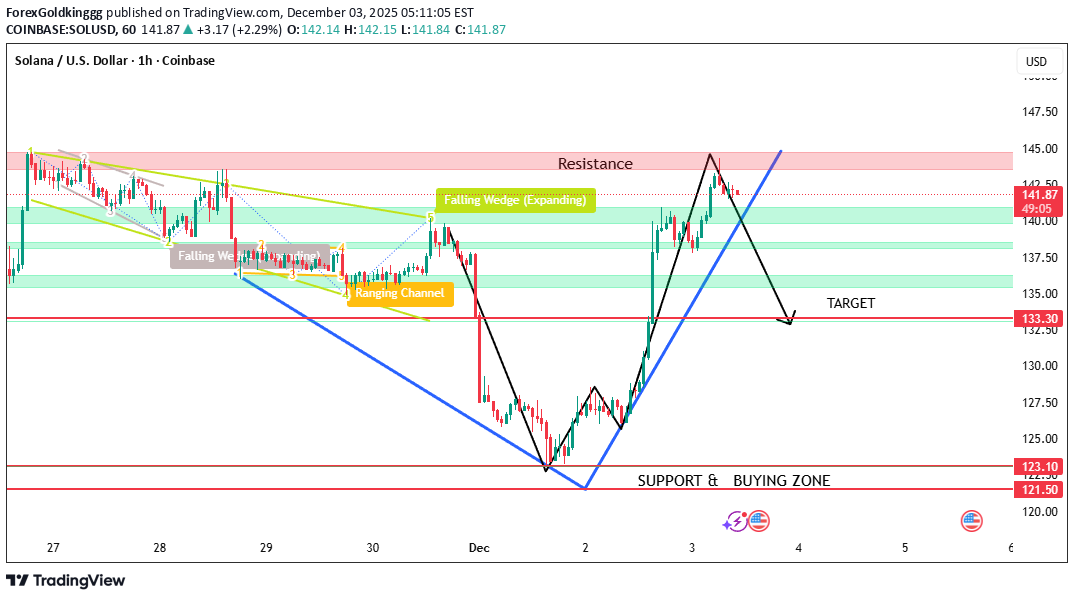
Hello Traders 🙋 Hope Everyone is Ok Let's Talk About our Chart 👇 SOL/USD points down to 133.30 — this is a logical target because: ✔ It aligns with previous supply turned support ✔ It sits right below several liquidity layers ✔ It’s a Fibonacci-friendly retracement area (likely ~0.382–0.5) If the market breaks the blue trendline with a solid candle close, the probability of heading toward 133.30 becomes much stronger 1. Key Zones Resistance Zone: ~143–145 Price is currently reacting to this zone, showing rejection — a potential signal for a short-term pullback. Support / Buying Zone: 121.5 – 123.1 Major demand zone where previous strong bullish reversal occurred. Intermediate Support Levels (Green zones): 140 → 138 → 136 → 133 These are minor liquidity shelves where price could pause or bounce. Current Market Structure Your chart shows: 🔺 Recent Bullish Move Strong impulsive rally from the support/buying zone. Breakout of descending structure (falling wedge + ranging channel). 🔻 Current Reaction Price is rejecting from the major resistance zone. The drawn blue trendline has been touched, and price is starting to dip. This suggests bullish momentum is weakening, and we may see a correction. What to Watch Next Bearish Scenario (Most Likely Short Term) Break and retest of trendline Move toward 138 → 136 → 133.3 (main target) Possible bounce back upward from 133 zone Bullish Invalidations If SOL closes above 145, the bearish setup is invalid. A breakout above resistance could send price toward 150–155. Short-term bias: Bearish correction Primary downside target: 133.30 Major support to watch: 123–121 Bullish continuation only if: 145 breaks cleanly 🚀 Support the Idea! 👍 Like | 🔔 Follow | 💬 Comment | 🔁 Share Your engagement boosts visibility and helps our community stay strong. Share your own charts and setups in the comments — let’s analyse together!Active
ForexGoldkinggg
تحلیل بیت کوین (2 دسامبر): هشدار فروش قوی زیر ۸۸,۰۰۰ دلار!
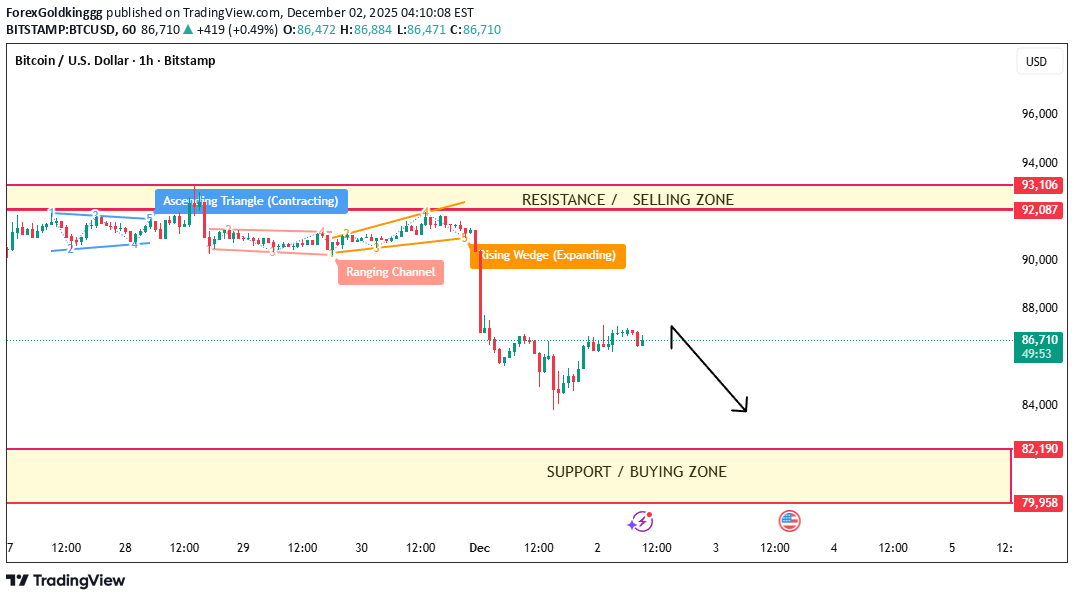
Hello Traders 🙋 Hope Everyone is Ok Let's Talk About our Chart 👇 BTC/USD Price rejected strongly from the 92,087–93,106 resistance / selling zone after forming an expanding rising wedge—a bearish pattern. Market is now making a small corrective move upward, but momentum stays bearish. As long as BTC stays below 88,000, the bias remains downside toward the 83,000–82,141 support / buying zone. (Not Financial Advice) BTCUSD SELL BTCUSD SELL SIGNAL SELL: 86,800 – 87,200 SL: 90,200 TP1: 84,500 TP2: 83,400 TP3: 80,200 Bias: Bearish below 88,000 🚀 Support the Idea! 👍 Like | 🔔 Follow | 💬 Comment | 🔁 Share Your engagement boosts visibility and helps our community stay strong. Share your own charts and setups in the comments — let’s analyse together!
ForexGoldkinggg
تحلیل تکنیکال اتریوم (ETH): هشدار فروپاشی از سقف قیمتی! چه سرنوشتی در انتظار ETH است؟
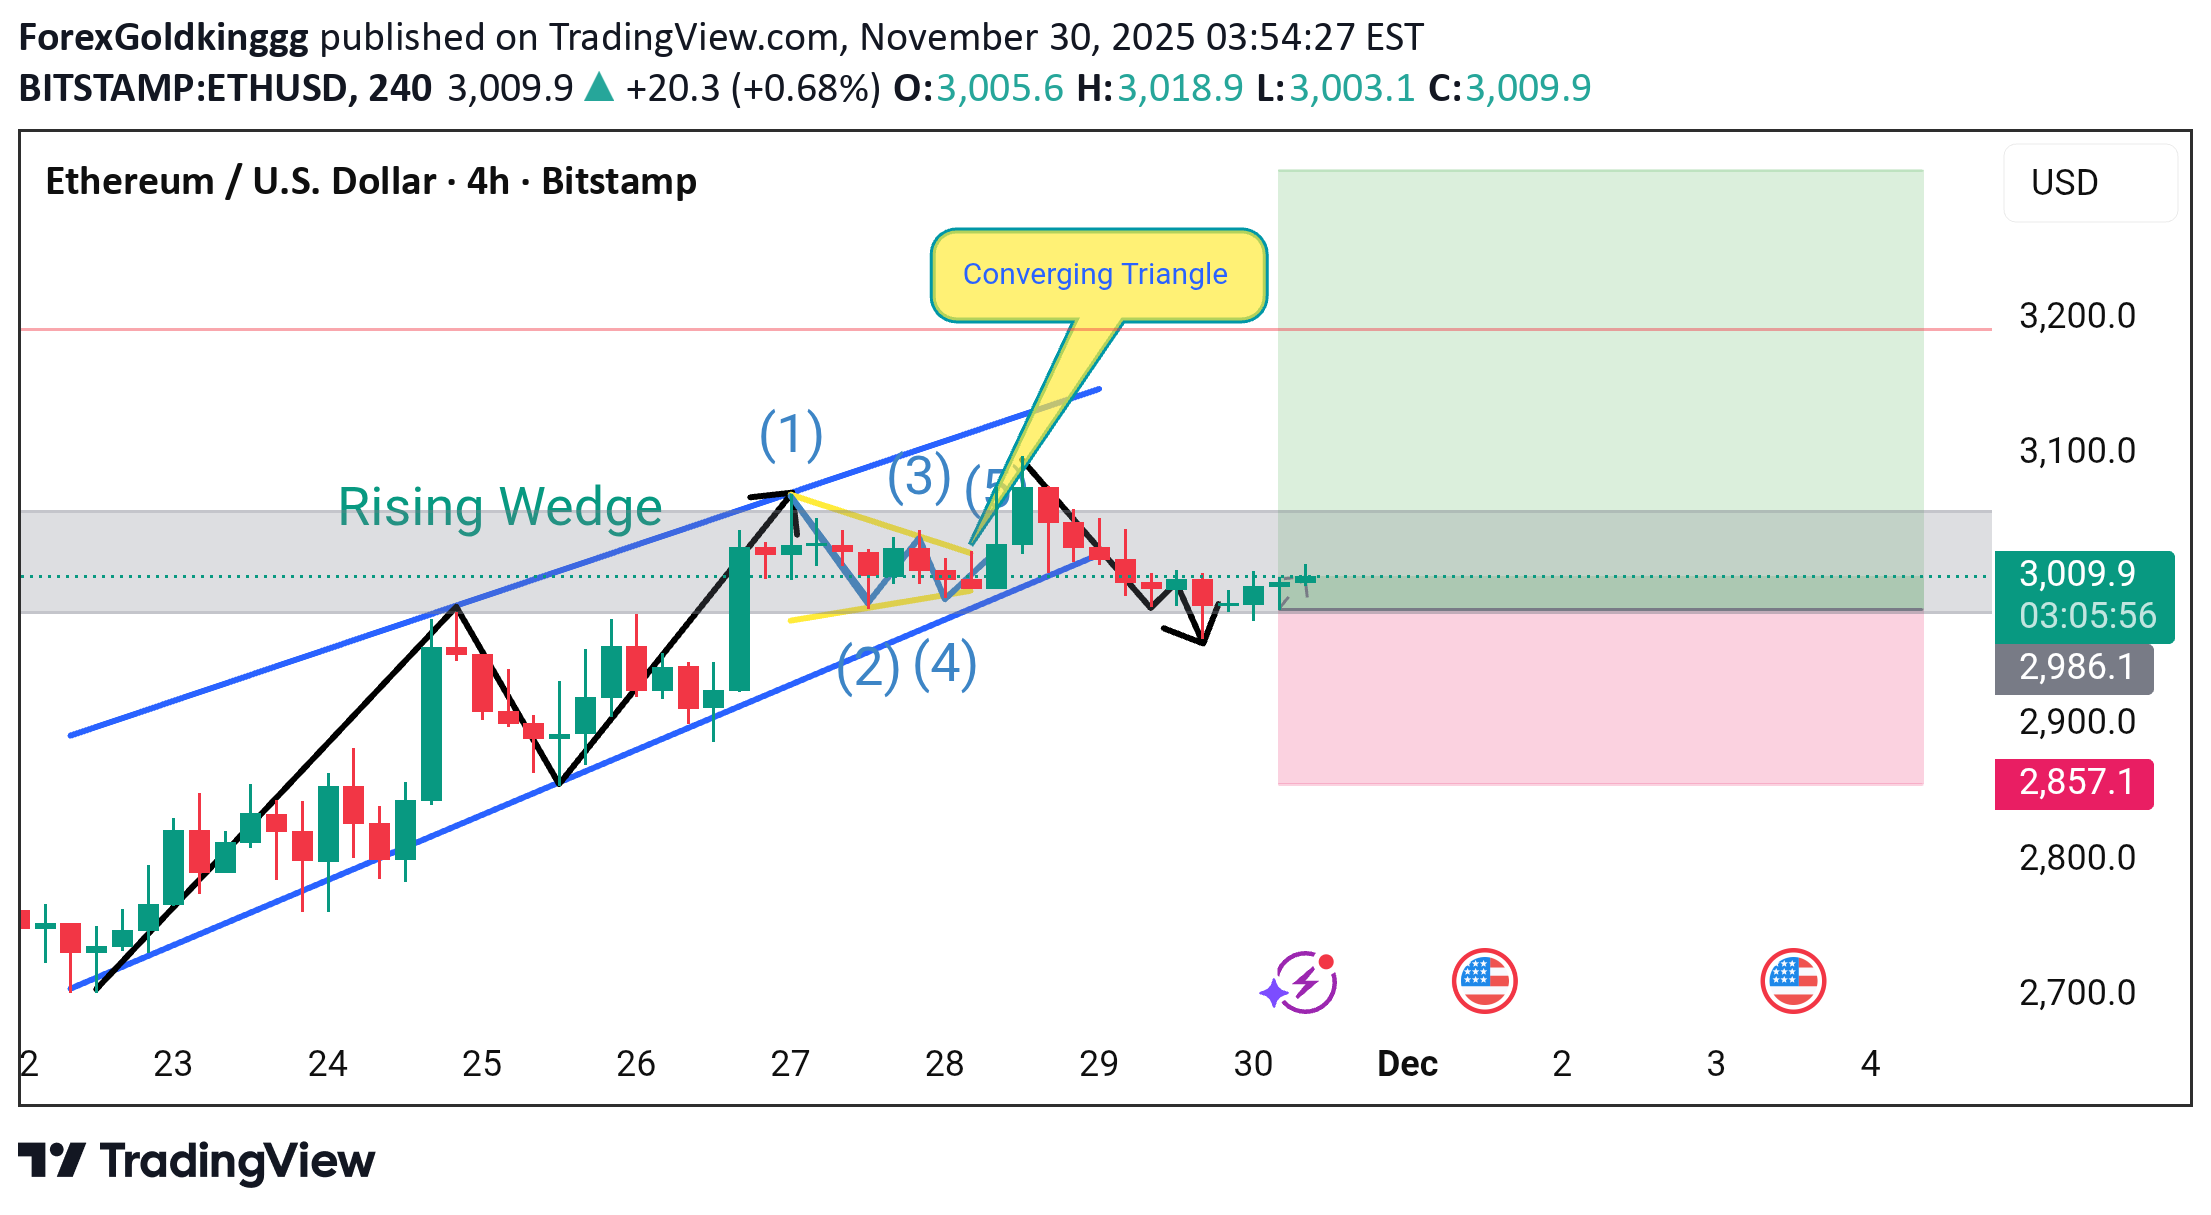
ETH/USD chart shows a combination of Rising Wedge, Elliott Wave structure, and a Converging Triangle, all happening near a major resistance zone around $3000–$3050. 🔍 Structure Breakdown 1️⃣ Rising Wedge (Bearish Pattern) Price moved inside a rising wedge with higher highs & higher lows. Rising wedges usually break downward, indicating sellers gaining control. ➡️ Your chart confirms breakdown after wave (5). 2️⃣ Elliott Wave Count (1–5) You marked a clean 5-wave impulse inside the wedge: Wave (1) – First push upward Wave (2) – Pullback Wave (3) – Strong impulsive rally Wave (4) – Correction Wave (5) – Final extension before reversal After Wave (5), ETH lost bullish momentum → bearish sign. 3️⃣ Converging Triangle (Continuation or Reversal Zone) After wave (5), market formed a small converging triangle. This usually signals indecision before a breakout. But since it formed after a rising wedge, probability of a downside break is higher. Support & Resistance Zones 🔻 Support Zone $2985–$2995 (closest support) If this breaks → next target $2850–$2870 🔺 Resistance Zone $3050–$3200 This is a strong supply zone (your chart’s shaded area). 🎯 Current Position (Price: ~3010) Market Bias: Mild Bearish Reasons: Rising wedge breakdown Price rejected at wave (5) Triangle showing weakness Sellers defending the $3050 zone 📉 Bearish Scenario (Most Likely) If price stays below $3050, ETH likely targets: TP1 → $2985 TP2 → $2890 TP3 → $2850 📈 Bullish Scenario (If Breaks Above $3050) If ETH closes 4H candle above $3050, next upside target: $3150 $3200+
ForexGoldkinggg
تحلیل تکنیکال بیت کوین (BTC/USD): مثلث صعودی شکست خورد؟ سطوح کلیدی و سناریوی نزولی محتمل
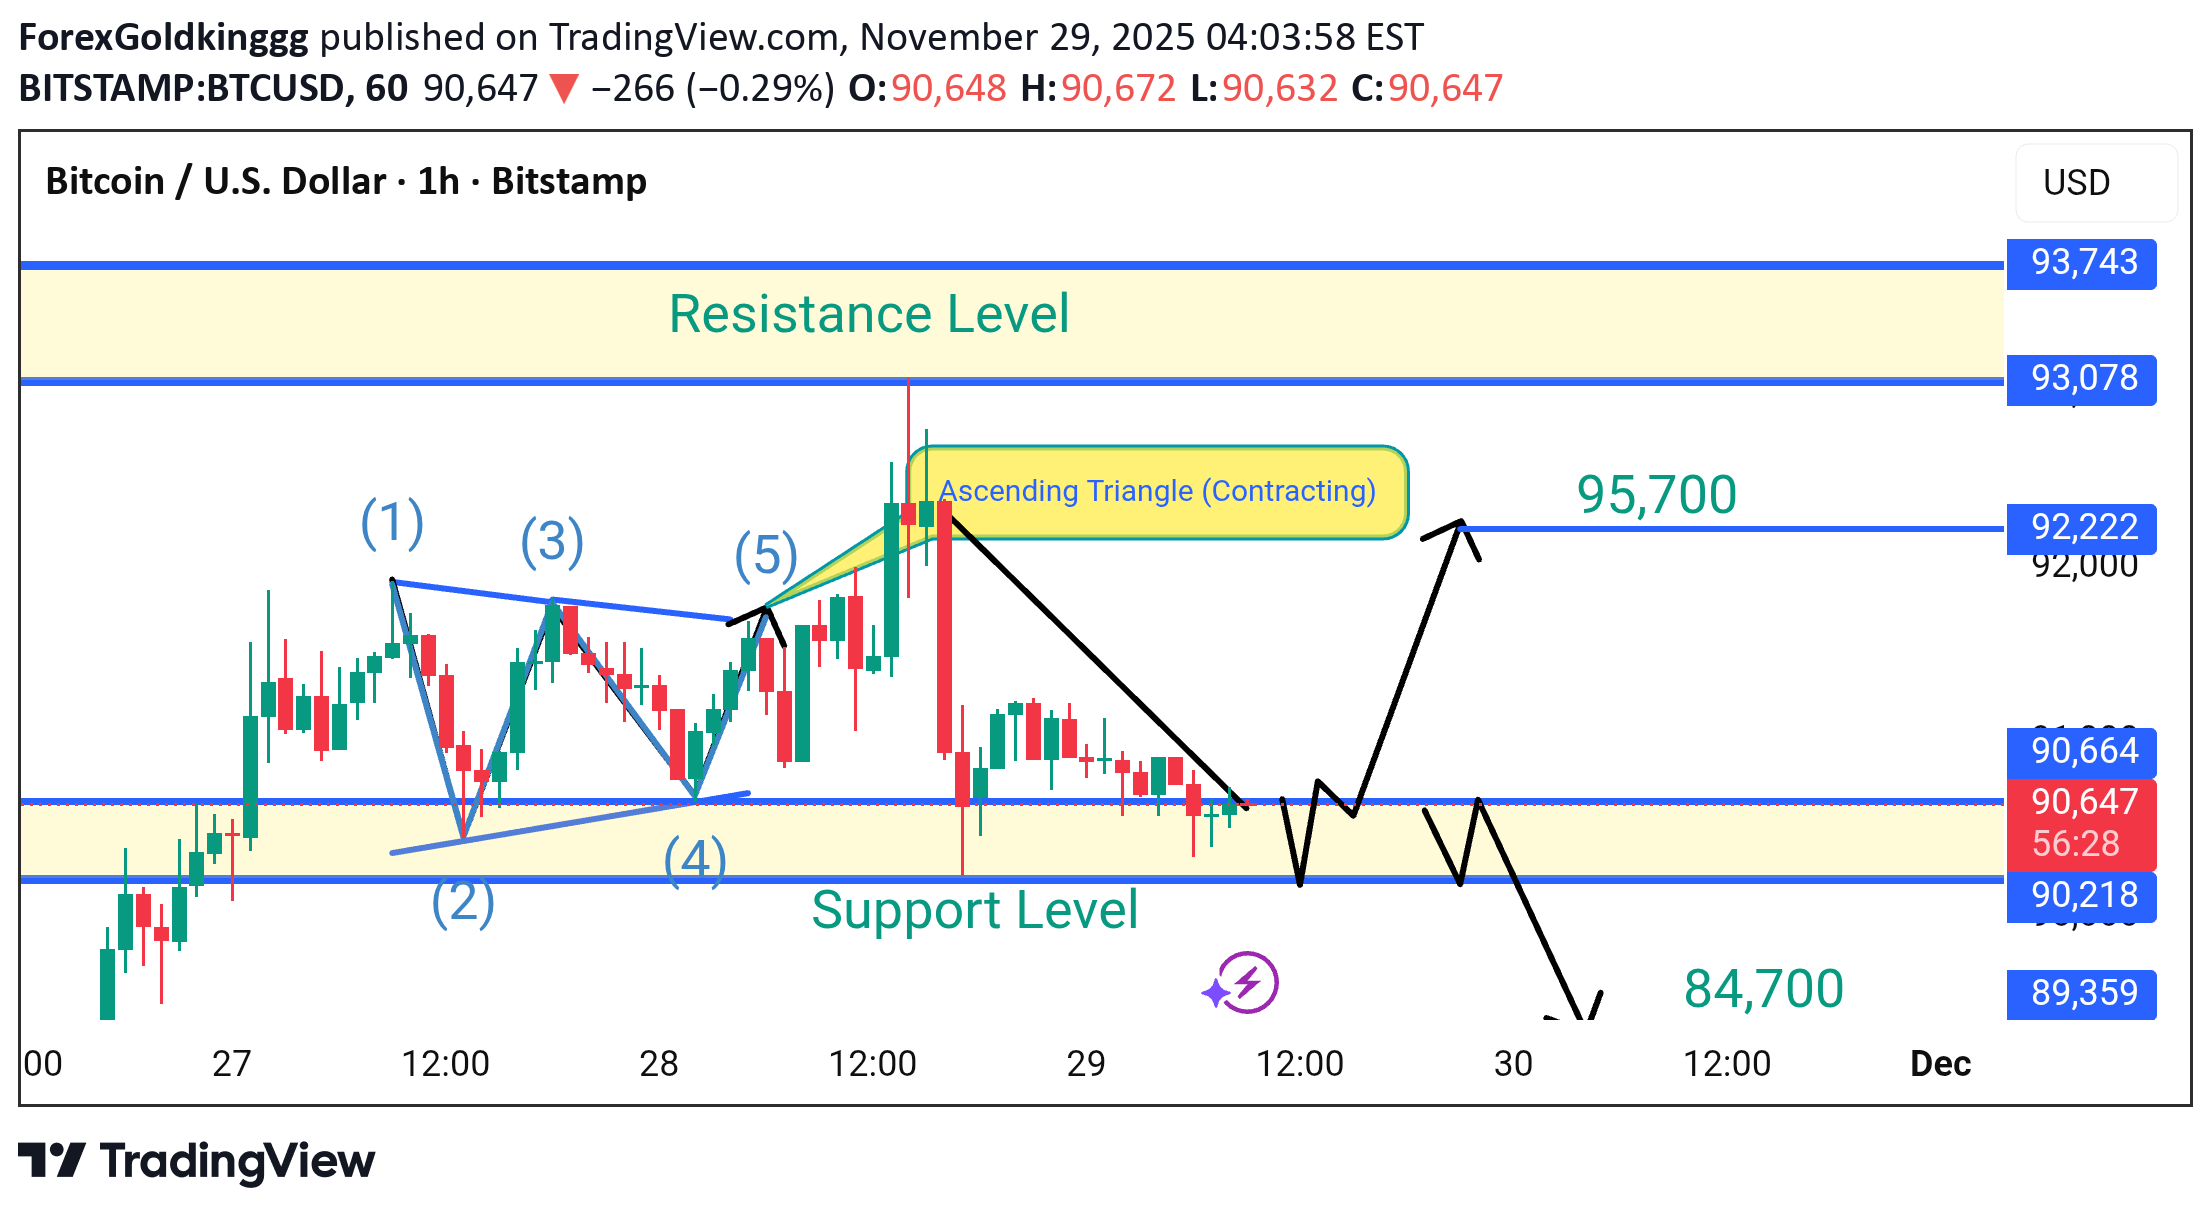
Hello Traders 🙋 Hope Everyone is Ok Let's Talk About our Chart 👇 🔷 1. Market Structure BTC/USD chart shows a Contracting Ascending Triangle, typically a bullish continuation pattern — but only if the breakout happens above the upper trendline. However, price failed to break above and instead moved sideways into support, showing weak bullish momentum. 🔷 2. Key Levels To Watch for us Major Resistance: $93,000 – $93,200 Mid-Range Resistance: $92,200 Support Zone: $89,300 – $90,200 Downside Target: $84,700 Upside Target if breakout happens: $95,700 Price rejected strongly from the triangle resistance. Now sitting on support with weak candle bodies shows seller pressure. Bears are slowly gaining control. 📉 Bearish Scenario (More Likely Now) If price breaks below $89,300 Expect a sharp drop toward ➡️ $86,000 → $84,700 📈 Bullish Scenario Price must break clean above $92,200 If successful: ➡️ Target: $95,700 Summary ✔ Weakening bullish structure ✔ Support testing multiple times ✔ Lower highs forming → bearish pressure ✔ Potential drop to $84,700 if support fails ✔ Only a breakout above $92,200 cancels bearish setup Active Trade 🟢 🚀 Support the Idea! 👍 Like | 🔔 Follow | 💬 Comment | 🔁 Share Your engagement boosts visibility and helps our community stay strong. Share your own charts and setups in the comments — let’s analyse together!
Disclaimer
Any content and materials included in Sahmeto's website and official communication channels are a compilation of personal opinions and analyses and are not binding. They do not constitute any recommendation for buying, selling, entering or exiting the stock market and cryptocurrency market. Also, all news and analyses included in the website and channels are merely republished information from official and unofficial domestic and foreign sources, and it is obvious that users of the said content are responsible for following up and ensuring the authenticity and accuracy of the materials. Therefore, while disclaiming responsibility, it is declared that the responsibility for any decision-making, action, and potential profit and loss in the capital market and cryptocurrency market lies with the trader.