Technical analysis by ForexGoldkinggg about Symbol PAXG on 12/17/2025

ForexGoldkinggg
تحلیل تکنیکال طلا (XAUUSD): مثلث صعودی، سطوح کلیدی و سناریوهای معاملاتی امروز
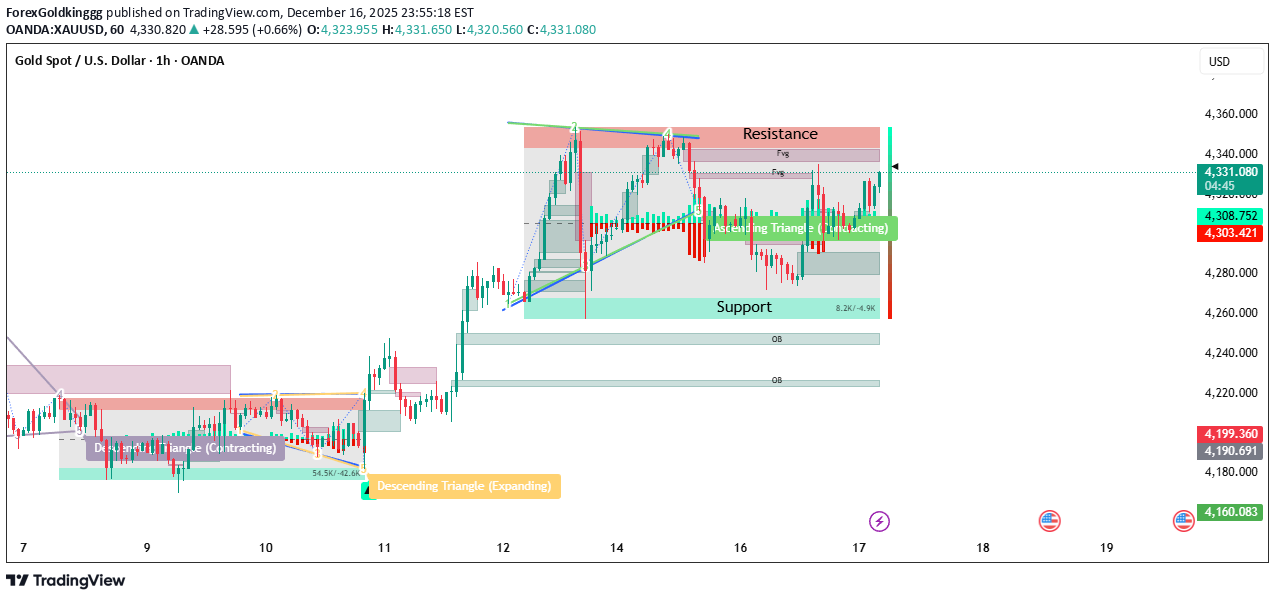
Hello Traders 🙋 Hope Everyone is Ok Let's Talk About our Chart 👇 🔎 Market Structure Overall bias: Bullish but consolidating Price previously made a strong impulsive move up and is now compressing inside an Ascending Triangle (contracting). This usually acts as a continuation pattern if resistance breaks with volume. 📐 Key Technical Patterns 1️⃣ Ascending Triangle (Right Side) Higher lows → buyers stepping in Flat / sloping resistance → sellers defending a key zone Pattern suggests pressure building for a breakout 2️⃣ Previous Breakout Context Earlier descending triangle → bullish expansion Confirms buyers are in control on higher timeframe 🟥 Resistance Zone 4,340 – 4,360 Multiple rejections + liquidity resting above This is the make-or-break level Bullish confirmation only if: Strong H1 close above 4,360 Preferably with displacement (large bullish candle) 🟩 Support Zones Major Support 4,300 – 4,280 Triangle base + demand zone Strong reaction area for buys Deeper Support (If Breakdown) 4,260 4,220 (OB zone) 📊 Trade Scenarios ✅ Bullish Breakout Setup (Preferred) Entry: H1 close above 4,360 or pullback to 4,340 Stop Loss: Below 4,310 Targets: TP1: 4,380 TP2: 4,410 TP3: 4,450+ 📈 Structure favors continuation if resistance flips to support. ⚠️ Bearish Rejection Setup (Countertrend) Entry: Rejection wick / bearish engulfing at 4,350–4,360 Stop Loss: Above 4,370 Targets: TP1: 4,310 TP2: 4,280 TP3: 4,260 ⚠️ Countertrend → manage risk tightly. 🧠 Smart Money Insight Price is sweeping liquidity near resistance If breakout happens, expect fast expansion If rejected, price likely seeks equal lows / demand 📌 Conclusion Bias: Bullish Wait for confirmation Best trade = break & retest of 4,340–4,360 🔹 What London Typically Does Tests Asian range highs/lows Hunts liquidity at key resistance Sets the directional bias for NY ✅ London Bullish Scenario Condition: H1 / M15 close above 4,360 Entry (Aggressive): Break & hold above 4,360 Entry (Safer): Pullback to 4,340–4,350 SL: Below 4,315 Targets: 4,380 4,410 📌 If London breaks resistance cleanly → NY usually continues. ❌ London Fake Break / Rejection Signs: Long upper wicks at 4,350–4,360 Bearish engulfing on M15/H1 Volume spike with no follow-through Sell Entry: Below 4,340 SL: Above 4,370 Targets: 4,310 4,280 ⚠️ This is common if London sweeps liquidity but doesn’t close above resistance. 🇺🇸 New York Session Plan (Expansion Phase) 🔥 NY Bullish Expansion (Best Setup) Condition: London holds above 4,340 No deep pullback into triangle Buy Entry: NY open pullback to 4,340–4,350 SL: Below 4,320 Targets: 4,410 4,450+ 📈 This is where real momentum usually enters. 🐻 NY Reversal / Deep Pullback Condition: London fails breakout NY opens with strong bearish displacement Sell Entry: Break below 4,300 SL: Above 4,330 Targets: 4,280 4,260 4,220 (OB) 🧠 Session-Based Rules (Very Important) ❌ No trades in Asia (range + manipulation) ✅ Trade London confirmation 💥 Execute during NY or overlap If London traps traders, NY usually reverses hard 📌 High-Probability Summary Best buy: ✔ London break + NY continuation above 4,360 Best sell: ✔ London liquidity sweep + NY reversal from 4,360 🚀 Support the Idea! 👍 Like | 🔔 Follow | 💬 Comment | 🔁 Share Your engagement boosts visibility and helps our community stay strong. Share your own charts and setups in the comments — let’s analyse together!Active