Technical analysis by ForexGoldkinggg about Symbol BTC on 12/10/2025

ForexGoldkinggg
تحلیل بیت کوین (BTC/USD) ۴ ساعته: آیا ریزش بزرگ به سمت ۸۰ هزار دلار در راه است؟
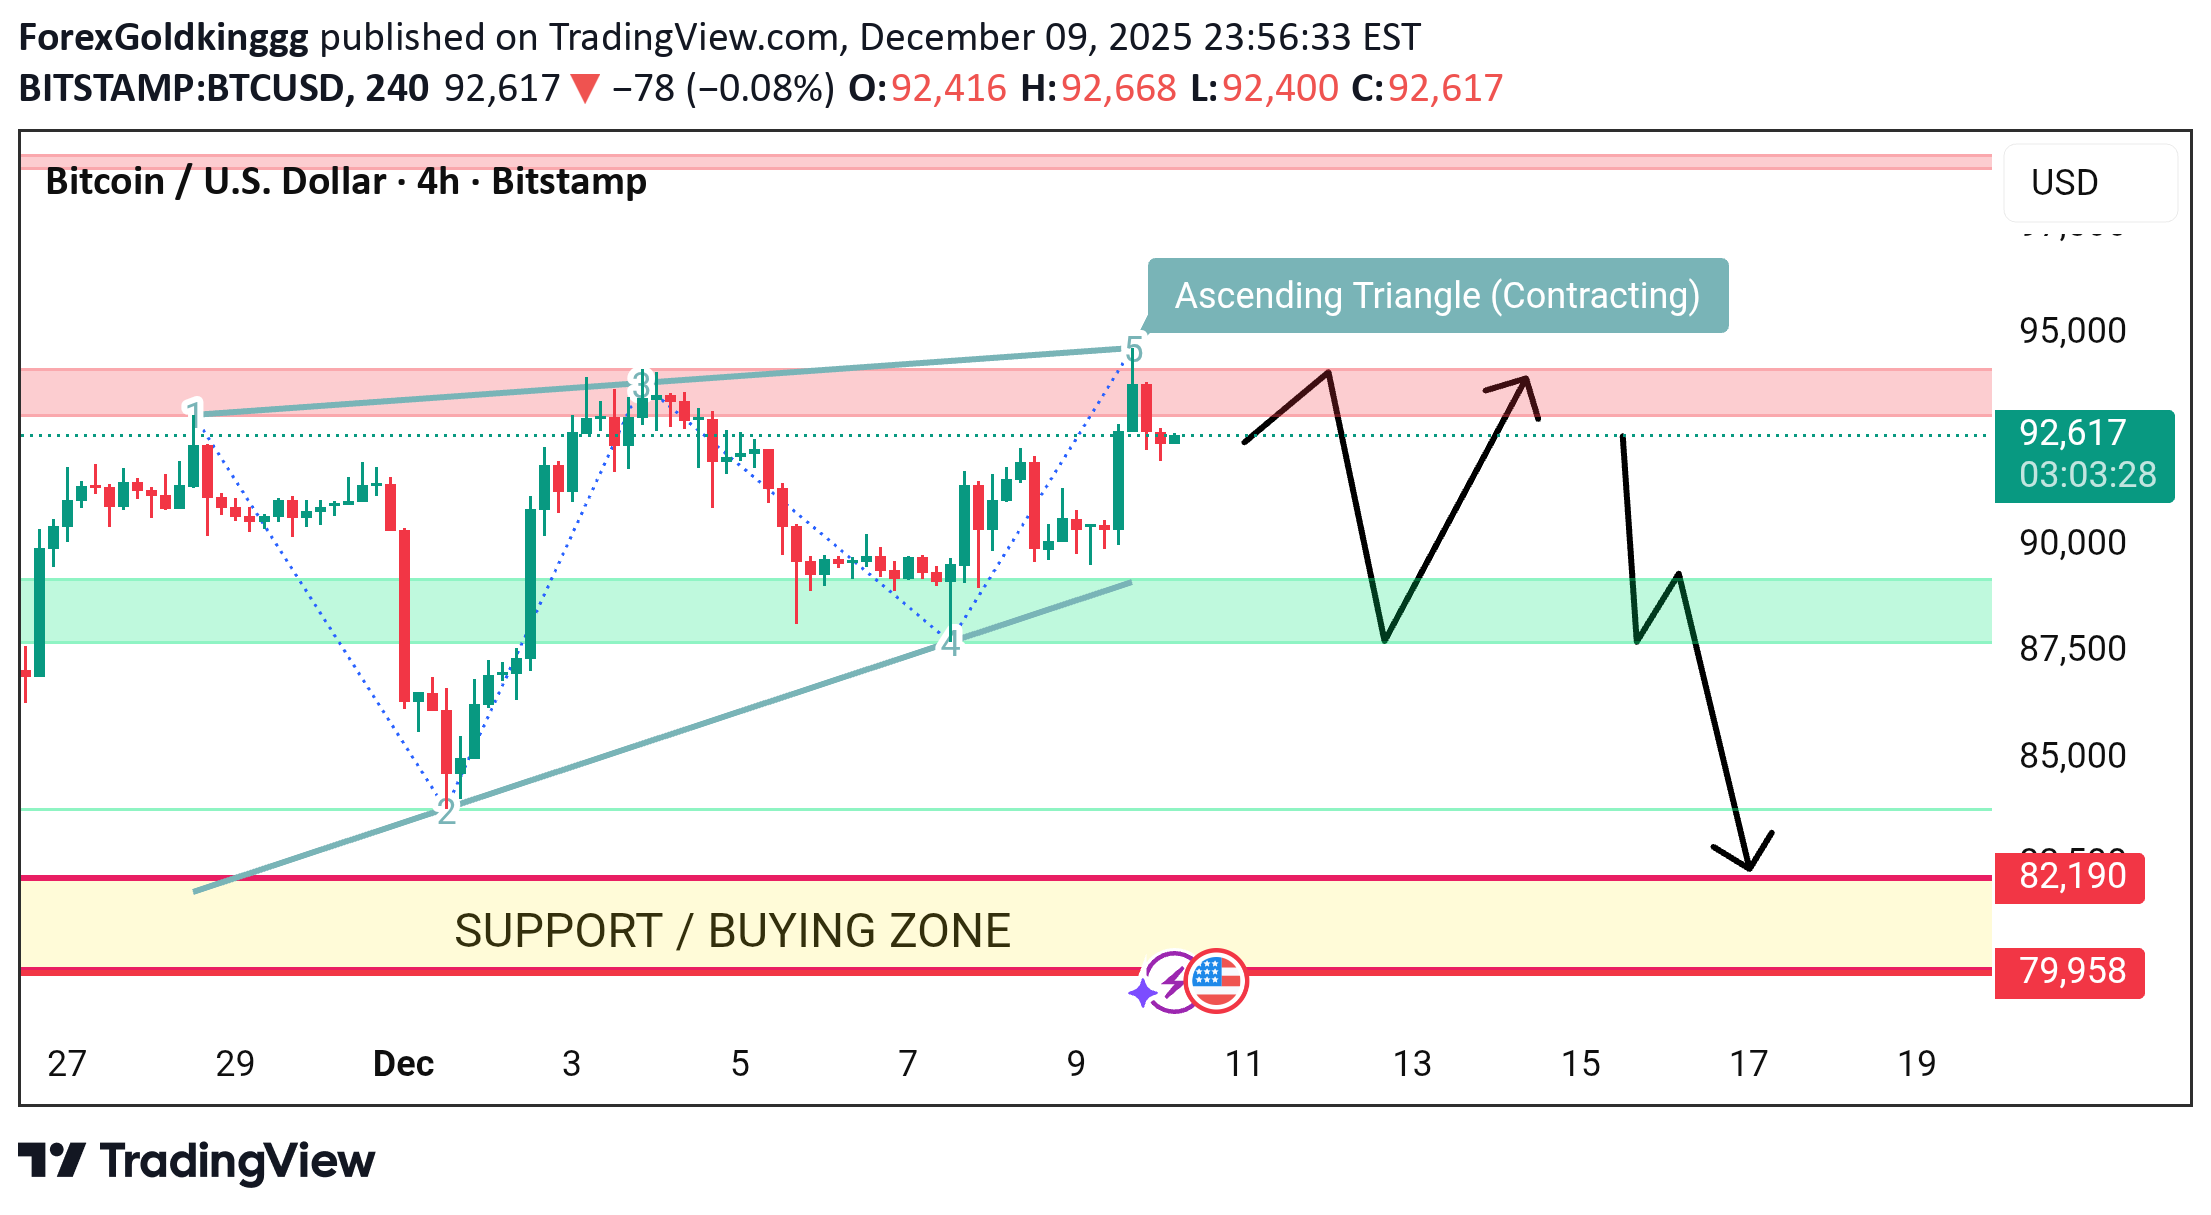
Hello Traders 🙋 Hope Everyone is Ok Let's Talk About our Chart 👇 Resistance is flattening near 92,800–93,200. Higher lows from points 2 → 4 → current price confirm the structure. This pattern often signals weakening bullish momentum when contracting. 🔴 Major Resistance Zone 92,800–93,200 Price has rejected this level multiple times (1 → 3 → 5), showing strong selling pressure. 🟢 Immediate Support Zone 88,000–89,000 This is the zone where price may pull back and retest before any major move. 🟡 Support / Buying Zone (Strong) 82,000–80,000 This is the major demand block. A deeper correction could target this area. 3. Expected Price Scenarios (Based on Your Arrows) Scenario 1 – Short-Term Pullback & Bounce Price rejects resistance Falls toward 88k–89k Small bounce may occur before deciding direction This shows consolidation inside the larger pattern. Scenario 2 – Breakdown Toward Demand Zone If price breaks below 88k support Momentum shift turns bearish Target becomes 82k–80k buying zone This is consistent with triangle failure + market structure change. Market Structure Insight Price has already rejected point 5 (top of triangle). Lower timeframe signals suggest buyers are weakening. Sellers appear stronger each time price hits resistance. This increases risk of a downside breakout. Contracting ascending triangle ✔ Rejection at key resistance ✔ Support at 88k is critical ✔ Breakdown could send BTC toward 82k–80k ✔ A bounce from 88k is possible before any major move 🚀 Support the Idea! 👍 Like | 🔔 Follow | 💬 Comment | 🔁 Share Your engagement boosts visibility and helps our community stay strong. Share your own charts and setups in the comments — let’s analyse together!