Technical analysis by ForexGoldkinggg about Symbol TON: Buy recommendation (12/4/2025)

ForexGoldkinggg
تحلیل تکنیکال روزانه: آیا تون کوین (TON) آماده انفجار به سمت ۳.۵۸ دلار است؟
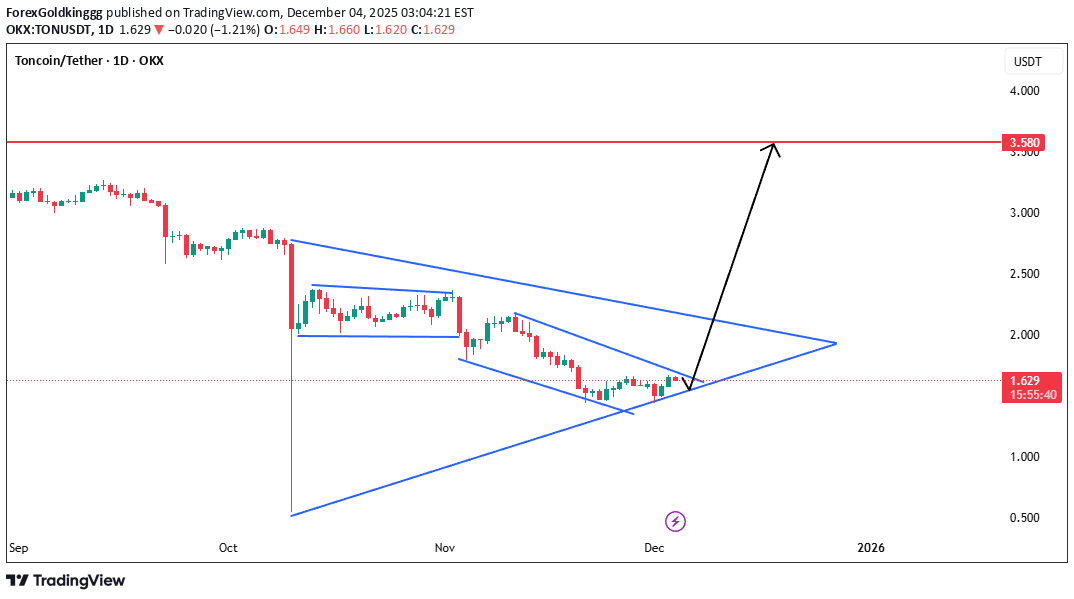
Hello Traders 🙋 Hope Everyone is Ok Let's Talk About our Chart 👇 TON forming a large symmetrical wedge after a major sell-off. This is a classic compression–accumulation pattern that often leads to a breakout. Major Drop → Consolidation Phase A big vertical drop (red line) happened earlier, followed by: Sideways consolidation Lower highs Higher lows This is a textbook price compression, which usually ends with a sharp expansion. Large Symmetrical Triangle (Primary Pattern) The wide blue structure marks a major symmetrical wedge. Meaning: Sellers losing momentum Buyers starting to defend lows Volatility squeezing Breakout can be explosive TON is nearing the apex, and typically breakouts occur before reaching the exact tip. Smaller Falling Wedge (Secondary Pattern) Inside the big structure, TON created a smaller falling wedge, which it has already broken or is testing. This is a bullish reversal pattern, indicating early accumulation before a larger trend reversal. This smaller wedge gives extra confirmation that buyers are stepping in. Price Sitting at Breakout Point The current candle is sitting directly on the: Lower wedge support Small wedge breakout point Triangle convergence area This region is a high-probability pivot zone where a strong directional move typically forms. Your arrow showing a bounce from this zone is technically valid. Upside Target: 3.58 USDT Your marked target is realistic based on: Previous major supply zone Horizontal resistance Measured move from wedge height Market structure imbalance left above 3.40 – 3.60 A confirmed breakout above the upper triangle line could easily send TON into a fast upside rally toward 3.58. The reward-to-risk is very good if support holds. Bullish Scenario (Higher probability) ✔ Price bounces off triangle support ✔ Breaks through the upper wedge line ✔ Retests 1.90–2.00 region ✔ Initiates a rally toward 3.58 This matches the trajectory you drew. This scenario is supported by both the macro wedge and the micro falling wedge. Bearish Scenario (Low probability but important) If the lower wedge support (around ~1.55–1.60) fails: Structure invalidates TON drops back into free-fall Next support is around 1.25 – 1.30 But current structure favors buyers more. 📌 Summary Your analysis is accurate: TON is compressing inside a large symmetrical triangle A smaller bullish wedge supports momentum shift Breakout potential is high Target 3.58 is justified and realistic Bulls need to protect the 1.55–1.60 region 🚀 Support the Idea! 👍 Like | 🔔 Follow | 💬 Comment | 🔁 Share Your engagement boosts visibility and helps our community stay strong. Share your own charts and setups in the comments — let’s analyse together!ACTIVE