Technical analysis by ForexGoldkinggg about Symbol BTC on 11/29/2025

ForexGoldkinggg
تحلیل تکنیکال بیت کوین (BTC/USD): مثلث صعودی شکست خورد؟ سطوح کلیدی و سناریوی نزولی محتمل
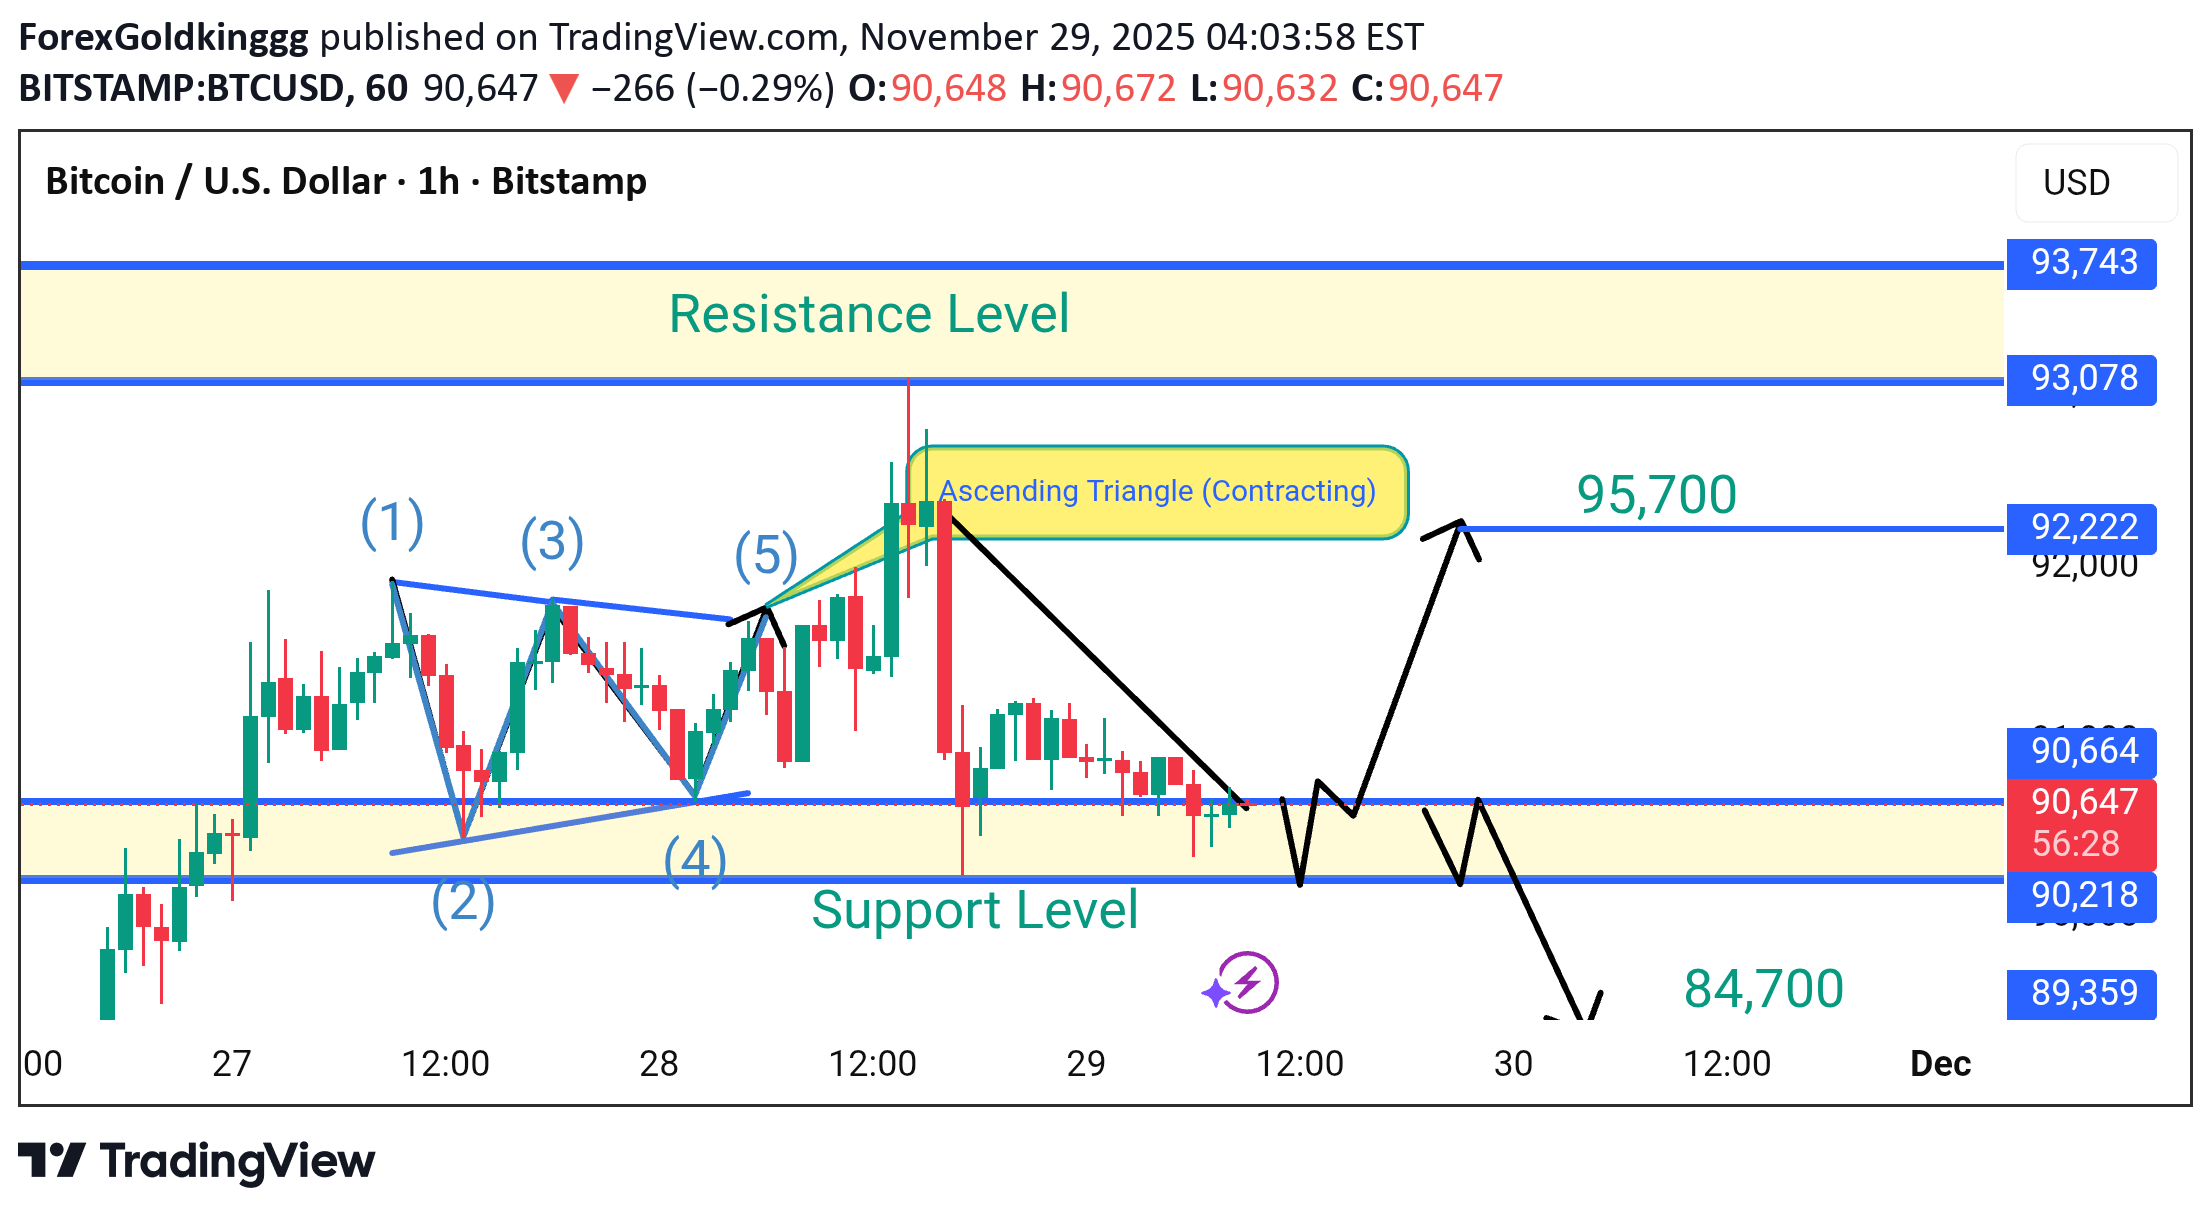
Hello Traders 🙋 Hope Everyone is Ok Let's Talk About our Chart 👇 🔷 1. Market Structure BTC/USD chart shows a Contracting Ascending Triangle, typically a bullish continuation pattern — but only if the breakout happens above the upper trendline. However, price failed to break above and instead moved sideways into support, showing weak bullish momentum. 🔷 2. Key Levels To Watch for us Major Resistance: $93,000 – $93,200 Mid-Range Resistance: $92,200 Support Zone: $89,300 – $90,200 Downside Target: $84,700 Upside Target if breakout happens: $95,700 Price rejected strongly from the triangle resistance. Now sitting on support with weak candle bodies shows seller pressure. Bears are slowly gaining control. 📉 Bearish Scenario (More Likely Now) If price breaks below $89,300 Expect a sharp drop toward ➡️ $86,000 → $84,700 📈 Bullish Scenario Price must break clean above $92,200 If successful: ➡️ Target: $95,700 Summary ✔ Weakening bullish structure ✔ Support testing multiple times ✔ Lower highs forming → bearish pressure ✔ Potential drop to $84,700 if support fails ✔ Only a breakout above $92,200 cancels bearish setup Active Trade 🟢 🚀 Support the Idea! 👍 Like | 🔔 Follow | 💬 Comment | 🔁 Share Your engagement boosts visibility and helps our community stay strong. Share your own charts and setups in the comments — let’s analyse together!