Technical analysis by ForexGoldkinggg about Symbol ETH: Buy recommendation (11/30/2025)

ForexGoldkinggg
تحلیل تکنیکال اتریوم (ETH): هشدار فروپاشی از سقف قیمتی! چه سرنوشتی در انتظار ETH است؟
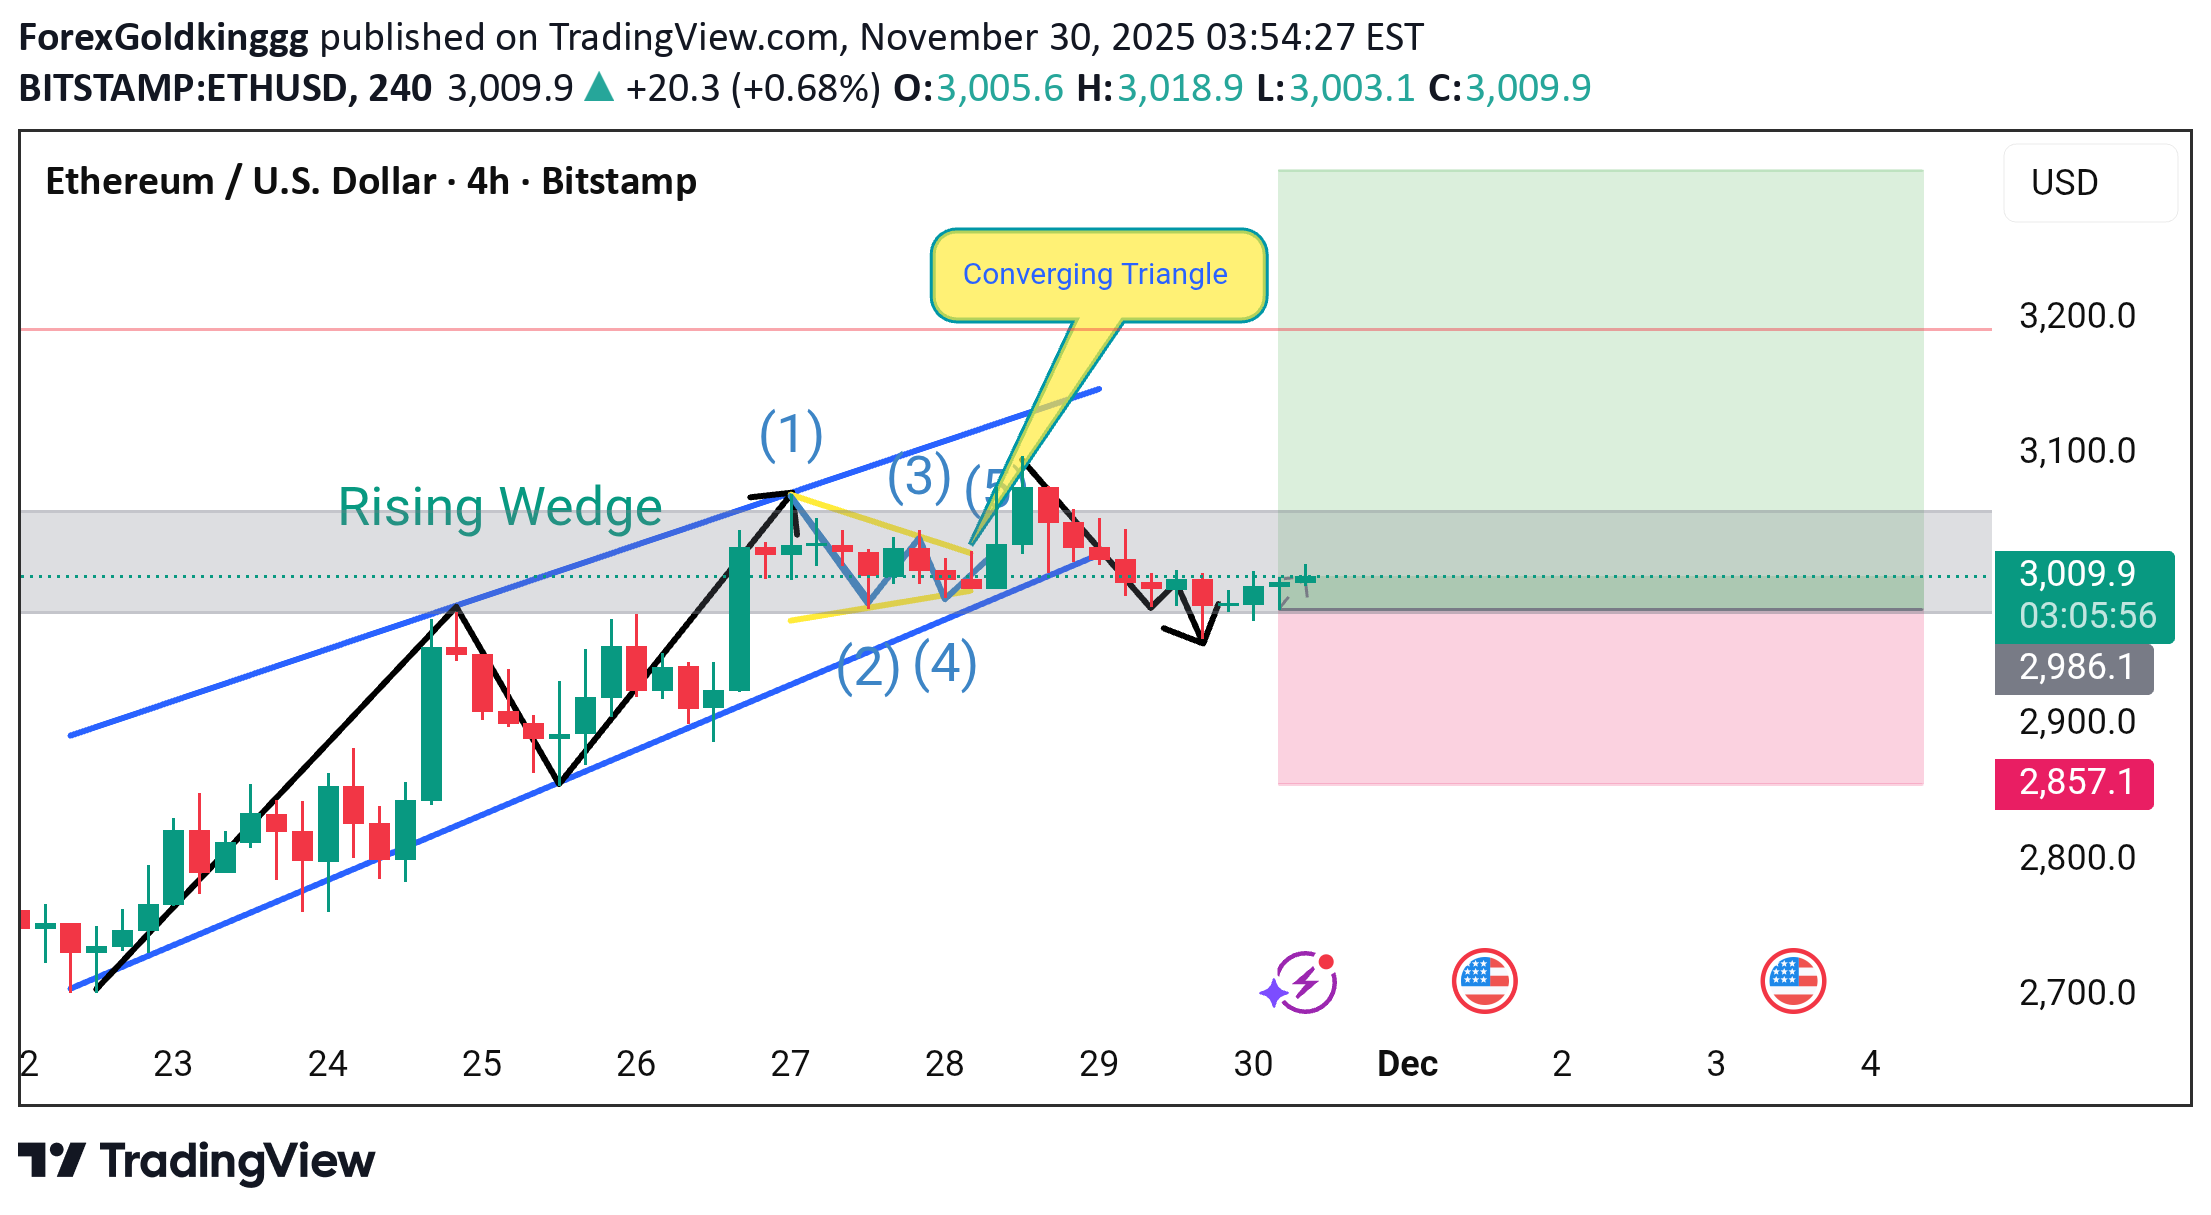
ETH/USD chart shows a combination of Rising Wedge, Elliott Wave structure, and a Converging Triangle, all happening near a major resistance zone around $3000–$3050. 🔍 Structure Breakdown 1️⃣ Rising Wedge (Bearish Pattern) Price moved inside a rising wedge with higher highs & higher lows. Rising wedges usually break downward, indicating sellers gaining control. ➡️ Your chart confirms breakdown after wave (5). 2️⃣ Elliott Wave Count (1–5) You marked a clean 5-wave impulse inside the wedge: Wave (1) – First push upward Wave (2) – Pullback Wave (3) – Strong impulsive rally Wave (4) – Correction Wave (5) – Final extension before reversal After Wave (5), ETH lost bullish momentum → bearish sign. 3️⃣ Converging Triangle (Continuation or Reversal Zone) After wave (5), market formed a small converging triangle. This usually signals indecision before a breakout. But since it formed after a rising wedge, probability of a downside break is higher. Support & Resistance Zones 🔻 Support Zone $2985–$2995 (closest support) If this breaks → next target $2850–$2870 🔺 Resistance Zone $3050–$3200 This is a strong supply zone (your chart’s shaded area). 🎯 Current Position (Price: ~3010) Market Bias: Mild Bearish Reasons: Rising wedge breakdown Price rejected at wave (5) Triangle showing weakness Sellers defending the $3050 zone 📉 Bearish Scenario (Most Likely) If price stays below $3050, ETH likely targets: TP1 → $2985 TP2 → $2890 TP3 → $2850 📈 Bullish Scenario (If Breaks Above $3050) If ETH closes 4H candle above $3050, next upside target: $3150 $3200+