
EconomicanalysAbdulRahman
@t_EconomicanalysAbdulRahman

What symbols does the trader recommend buying?
Purchase History
پیام های تریدر
Filter
EconomicanalysAbdulRahman
BTCاصمود فوق دعم استراتيجي فهل يعود الصعود أم يستكمل التصحيح؟
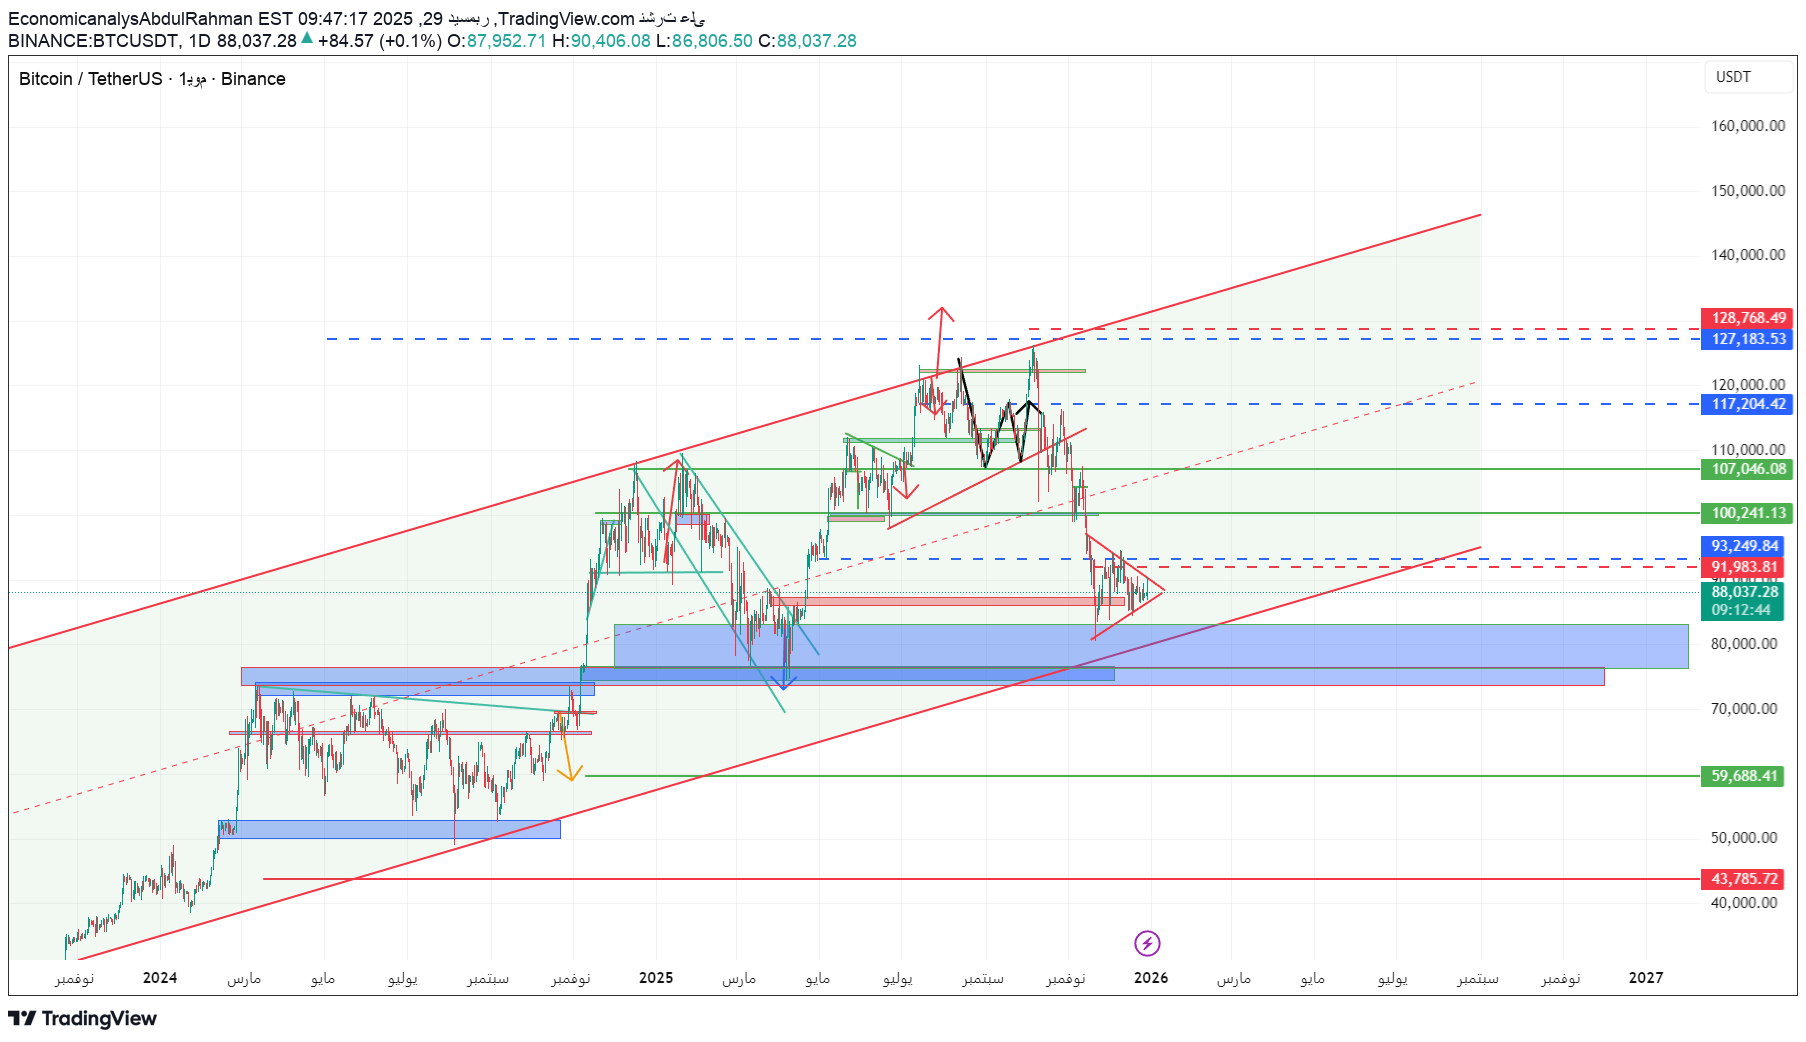
🚨 Bitcoin is at a pivotal stage BTCUSDT | 12-29-2025 📌 Current market situation Bitcoin saw a limited rise as markets opened in the morning The movement came after a clear correction from the last peak The current price is trading near $87,900-$88,000 The market is now in: Stay tuned Low momentum Exciting wait from the New York session ➡️ What we are seeing is not a collapse, but a rebalancing phase within a long-term uptrend. 🔍 General trend (medium and long time) General trend: bullish Price is still: Inside a major uptrend channel Highest historical support areas Latest patch: Removed overbought It restored liquidity to demand areas ➡️ This behavior often precedes a new expansion movement. 🟢 The most important areas of support 1️⃣ 87,000 – 85,500 Real time support Any stability above it is very positive for the American period 2️⃣ 80,000 – 78,000 (very strong demand zone) Institutional catchment area You find: Horizontal support Previous movement base Breaking it only weakens the bullish scenario 3️⃣ 72,000 – 70,000 Medium strategic support It represents the lower limit of the corrective movement 4️⃣ 59,500 – 60,000 Strong historical support It is unlikely to be reached except in a strong negative scenario 🔴The most important areas of resistance 🔺 92,000 – 94,000 Close resistance Its breakout restores bullish momentum 🔺 100,000 – 102,000 Important psychological resistance You need strong liquidity 🔺 117,000 – 120,000 Major resistance The top of the previous oscillation range 🔺 127,000 – 130,000 Historical resistance Ceiling current movement 🇺🇸 Movement forecasts during the American period 🔹 Most likely scenario (60%): Occasional fluctuation inclined to positivity Between: 85,500 92,000 Building a price base 🔹 Alternative scenario (40%): Break 85,500 Retest the 80,000 area Then a strong rebound is possible ❌ A strong bullish rally today is unlikely without news or large trading volume. 📆 Movement forecasts for the end of 2025 As the year approaches close: Make profits Reduce centers Wide fluctuation Likely closing: 🎯 Between $85,000 and $95,000 ➡️ Any close above 90,000 is very positive and paves the way for a strong 2026. 🔮 Overview for 2026 (investment) As long as Bitcoin: Top 70,000 And the top of the ascending channel ➡️ The long-term trend remains bullish 🎯 Possible goals during 2026 (not guaranteed): 120,000 150,000 180,000 (if the market expands) ⚠️ Important tips for traders in 2026 ✅ Don't chase peaks ✅ Buying relied on support, not penetration ✅ Divide the capital ✅ Adhere to strict risk management ✅ Monitor liquidity and volumes ❌ Do not use high leverage ❌ Do not enter out of fear or greed ❌ Do not bet all your liquidity on one deal The market in 2026 will be a professional market... Patience and discipline are more important than expectations. ✍️ Conclusion Bitcoin is currently in a healthy repositioning phase. No breakdown signals, no immediate bullish rally. The real opportunities will be after the base is completed... not during the hype.
EconomicanalysAbdulRahman
اندفاع قوي ثم جني أرباح حاد… الذهب يدخل مرحلة حساسة

🚨 Gold after Gap rose to 4550 Temporary peak or regrouping before a larger movement? Comprehensive analysis | XAUUSD | 12-29-2025 📌 Current market situation Gold opened this morning on a strong bullish Gap The price quickly shot up to $4,550 Then there were clear profit taking operations The price is currently trading near $4,388 All of this happens before the New York session opens ➡️ This movement clearly indicates a short-term peak within a major uptrend. 🔍 First: General technical reading (Price Action) The general trend: clearly bullish But: The final rush was fast and sharp It coincided with the price reaching upper Fibonacci resistances Price behavior suggests that we are facing: Health correction It is not a trend reversal 🔴 Important resistance areas 🔺 4550 – 4540 Peak morning rush Psychological and artistic resistance Hacking it requires: Strong American momentum Clear closure above it 🔺 4485 – 4500 Close resistance Any rise without breaking through it may fail 🔺 4600 – 4700 (maximum resistance) Fibonacci extension 2.618 – 3.618 Not likely today 🟢Basic support areas 1️⃣ 4380 – 4350 Current support Balance zone before New York Persistence above it = positive 2️⃣ 4300 – 4270 Strong pivot support You find: Fibonacci 0.618 Retest a previous fracture A rebound is very likely 3️⃣ 4218 – 4200 Strategic support Breaking it only changes the short-term outlook 4️⃣ 4120 – 4050 Recent support within the uptrend It is unlikely to be reached today 🌊 Wave reading (Elliott – simplified) Movement since the beginning of December shows: Strong driving wave (Wave 5) Peak at 4550: It may be the end of a fifth sub-wave What we see now: ABC potential wave correction Within a larger uptrend 🎯 Objectives of wave correction: A: 4350 B: 4450 C: 4280 – 4300 ➡️ This scenario is very healthy and does not weaken the overall trend. 🇺🇸 New York session forecast today 🔹 Most likely (strongest) scenario: Fluctuation + correction Targeting: 4350 Then try to bounce 🔹Alternative scenario: Stability above 4380 Technical bounce to 4480 Then an occasional fluctuation ❌ A direct and stable breakout above 4550 is unlikely today 📆 Closing expectations for the end of 2025 As long as the price: Top 4200 And the top of the ascending channel ➡️ The annual trend remains very positive 🎯 Weighted Close Range: Between 4300 and 4450 With: Make profits Reducing positions Repositioning before 2026 ⚠️ Important tips for traders ✅ Don't chase peaks ✅ Wait for support areas ✅ Reduce leverage ✅ Commit a stop loss ❌ Avoid buying during peak times ❌ Do not enter with full liquidity The market is now a professional market...there is no room for emotion. ✍️ Conclusion What happened this morning was a peak rush, What we are seeing now is a natural correction within a strong uptrend. The best opportunities are yet to come... Patience here is the smart decision.
EconomicanalysAbdulRahman
4490 ليست النهاية!| قراءة جريئة لمستقبل الذهب بعد القمة التاريخي
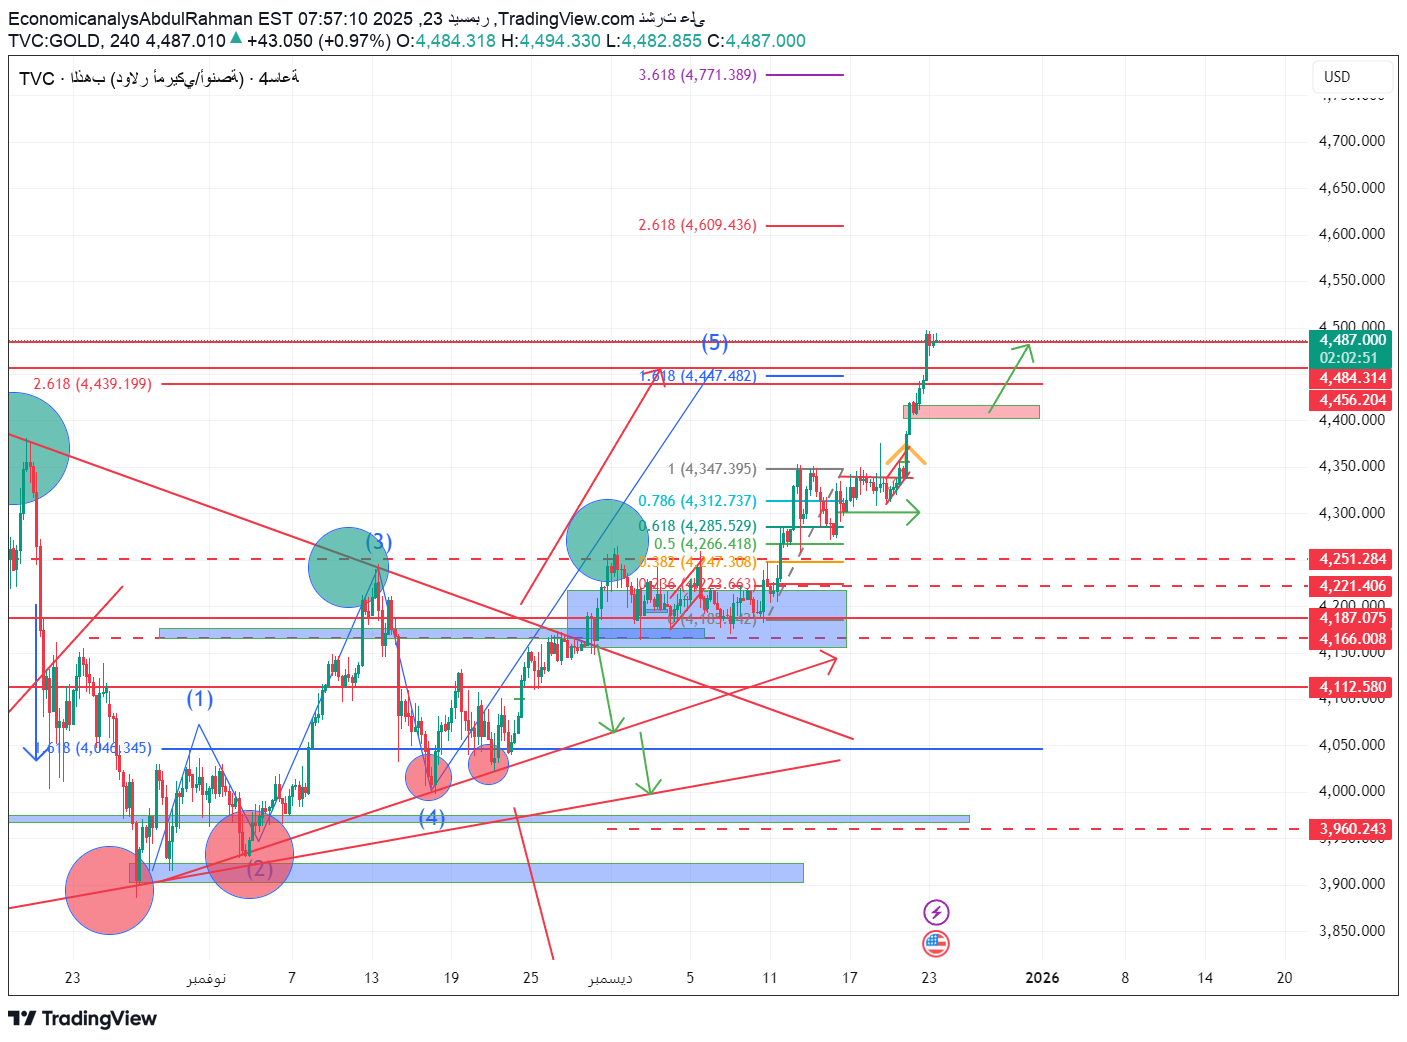
📊 Comprehensive gold analysis | The fifth wave is complete and eyes are turning to 2026 📅 Date: December 23, 2025 📈 Instrument: Gold XAUUSD ⏱ Time frame: 4 hours/daily 🔴The bigger picture – what happened? Gold ended a historic upward journey that started from areas below 4000, and recovered all of its previous losses, reaching today approximately $4490, achieving: ✔️ Completion of the fifth wave (Wave 5) according to Elliott’s theory ✔️ Breaking successive historical peaks without deep corrections ✔️ Strong purchasing momentum supported by technical and fundamental factors But...here begins the most dangerous stage. 🧠 Advanced technical analysis 🔹 Elliott and Fibonacci: Wave (5) is completed near: 1.618 – 2.618 Fibonacci The price is approaching a historical overbought zone 🔹 Current resistance areas: 4490 – 4505 → Immediate resistance 4560 – 4600 → Powerful display area 4700 – 4750 → Stretch target in case of abnormal momentum 🔹 Important support areas: 4475 – 4445 → first support (breakout/confirmation area) 4350 – 4300 → Structural support 4180 – 4120 → Axial support 3960 – 3900 → Long-term strategic support 🔄 Expected scenarios (from now until the beginning of 2026) 🟢 Positive scenario (continuation of the rise): Price stability above 4470 A quick retest then: 🎯 4560 🎯 4700 (speculative extension) This scenario needs: Dollar weakness Escalating economic/geopolitical risks 🔴 Likely scenario (health correction): Failed to hold above 4500 Gradual correction towards: 4350 Then 4180 – 4120 This patch: It is not a reflection Rather, it will regroup before a new wave in 2026 🧭 Projection of the movement to the beginning of 2026 If A-B-C correction is complete: We expect a new momentum wave that may target: 4800 Then 5200 in the medium term Gold historically: He ends the year with momentum The new year begins with a violent movement 🪙 Important tips for traders and holders of physical gold 🔹 Speculators: No chasing to buy at the tops Sell only with confirmation signals Strict capital management 🔹 Investors and Physics: Any correction is a buying opportunity Gold is still a protection asset, not just speculation 🧨 Conclusion Gold does not move in vain... What we are witnessing now is a repricing of the financial system. The current peaks may not be the end, But it is certainly a turning point before a new phase in 2026. 📌 Monitor price behavior... not just price
EconomicanalysAbdulRahman
السوق يحبس أنفاسه: الذهب أمام اختبار مصيري اليوم
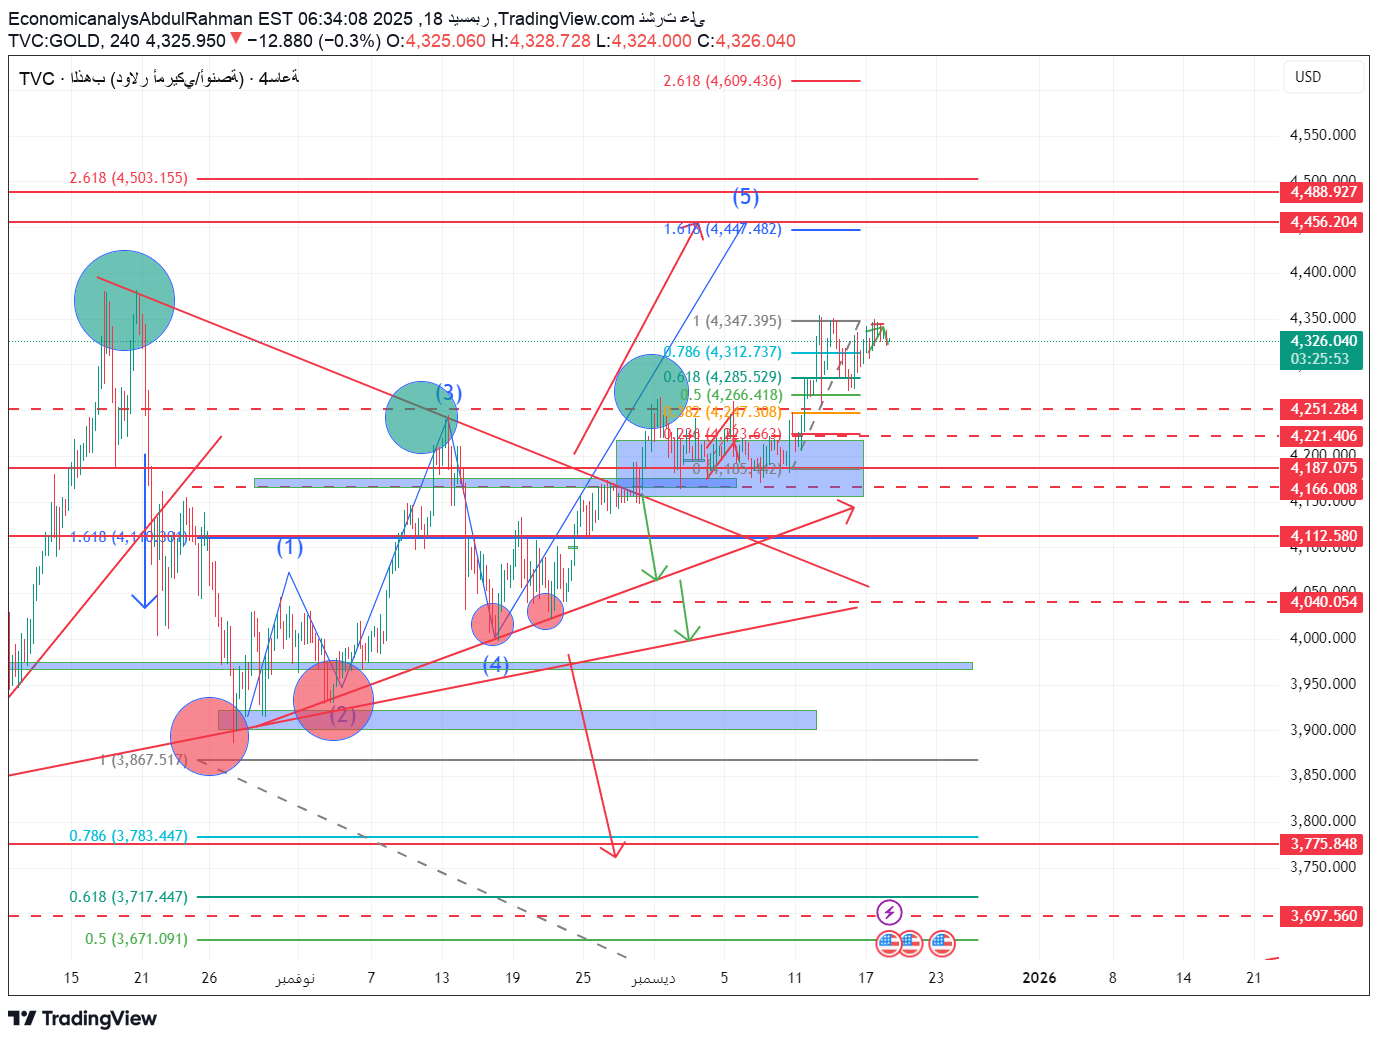
🔍 XAUUSD gold analysis today – Thursday, December 18, 2025 Will gold continue to rise or are we witnessing a correction with the US CPI inflation data? During the recent sessions, gold witnessed a strong recovery and succeeded in recovering all of its previous losses, confirming once again that any decline is still met with clear purchasing demand. The current movement shows that gold is moving within a medium-term upward trend, with natural fluctuation resulting from the markets waiting for the US CPI data for November, which will have a direct impact during the American period. 📈 General trend and price behavior The general trend on the 4-hour time frame: bullish Price lows are constantly rising Price keeps trading above key demand areas The current move represents a consolidation below important resistance and is not a signal of weakness Stability above the 4185 – 4220 area reinforces the positive scenario, and confirms that any decline currently is merely a correction within the upward trend. 🟢 Potential Buy Zones Zone One – Corrective Buying: 4250 – 4220 Strong horizontal support Convergence with Fibonacci levels 0.382 – 0.236 Suitable for daily and speculative trading Zone 2 – Stronger Buy: 4185 – 4165 Clear demand zone on the chart Suitable for swing contracts Third Zone – Investment Purchase / Viscal: 4040 – 4000 Long-term structural support Only breaking this area changes the positive outlook 🔴Sell and profit-taking zones (Sell / TP Zones) 4347 → Nearby resistance and current peak 4447 – 4456 → Fibonacci extension 1.618 4488 – 4503 → Strong historical resistance It is preferable to take partial profits and not sell completely as long as the price is above the main support areas. 🎯 Expected goals if the rise continues In the event of a clear breakthrough and higher stability 4347: First target: 4447 Second goal: 4488 Third goal (extended): 4503 - 4600 later Reaching 4,500 levels before the end of the year remains a strong scenario if economic data is supportive of gold. 📉 Alternative scenario (possible correction) If CPI data is higher than expectations: Breaking 4250 → falling towards 4220 Broken 4185 → Visit 4120 Breaking 4040 only = structural change in trend As long as the price is above 4185, the upward trend remains the likely scenario. 📊 Impact of US CPI data today Data less than expected: dollar weakness, gold’s rise accelerates, resistance is easily breached Higher than expected data: temporary selling pressure and a healthy correction create new buying opportunities It is preferable to avoid entering before the news is released and wait for the movement to stabilize after the announcement. ⏰ Expectations during the American period High volatility Fast movements and stop loss tests The best opportunities appear 15-30 minutes after the data is released 💡 Important tips for traders and holders of physical gold Don't chase price peaks Capital management is essential Splitting trades is better than full entry Viscal Gold Holders: Hold is still the best option The general trend supports continued repricing of gold in the medium term 🟡 Conclusion Gold is still moving with clear positivity as long as it maintains trading above the 4185 area. Any decline in prices represents an opportunity, not a threat, while breaching current resistances may open the way to new historical levels in the coming weeks. The analysis is purely technical and not a direct recommendation, and risk management is the responsibility of every trader.
EconomicanalysAbdulRahman
إذا كنت تتداول الذهب… هذا التحليل لا يجوز تجاهله
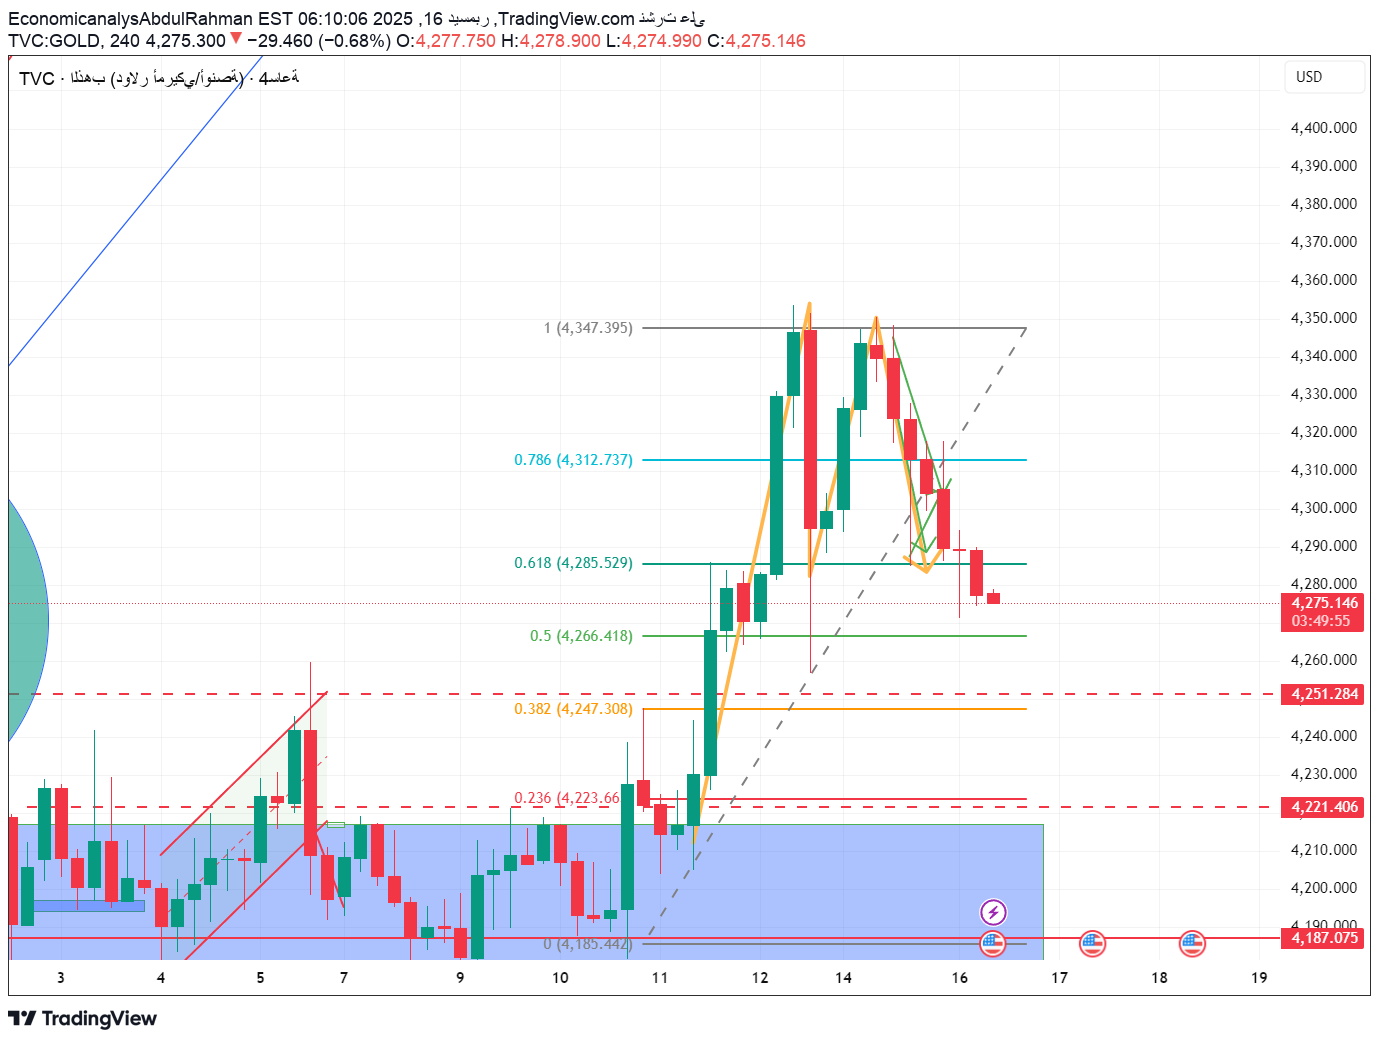
🟡 Gold analysis today | 12/16/2025 - The market is waiting... and today’s decision is distinctly American Despite the limited decline we are currently witnessing, Gold remains in its general bullish structure, and what happens is technically classified as... A healthy correction within an uptrend and not a negative reversal. Today is different from others, Because the American period carries heavy data: Unemployment benefits Employment in the non-agricultural sector Average wages US Retail Sales (November) This data is able to determine the direction of gold for the rest of the week. 🔍 Current technical situation (4-hour frame) Gold is currently trading near 4,275 After a temporary failure to hold above the peak 4,347, This prompted the price to enter a correction wave towards Fibonacci levels. 📌 Price is still: Above the main demand area Within a medium-term ascending channel 🟢 Buying zones (support) 🔹First support: 4,266 – 4,260 (0.5 Fibonacci area + important horizontal support) 🔹The second support - the strongest: 4,221 – 4,187 A clear demand zone, and any reach there is a strong technical buying opportunity Unless the close breaks below 4,180. 🔹 Final support for visa holders: 4,112 – 4,040 Breaking it only changes the short-term scenario, not the general trend. 🔴Selling areas (resistance) 🔸First resistance: 4,312 – 4,320 A higher close quickly restores positive momentum. 🔸 Second resistance: 4,347 A previous peak, and breaching it opens the way to new levels. 🔸 The next upward target: 4,445 – 4,455 Then target higher highs in the short term. 📊 Movement scenarios during the American period 🔼 Positive scenario (most likely): Weaker data than expected Or a slowdown in wages and employment ➡️ Dollar weakness ➡️ Gold bounces from support areas ➡️ Retest 4,320 then 4,347 🔽 Negative scenario: Very powerful data A sudden rise in wages or employment ➡️ Temporary pressure on gold ➡️ Falling towards 4,221 – 4,187 ➡️ But without a structural break unless we close below 4,180 🧠 Important tips for traders and visa holders ✔️ Don't chase the price before the data ✔️ It is better to wait for the reaction after the news ✔️ Buying from support is stronger than buying from peaks ✔️ Physical Gold Holders: Any decline towards demand areas is considered a gathering opportunity, not a fear ✨ Conclusion What we see now is not weakness... Rather, it is a smart repositioning before a larger movement. Gold still acts as a hedging asset par excellence. Today's US data may be the next spark. 📌 General trend: bullish 📌 Momentum: postponed, not broken
EconomicanalysAbdulRahman
رمز الذهب: مثلث السرّي يقود إلى قفزة تاريخية فوق 5200 دولار!
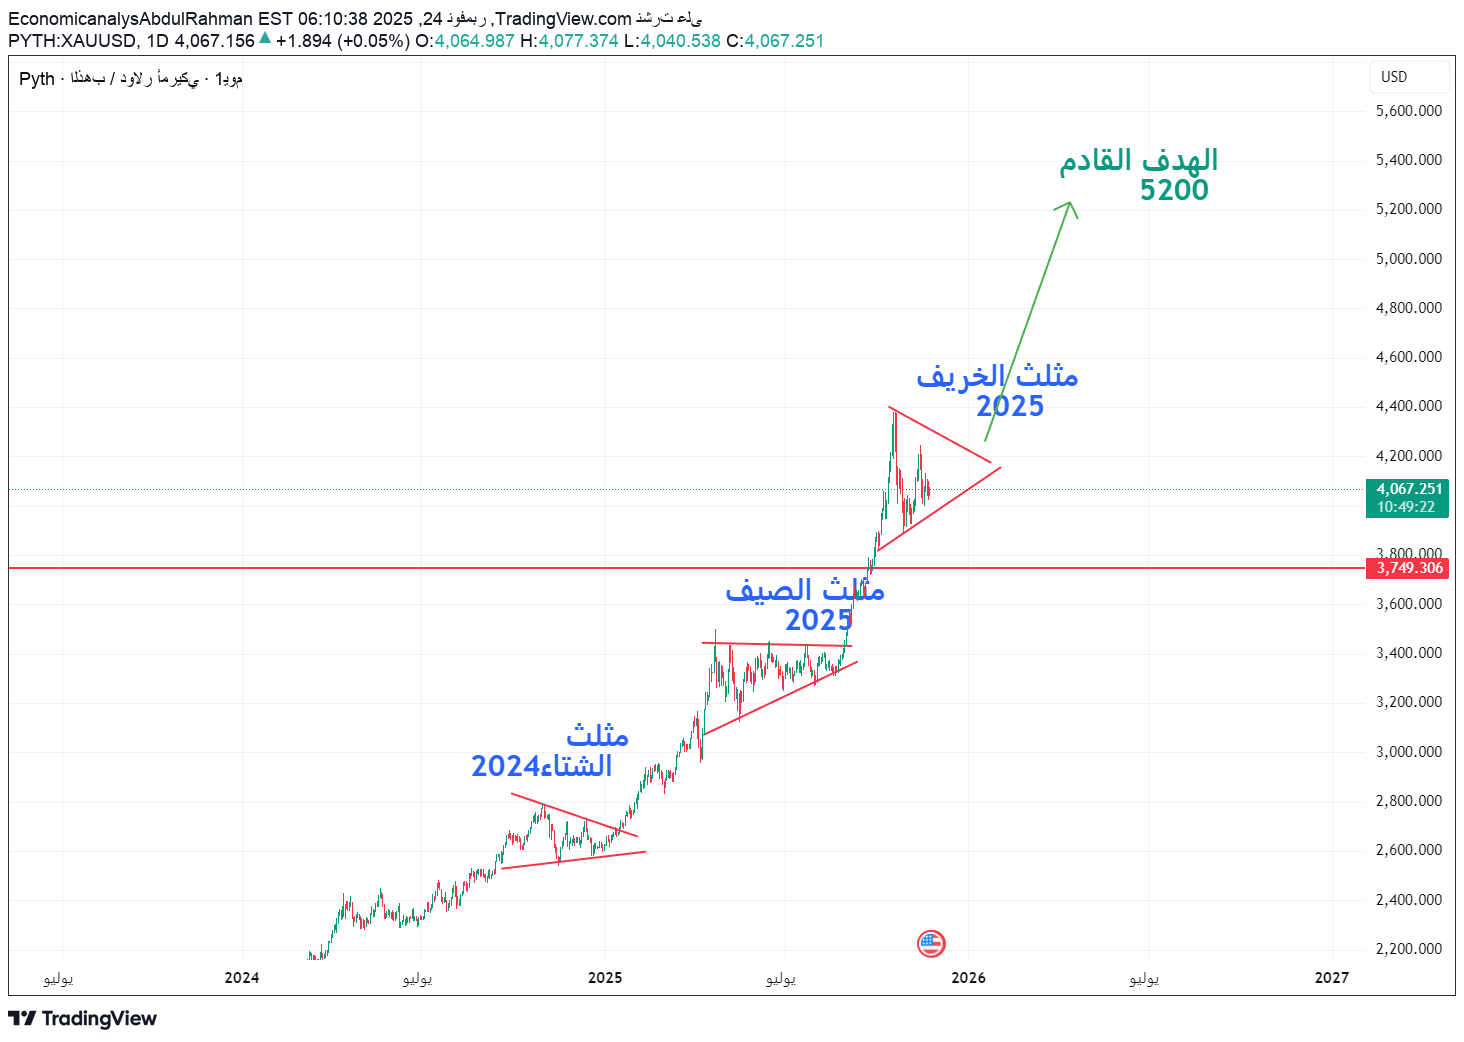
Technical + fundamental reading on the “Autumn Triangle 2025” pattern and setting the next target 5200 Gold returns today to prove that it is not just a hedging tool... but rather the new leading asset of the global financial system. On the chart, the same technical imprint that preceded the previous strongest upward waves is repeated, but this time within a larger and deeper structure: the 2025 Autumn Triangle. This pattern is not just consolidation... but rather a stage of price pressure before a breakthrough movement that may change the rules of the game during 2026. 🔹 First: Technical analysis - repeating a pattern that is not repeated often On the chart (attached): Gold ended the winter triangle 2024 → followed by a strong rise. Then the summer triangle of 2025 was formed → a stronger bullish explosion. Now we are inside the 2025 Autumn Triangle... which is larger, wider, and extends over a much higher price range. Why is this model important? Huge accumulation at historical peaks → indicates the entry of institutions, not speculators. Decreased fluctuation volume within the triangle → price pressure in preparation for the launch. The structure of the waves within the pattern indicates the end of the fourth wave and preparation for the fifth impulsive wave. Main technical levels: Pivotal support: 3740–3800 (Breaking it only delays the rise, but does not cancel it within the general trend) Time-price zone for peak pressure: end of November – mid-December 2025 The upper side of the triangle: the key to the explosion The complete technical goal of the model: 🔥 4800 - 5200 dollars The target of 5200 is not a random number... but a direct measurement of the length of the previous wave (summer window wave) + projection of Fibonacci extensions + measurements of previous triangle breakouts. 🔹 Second: Fundamental analysis - why does everything support a breakout? Today’s fundamentals are not neutral...but are aligned in an unprecedented way in favor of gold: 1) The Fed is on its way to cut rates Markets are pricing interest at 3.75% through 2026. This means: Dollar weakness Real yield decline High demand for hard assets 2) Central bank purchases More than 8,200 tons since 2013 – the largest buying wave in modern times. 95% of central banks plan to buy more. This is not a coincidence... but a slow restructuring of the global monetary system. 3) Geopolitical tensions Middle East Pacific Ocean Eastern Europe All of which fuel the demand for gold as a first resort. 4) Mine supply is slowing down The annual increase has become the weakest in 12 years. Basic takeaway: What is happening is not an “up cycle”... Rather, it is a re-pricing of the system where gold returns to becoming a global reserve asset. 🔹 **Third: The expected scenario** 📈 Main scenario (likely): Bullish breakout Going beyond the side of the triangle → opening the way towards: 4200 4500 4800 5200 (main target) A big triangle means a big wave… just like in the summer of 2025 but on a larger scale. 📉 Alternative scenario (unlikely but possible): Correction to 3740–3800 Rebound and rise again The uptrend remains strong as long as we do not break 3740 with clear daily closings 🟩 The golden conclusion Gold is now in a pressure phase ahead of the biggest possible move in the next decade. The similarity between the 2024 and 2025 triangles adds tremendous weight to the breakout scenario. At the same time… Global fundamentals create a rare environment that pushes the price above 5000 easily. This is no ordinary climb... Rather, it is a move to a completely new price level.
EconomicanalysAbdulRahman
آیا طلا به مرز 4500 دلار میرسد؟ تحلیل تکنیکال و موج شماری طلای امروز!
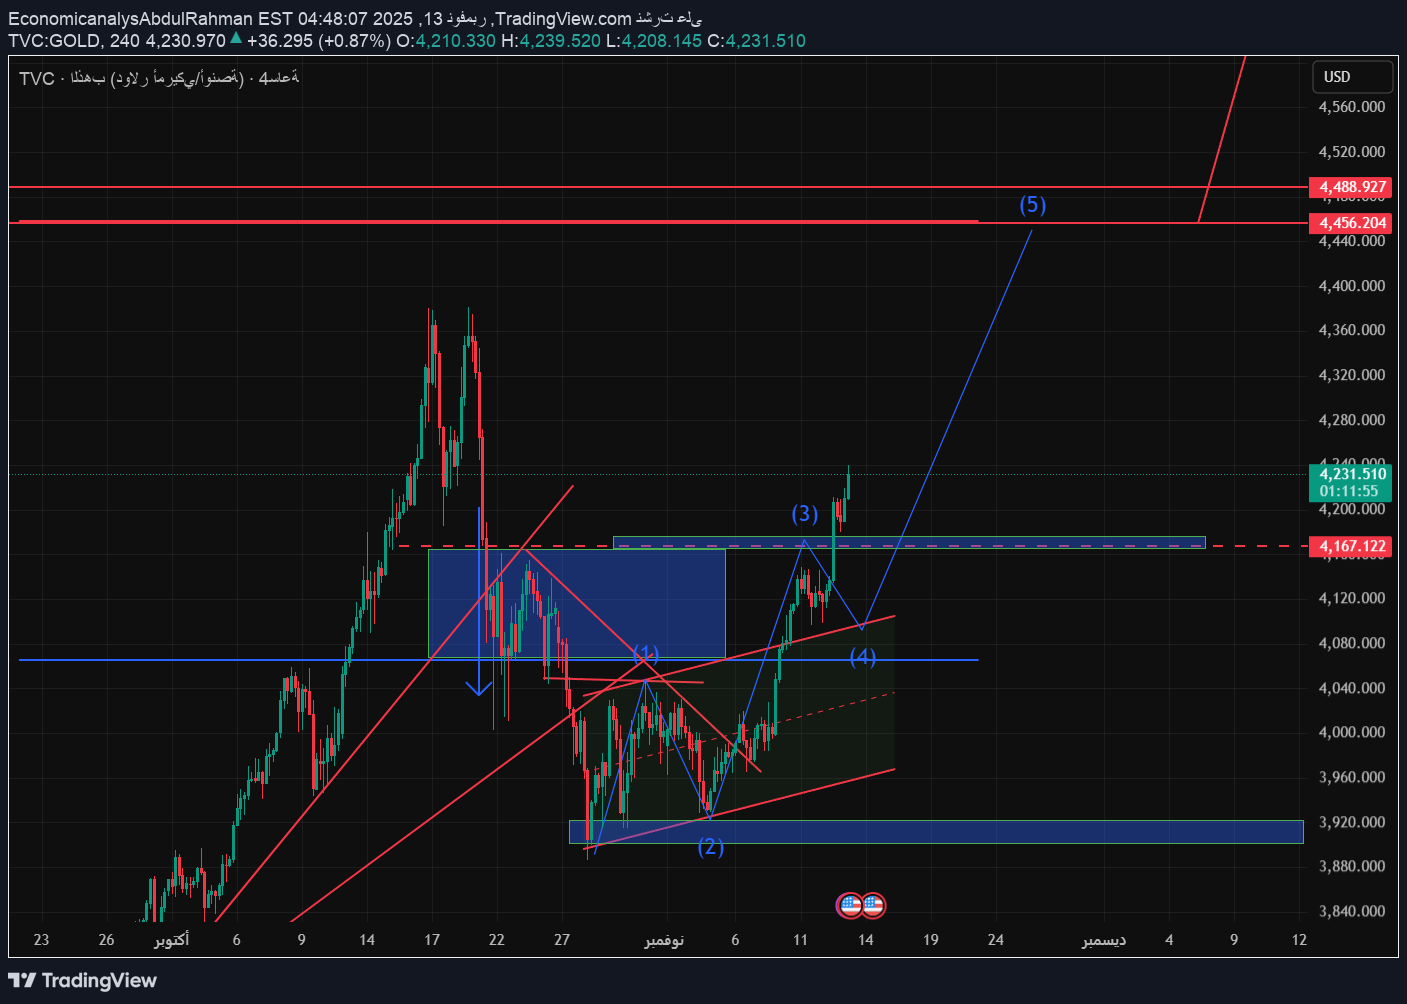
Gold analysis for November 14, 2025 🔥 Gold today shows a clear continuation of upward momentum after breaching the pivotal resistance area at $4,167 per ounce, which is the point that constituted a barrier to the third wave in the wave structure shown in the drawing. This strong breakthrough confirms the completion of the fourth corrective wave, and paves the way for the fifth wave, which may target the levels of $4450 - $4488 per ounce in the near term. 📈 General trend: Bullish momentum remains dominant in the short to medium term, especially with the price maintaining trading above the new support at $4,100, which indicates that buyers continue to control the path. 💰 Potential buying areas: Between $4140 – $4160, provided that a daily close is maintained above this range. Strengthening positions in the event of any corrective decline towards $4070 - $4100. 🚫 Nearby selling and resistance areas: The area between $4450 – $4490 represents the first potential profit taking zone. Beware of any strong price rejection at these levels, as a short-term correction movement may begin from them. 🔔 Tips for traders: Be patient in opening selling positions before certain reversal signals appear. Follow US inflation data and dollar sessions, as they will have a direct impact on the current momentum. For holders of physical gold: It is recommended to hold positions and not sell currently, as the general trend is still positive as long as gold is above $4,100. 📊 A final technical look: Gold has an opportunity to complete the fifth upward wave within the wave pattern, which may extend if the US dollar continues to weaken to above $4,500 in the coming weeks.
EconomicanalysAbdulRahman
موجة الذهب الخامسة بدأت: هل نصل للقمة 4450؟ (تحليل فني إليوت)
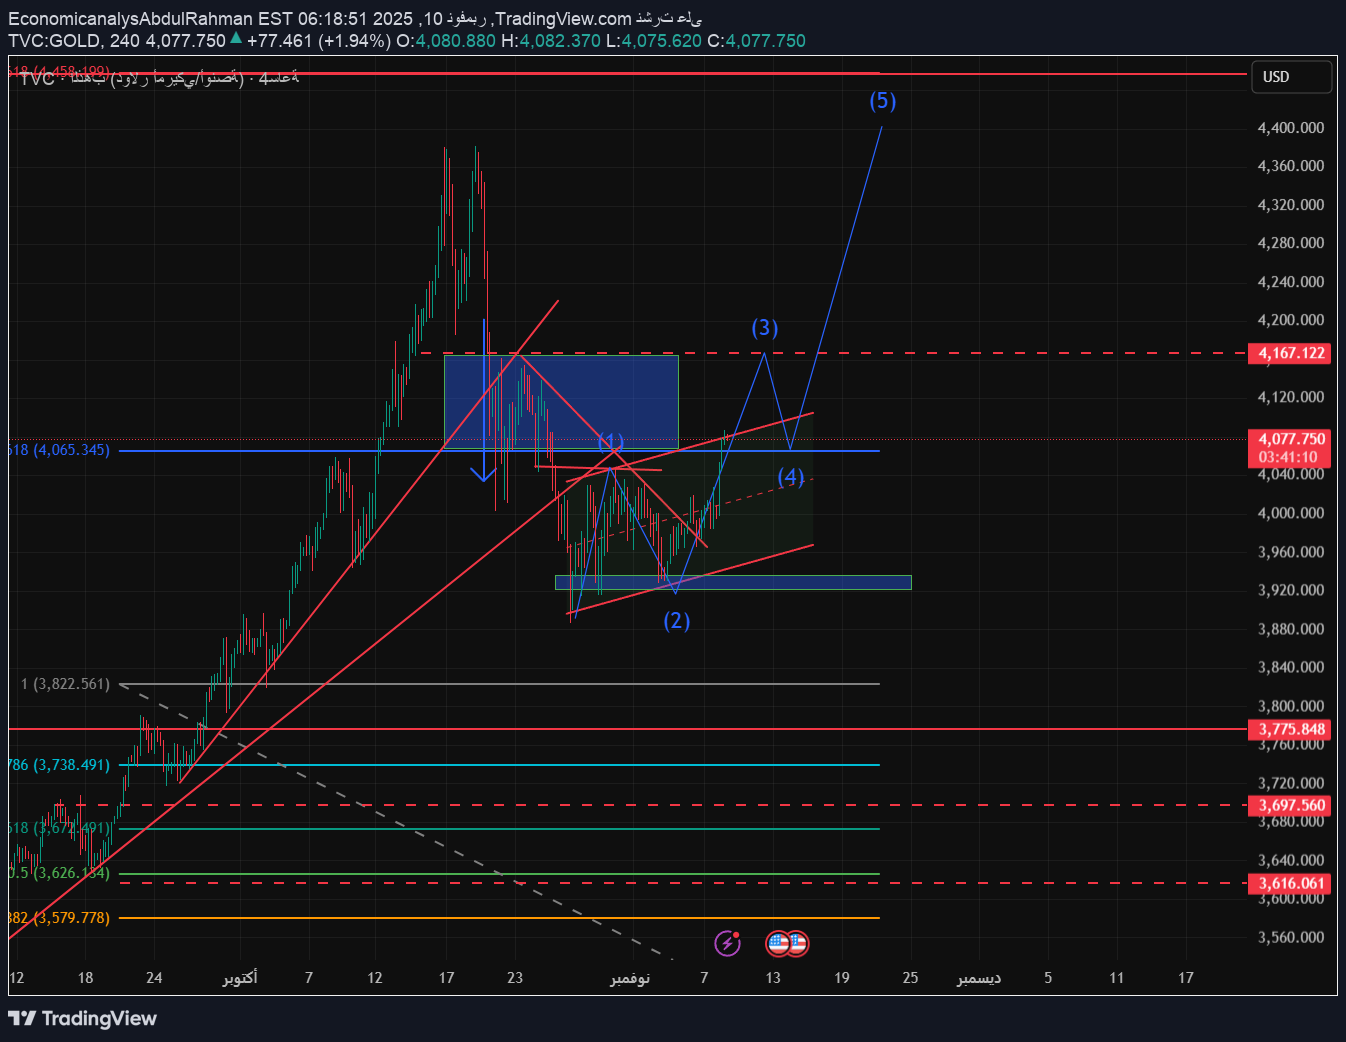
🟡 Gold Analysis (XAU/USD) On November 10, 2025 After a series of strong movements that gold witnessed over the past weeks, it seems that we stand today at an important technical crossroads, as features of the completion of a deep correction appear within the fourth wave of the major impulse cycle, paving the way for a new start that may carry the sparkle of the fifth wave! 🔶 Current waveform (Elliott Wave Perspective) By tracking the price structure on the daily and four-hour frames, we notice the following: The previous impulse wave ended near 4,458 levels, where it formed the top of a major wave (3). The subsequent decline to the 3,900 – 3,950 area came in the form of a compound correction (W–X–Y) representing wave (4). Now, after breaching the downward trend line in red and the price rebounding above 4,065, the features of wave (5) have begun to appear, which is expected to extend towards 4,167 as a first target, then towards 4,300 – 4,450 if the positive momentum continues. 💥 Technical momentum supports the bullish scenario A clear break of the old downtrend line. Consolidation above pivotal support 4,065 confirms the transfer of strength to buyers. A consistent price structure indicates the beginning of a new expansion phase, supported by advancing Elliott angles. The current move is likely to be part of the sub-impulse wave (i–ii–iii–iv–v) within the fifth major wave, as we have most likely entered the third sub-wave (iii) — which is usually the strongest in terms of momentum. 📈 Possible path during the day As long as the price maintains its closes above 4,065, the general trend remains positive with the possibility of seeing a price extension towards 4,167 as the first resistance area. Closing the four-hour candle above it will reactivate wave (5) towards broader targets in the 4,300 – 4,450 range. As for any break below 3,950, it will be considered a temporary correction within the second sub-wave, before the upward trend resumes. 🧭 Conclusion Gold still maintains its technical lustre, and the fifth wave is looming on the horizon. The positive wave scenario remains valid as long as we do not break 3,950 bearish, As for exceeding 4,167, it will be a spark to move towards new peaks that may take us back to the areas of 4,400 and more. ✨ Advice for traders: Stay tuned for short-term corrections, as every pullback within the 4,050-4,000 range could be a valuable opportunity to join the fifth wave before it is complete.
EconomicanalysAbdulRahman
الذهب عند مفترق طرق: هل ينطلق صعوداً أم يهبط؟ تحليل المثلث الحاسم قبل جلسة أمريكا!
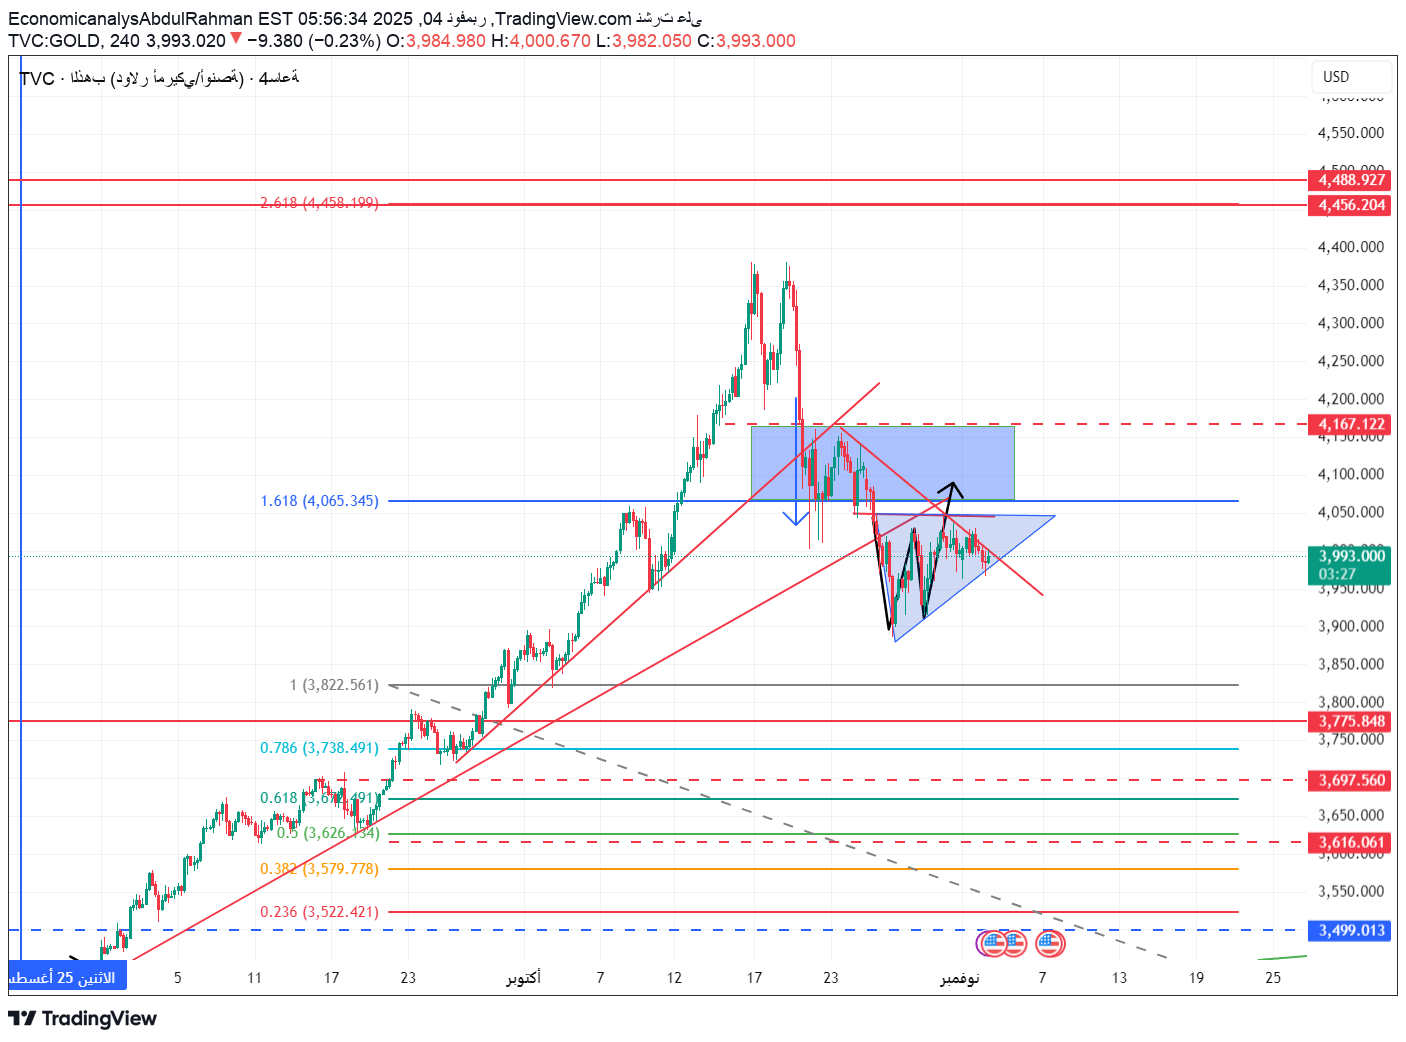
Gold is currently moving around $3,995 per ounce within a 4-hour symmetrical triangle pattern, in a critical consolidation phase after a corrective downward wave from its previous peak at +4,450. Today, the market is awaiting influential US economic data that may determine the upcoming trend, making this session one of the most important sessions of the week. 📊 General artistic mode (4 hour frame): The price is currently in a narrow range between 3,975 – 4,020, which is the technical decision zone. The general trend in the medium term is still corrective and bearish, but there are indications of the beginning of building a potential support base in preparation for a new upward wave in the event of an upward breach. 🔹 Important support areas: 3,975 – 3,960 → Instantaneous support, breaking it heralds an extension of the correction towards lower levels. 3,775 – 3,750 → Medium term support representing a previous corrective bottom. 3,650 – 3,616 → 0.618 Fibonacci support and a strong order position. 3,522 – 3,500 → Long-term strategic support and investment accumulation opportunity. 🔺 Important resistance areas: 4,020 → the decisive point to confirm the upward trend, and breaching it is considered a positive signal. 4,065 → The first target at the 1.618 Fibonacci extension. 4,167 → major resistance within the previous distribution range. 4,456 – 4,488 → Major peaks and target of the driving wave in the event of a clear breakout. 🎯 Technical expectations for the American period: Bullish scenario (58% probability) If the 4-hour candle closes above 4,020 with an increase in trading volume, the upward movement is expected to extend to 4,065 and then 4,167. Breaking this level will open the way towards 4,250 in the short term. Bearish scenario (42% probability) If we break the 3,975 level and close below it, the decline will likely extend towards 3,775 and then 3,650. Continued selling pressure will depend on the strength of US dollar data and bond yields during the session. ⚙️ Important tips for day traders: Avoid entering before the trend is confirmed, as the triangle usually makes fake breakouts. Watch the price close above 4,020 or below 3,975 to determine the real movement path. Commit to strict capital management with a risk limit of no more than 1.5%. Do not rush before the release of America's data, as the real movement usually begins with the opening of the New York session. 🪙 Tips for holders of physical gold: As long as the price is above 3,750 there are no worrying sell signals, and you can continue to hold. Any drop towards 3,500 is an ideal opportunity to reaccumulate for long-term investors. It is best to monitor the closings for the week; A break of 3,650 would only be a temporary warning to hedge a fraction with dollars or bonds. 🔍 General summary: Gold stands today at a crossroads between continuing the correction or resuming the upward trend. The area between 3,975 and 4,020 is the “decision zone” that will determine where the market goes for the rest of the week. The likely trend: neutral and slightly upward, with a probability of 58% upside versus 42% downside. 📢 Write your opinion in the comments 👇 Do you think that gold will break the 4,020 level and start a new rising wave? Or will it break 3,975 and return to correct towards 3,775? Share with me your vision and analysis 👇
EconomicanalysAbdulRahman
اجتماع الفيدرالي: هل يشعل الذهب نحو قمة 4,200؟ تحليل صادم لسيناريو خفض الفائدة
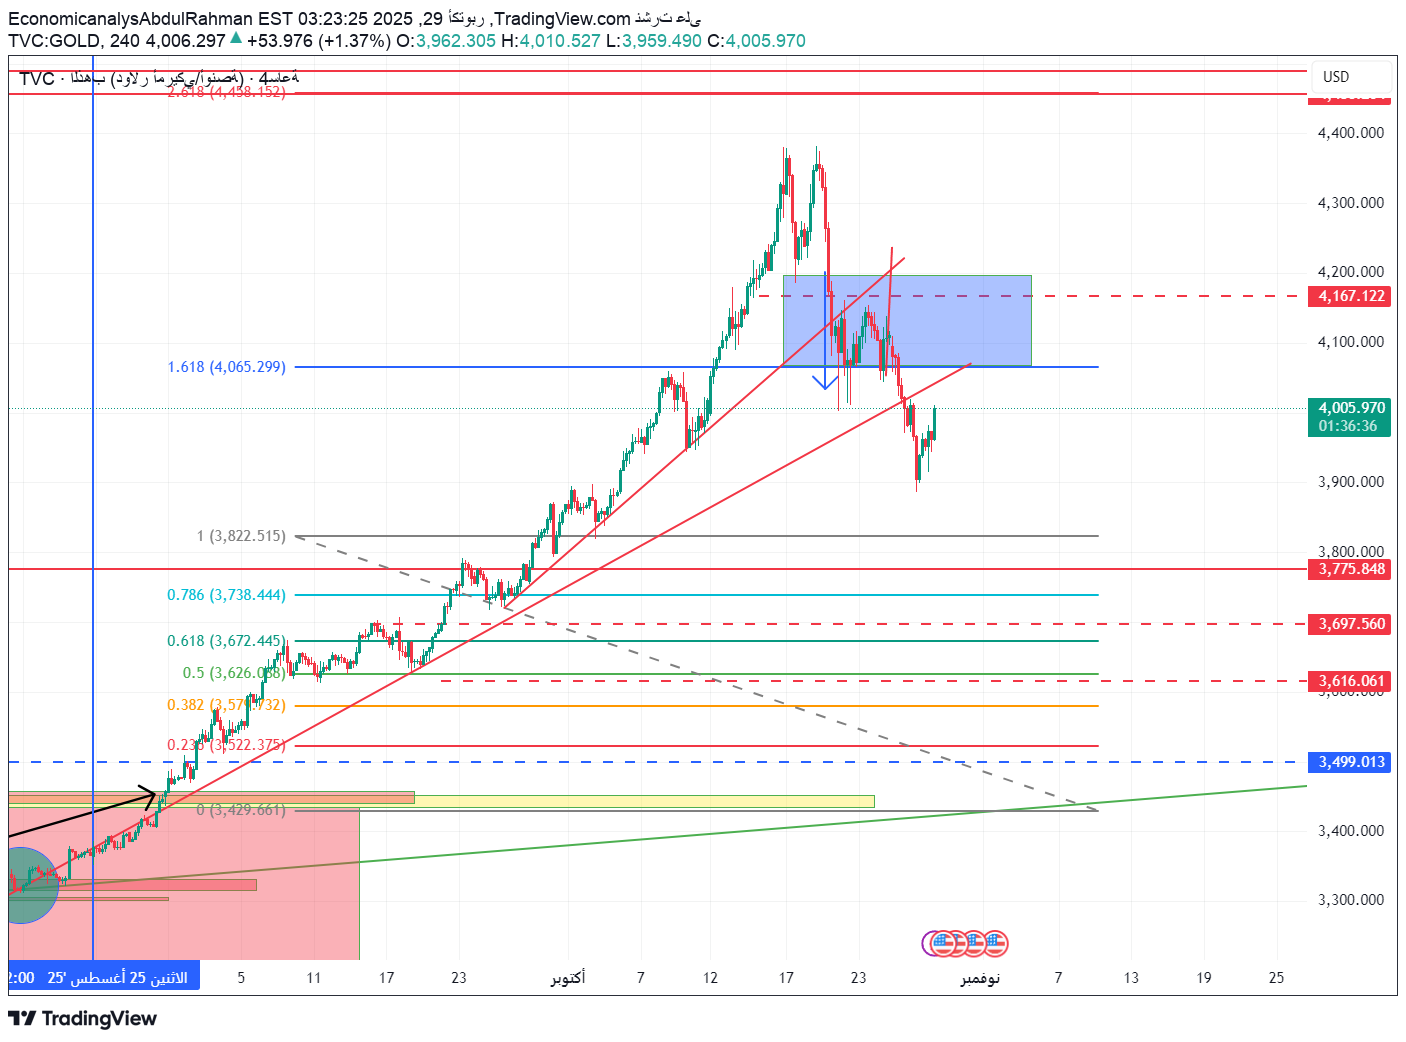
🔹 XAUUSD Gold Analysis – Tuesday, October 29, 2025 Author: EconomicanalysAbdulRahman Time frame: 4 hours The general trend: corrective bullish tending to a positive reversal 🧭 Overview Gold is regaining momentum above the 4,000 level after a strong correction wave that reached 3,900, as clear signs of reversal began to appear before the US Federal Reserve meeting. Markets are now pricing in a rate cut with a 98% probability, which strongly supports gold's upward trend and makes current levels a pivotal point for the start of a new wave. 🔸 Important resistance areas AreaDescription 4,065 – 4,100 pivotal resistance (Fibo 1.618) – breaching it confirms the bullish shift. 4,167 – 4,200 Strong supply area – short-term upside target. 4,456 – 4,488 Fibo Extension 2.618 – Possible target after stabilizing the cut. 🔹Main support areas Area approx 3,900 – 3,880 pivotal support and the bottom of the current retracement. 3,775 – 3,740 Fibo support 0.786 and previous demand area. 3,697 – 3,616 Strategic support in the medium term. 3,499Long-term support and a major structural bottom. 📈 Current artistic trend Short-term: corrective bullish tending to turn positive. Medium term: positive on condition of closing above 4,100. Long term: bullish as long as 3,616 is not broken. 📊 Expected scenarios for the American period 🔺 Basic scenario (weighted 70% - rate cut 98%) A rate cut of 25 basis points will strongly support gold. Before the decision: fluctuation between 3,980 – 4,050. After the decision: an accelerated upward push towards: 🎯 First goal: 4,100 🎯 Second goal: 4,167 🎯 Third goal: 4,200 – 4,300 Bullish confirmation: 4-hour candle closes above 4,100. 🔻 Alternative scenario (Powell’s cautious or tough tone) If Powell's tone is cautious, we may see a short correction towards 3,950-3,900. This decline will be considered a new buying opportunity as long as 3,880 is not broken. ⚙️ Technical indicators RSI: A rebound from the 40 area towards 55 – the beginning of positive momentum. MACD: A confirmed bullish crossover. Candles: Bullish Engulfing pattern at the bottom of 3,900. 💡 Tips for traders 🎯 For short-term (Intraday) speculators: Entry to buy from 3,980 – 4,000 Stop loss below 3,880 Objectives: 4,100 4,167 4,200 ⚠️ It is preferable to wait until the interest rate decision is issued or the start of the press conference to avoid high volatility. 🪙For traders of physical gold: Current prices represent an excellent gathering area ahead of the new monetary easing cycle. Gradually build positions from 3,900 and below with consolidation of positions after daily close above 4,100. Average target: 4,300 - 4,450 during the next quarter. 🏦 Fed meeting and Jerome Powell’s speech Markets are almost 98% sure of a cut, so the key will be Powell's tone. Dovish tone (hint of further downgrade) → immediate rise for gold towards 4,200+. Cautious or balanced tone → limited correction and then resuming the rise. 📌 General recommendation 🔹 Short trend: corrective bullish 🔸 Intermediate trend: positive provided it closes above 4,100 🔹 Long trend: Strongly bullish as interest rates continue to be cut 🎯 Strategy: Buy from corrections and hold long positions 🏷️ Tags #XAUUSD #Gold #TechnicalAnalysis #Fed #JeromePowell #Rate_Cut #Trading #Economy #TradingView #GoldAnalysis
Disclaimer
Any content and materials included in Sahmeto's website and official communication channels are a compilation of personal opinions and analyses and are not binding. They do not constitute any recommendation for buying, selling, entering or exiting the stock market and cryptocurrency market. Also, all news and analyses included in the website and channels are merely republished information from official and unofficial domestic and foreign sources, and it is obvious that users of the said content are responsible for following up and ensuring the authenticity and accuracy of the materials. Therefore, while disclaiming responsibility, it is declared that the responsibility for any decision-making, action, and potential profit and loss in the capital market and cryptocurrency market lies with the trader.