Technical analysis by EconomicanalysAbdulRahman about Symbol PAXG: Buy recommendation (11/4/2025)

EconomicanalysAbdulRahman
الذهب عند مفترق طرق: هل ينطلق صعوداً أم يهبط؟ تحليل المثلث الحاسم قبل جلسة أمريكا!
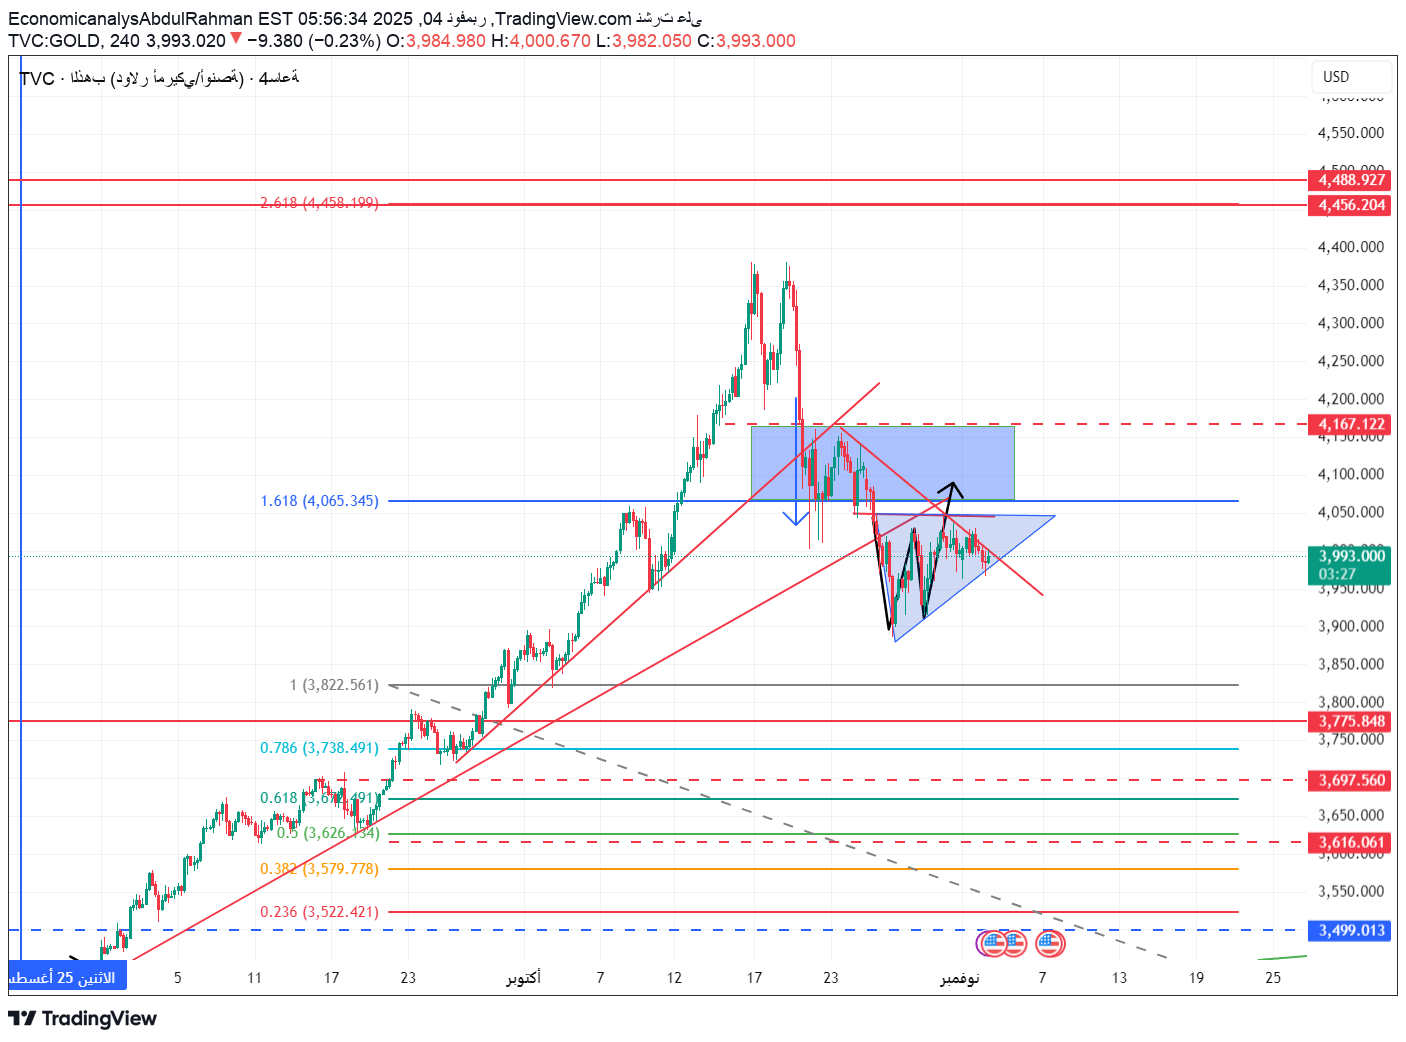
Gold is currently moving around $3,995 per ounce within a 4-hour symmetrical triangle pattern, in a critical consolidation phase after a corrective downward wave from its previous peak at +4,450. Today, the market is awaiting influential US economic data that may determine the upcoming trend, making this session one of the most important sessions of the week. 📊 General artistic mode (4 hour frame): The price is currently in a narrow range between 3,975 – 4,020, which is the technical decision zone. The general trend in the medium term is still corrective and bearish, but there are indications of the beginning of building a potential support base in preparation for a new upward wave in the event of an upward breach. 🔹 Important support areas: 3,975 – 3,960 → Instantaneous support, breaking it heralds an extension of the correction towards lower levels. 3,775 – 3,750 → Medium term support representing a previous corrective bottom. 3,650 – 3,616 → 0.618 Fibonacci support and a strong order position. 3,522 – 3,500 → Long-term strategic support and investment accumulation opportunity. 🔺 Important resistance areas: 4,020 → the decisive point to confirm the upward trend, and breaching it is considered a positive signal. 4,065 → The first target at the 1.618 Fibonacci extension. 4,167 → major resistance within the previous distribution range. 4,456 – 4,488 → Major peaks and target of the driving wave in the event of a clear breakout. 🎯 Technical expectations for the American period: Bullish scenario (58% probability) If the 4-hour candle closes above 4,020 with an increase in trading volume, the upward movement is expected to extend to 4,065 and then 4,167. Breaking this level will open the way towards 4,250 in the short term. Bearish scenario (42% probability) If we break the 3,975 level and close below it, the decline will likely extend towards 3,775 and then 3,650. Continued selling pressure will depend on the strength of US dollar data and bond yields during the session. ⚙️ Important tips for day traders: Avoid entering before the trend is confirmed, as the triangle usually makes fake breakouts. Watch the price close above 4,020 or below 3,975 to determine the real movement path. Commit to strict capital management with a risk limit of no more than 1.5%. Do not rush before the release of America's data, as the real movement usually begins with the opening of the New York session. 🪙 Tips for holders of physical gold: As long as the price is above 3,750 there are no worrying sell signals, and you can continue to hold. Any drop towards 3,500 is an ideal opportunity to reaccumulate for long-term investors. It is best to monitor the closings for the week; A break of 3,650 would only be a temporary warning to hedge a fraction with dollars or bonds. 🔍 General summary: Gold stands today at a crossroads between continuing the correction or resuming the upward trend. The area between 3,975 and 4,020 is the “decision zone” that will determine where the market goes for the rest of the week. The likely trend: neutral and slightly upward, with a probability of 58% upside versus 42% downside. 📢 Write your opinion in the comments 👇 Do you think that gold will break the 4,020 level and start a new rising wave? Or will it break 3,975 and return to correct towards 3,775? Share with me your vision and analysis 👇