
Cryptollica
@t_Cryptollica

What symbols does the trader recommend buying?
Purchase History
پیام های تریدر
Filter
Cryptollica
XRP/USD 2-Week Chart Analysis: Is History Repeating Itself?
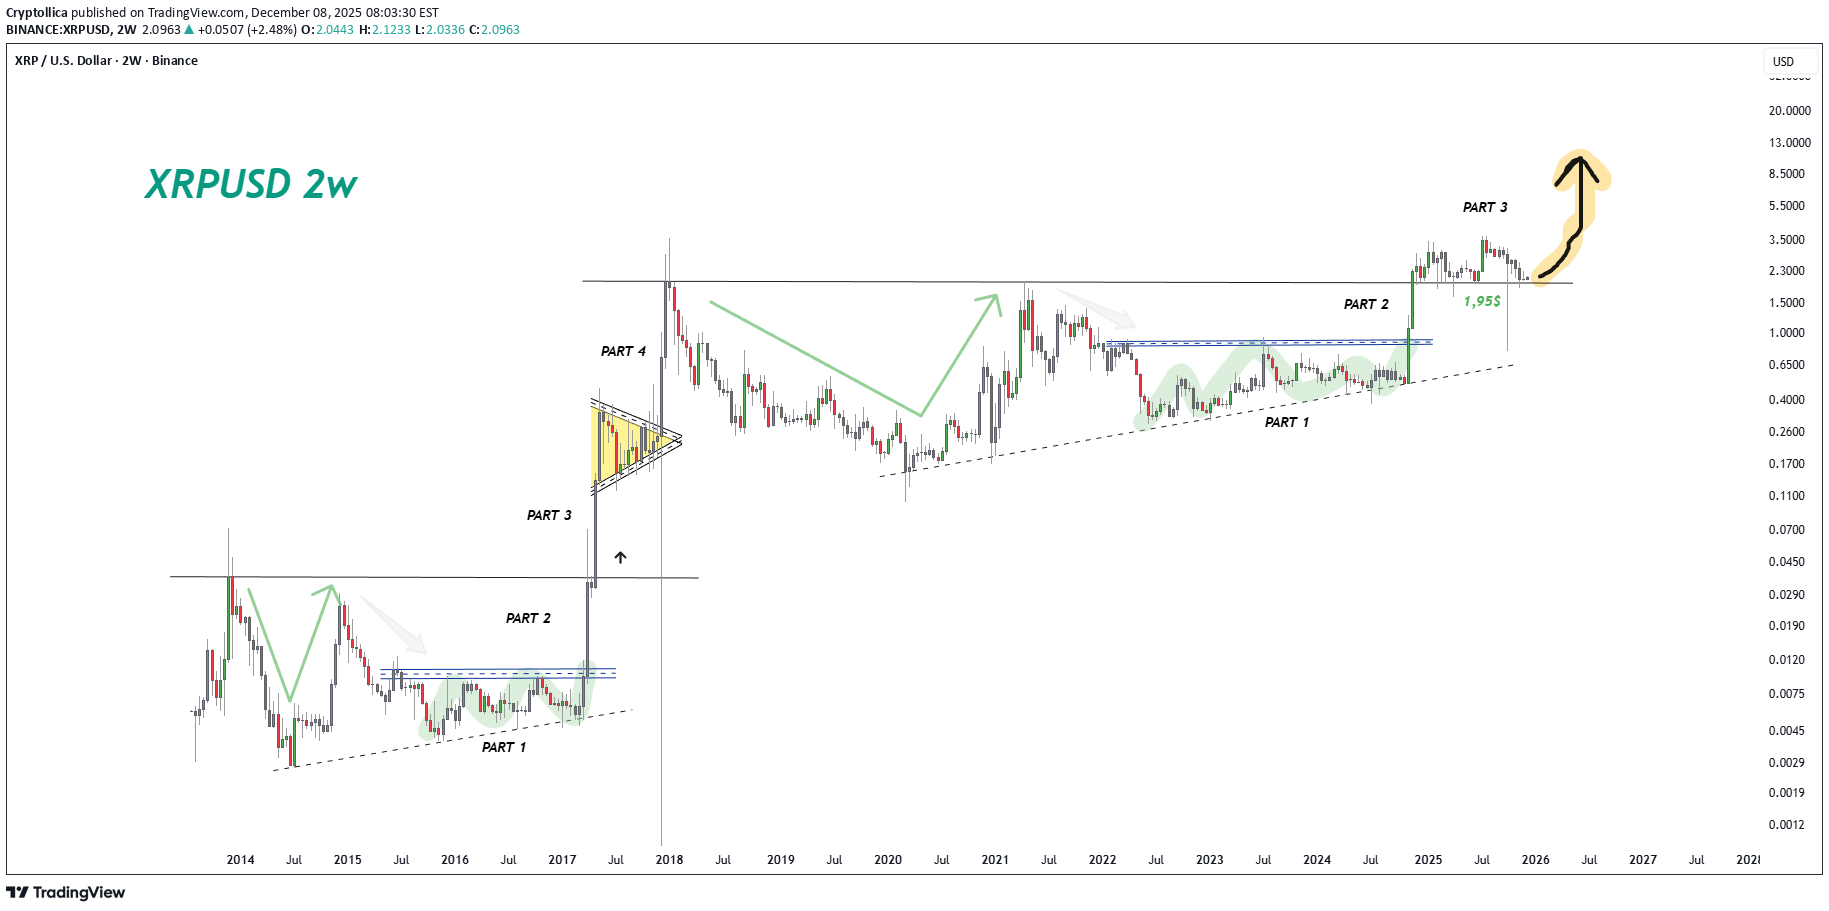
1. Overall Structure: The Fractal Recurrence (2017 vs. 2025) The chart’s main hypothesis is that the cycle experienced by XRP between 2014 and 2017 is almost an identical copy of the current cycle spanning 2021 to 2025. Left Side (2014-2017): Depicts the "dead" period, accumulation, and subsequent vertical surge that preceded XRP’s legendary 2017 rally. Right Side (Current Situation): Shows a similar "rounding bottom" formation, consolidation, and the recent breakout. 2. Segment-by-Segment Technical Breakdown Let's evaluate the labeled "PART" segments on the chart individually: PART 1 (Accumulation Phase): In both cycles, this was a period where investor patience was tested, and the price was suppressed within a specific range (below the dashed blue lines) for an extended time. In the current cycle, this process (2022-2024) lasted significantly longer. A fundamental rule in technical analysis states: "The bigger the base, the higher in space." This prolonged sideways movement indicates a massive build-up of energy that could intensify the magnitude of the eventual surge. PART 2 (Breakout and Retest): The moment the blue resistance area is broken to the upside. The chart suggests we are currently at the tail end of, or have just completed, this phase. Price consolidation and sustained movement above the blue box confirms the official end of the downtrend and the start of a bull market. PART 3 (Parabolic Rise - Discovery Phase): This is the most critical juncture of the chart. In 2017, following "Part 2," the price rose in a near-vertical line, seemingly defying gravity. The analysis contends that we are standing right on the precipice of this "vertical lift-off" in the current cycle. The large yellow arrow indicates an expectation for the price to accelerate rapidly on the logarithmic scale. Critical Level: The $1.95 Support: The $1.95 level, marked in green, is of vital importance. This was the previous major resistance. According to technical analysis, "Once resistance is broken, it turns into support." The price currently holding above this level (performing a successful retest) is the most crucial confirmation point for the continuation of the uptrend. 3. Targets and Expectations Considering the yellow arrow and the scaling on the right side of the chart: Short-to-Medium Term: The first primary target is the range around XRP's All-Time High (ATH) of $3.30 – $3.84. The Chart's Implied Target: If the 2017 fractal plays out precisely, the chart suggests a peak target between $9.00 and $13.00 (or potentially even higher). 4. Risks and Commentary from an Experienced Analyst While the chart is visually compelling, as an experienced broker, I must add these nuances: Market Cap Reality: The crypto market was much smaller in 2017. For XRP to hit $10+ now implies reaching a colossal market capitalization. While not impossible (logic often takes a backseat in crypto mania), expecting the exact "x100" moves of 2017 is mathematically more challenging. Fundamental Catalysts (SEC and ETF): The success of this chart relies not just on technical data but on fundamental factors. SEC lawsuit closure, rumors of an XRP ETF, and Ripple’s stablecoin moves are the core elements that will fuel this "Part 3." Volatility Warning: Parabolic rises (Part 3) are accompanied by very severe corrections (sudden drops of 30-40%). This is the most dangerous territory for leveraged trading. Conclusion Outlook: Extremely Positive (Bullish). Strategy: If you currently hold XRP: A "Hold" strategy seems prudent as long as the $1.95 level is maintained. The trend momentum is extremely strong. For New Entries: Retracements (retests) into the $1.95 - $2.10 range could be viewed as secure buying opportunities. In summary: The chart indicates that XRP is at the moment of "breaking its chains" that has been long-awaited. If Bitcoin does not derail the broader market, double-digit targets ($10+) for XRP are technically on the table. BONUS CHART: XRP/DXY 1w
Cryptollica
POLKADOT ($DOT)
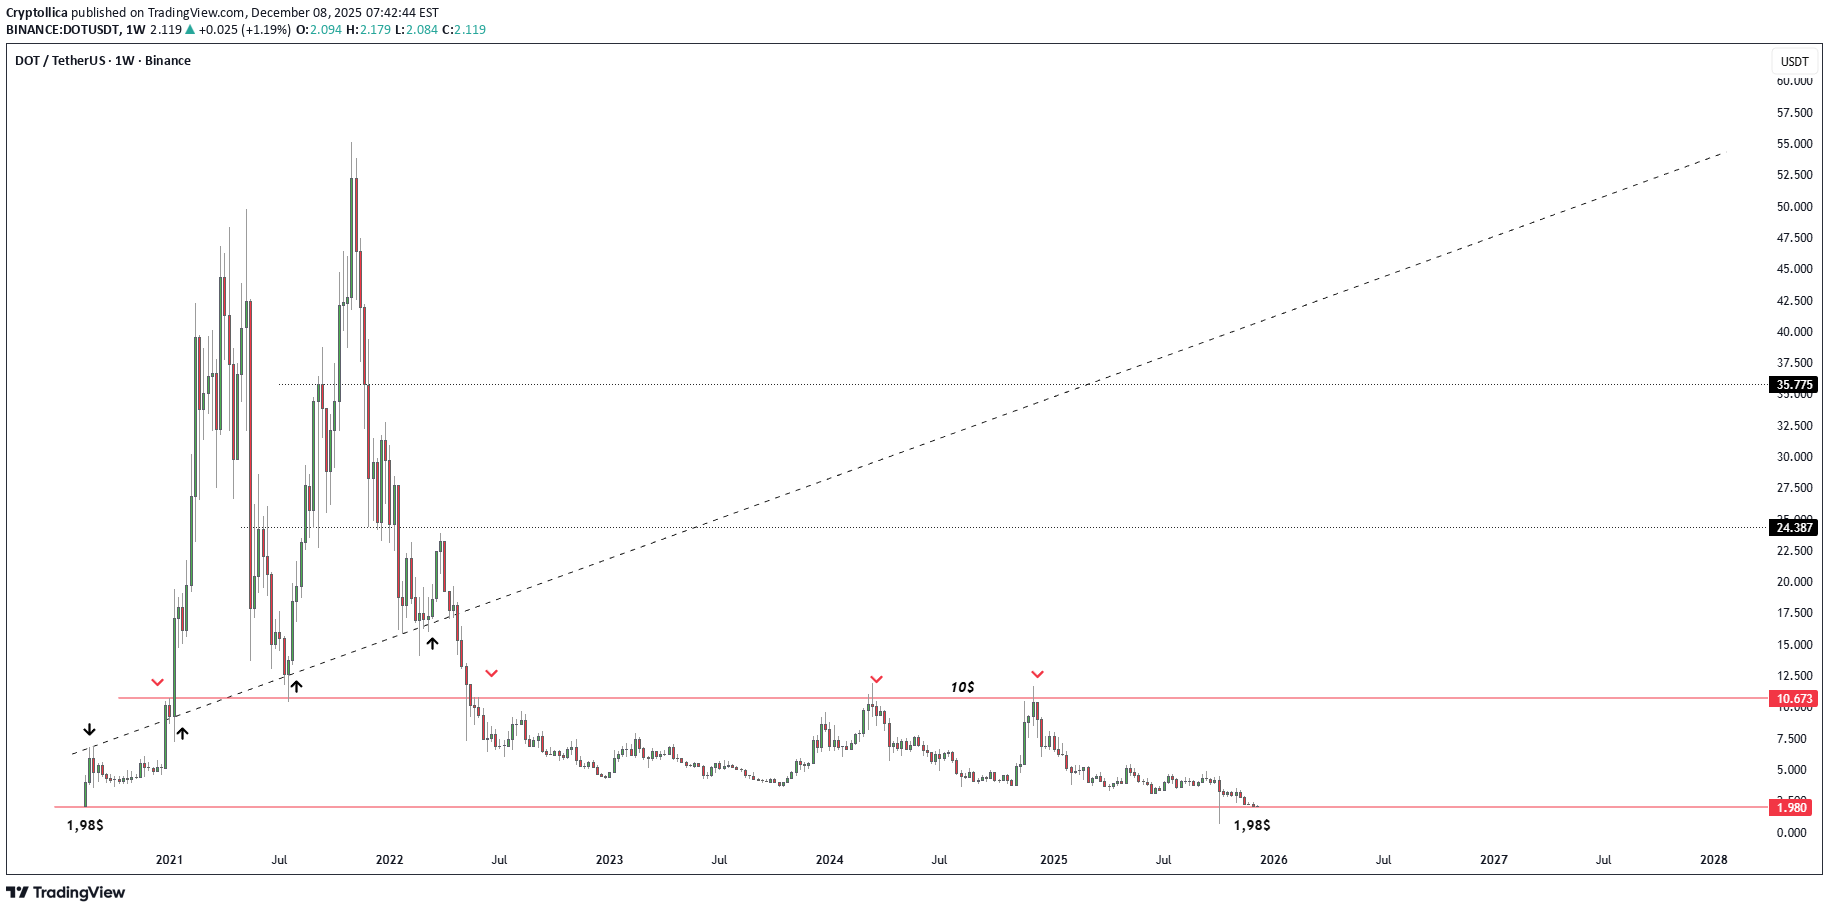
Polkadot (DOT) Weekly Chart (1W) Technical Analysis Examining the Polkadot (DOT) weekly chart, we can see that the asset is at a highly critical and historic juncture. From the perspective of a technical analyst, let's detail this chart regarding market cycle, critical support/resistance levels, and trend structure. 1. General Market Structure and Cycle Analysis The chart clearly illustrates a classic "Boom and Bust" cycle. Full Cycle Reset: The price has returned to the exact starting point of the massive bull run that began in late 2020 (approximately $1.98). This means the price action of the last 5 years has been effectively erased, returning the market to "ground zero." Trend Outlook: The main structure is currently dominated by a Bear Market. The major ascending trendline (dashed line) was broken in early 2022, and the price has remained suppressed below this trend ever since. 2. Critical Price Levels The most significant technical zones on the chart are as follows: 🟢 Major Support: $1.98 - $2.00 Zone (The "Kiss of Life") This region is the "Make or Break" level for DOT. Historical Significance: This is where the historic rally of 2020 originated. Returning to this level suggests we may be at a point of total seller exhaustion (capitulation). Technical Expectation: A strong reaction/bounce from this level is technically highly probable. However, weekly closes below this level would drag the price into "price discovery" to the downside (unknown territory). 🔴 Major Resistance: $10.67 (Red Line) Marked as "$10" on the chart, this is the most critical resistance barrier. Price attempted to breach this level in 2022, 2023, and 2024, but was rejected every single time (as indicated by the red down arrows). It is technically impossible to speak of a new bull trend until this level is decisively reclaimed. ⚠️ Intermediate Resistance and Broken Trendline Broken Ascending Trend: The dashed black line now acts as strong diagonal resistance. Every bullish attempt hits this line or horizontal resistance and retraces. Intermediate Targets: In a potential reversal, the $4.50 - $5.00 band would likely act as the first intermediate resistance. 3. Technical Formation and Interpretation Round Trip (Cycle Completion): The drop from $55 levels back to $2 indicates a massive cycle completion. Usually, the end of such large drops is followed by a prolonged "Horizontal Accumulation" phase. Triple Top / Rejection: The multiple rejections at the $10 level (seen around 2024) prove there is a significant supply (seller) block in that region. 4. Investor Strategy and Scenarios As a market analyst, two main scenarios can be constructed based on this chart: Scenario A: "Bottom Fishing" (Bullish Reversal) Thesis: Price is at historic support ($1.98). The Risk/Reward (R/R) ratio is at its most attractive point for buyers. Strategy: Gradual accumulation can be attempted in the $1.98 - $2.10 range, with a stop-loss strictly placed below $1.80. Target: The first reaction target is the $4-5 band. Long term, the +$10 limit could be tested again. And Maybe old ATH = 50$
Cryptollica
Chainlink (LINK) – The Final Stage of a 5-Year Compression
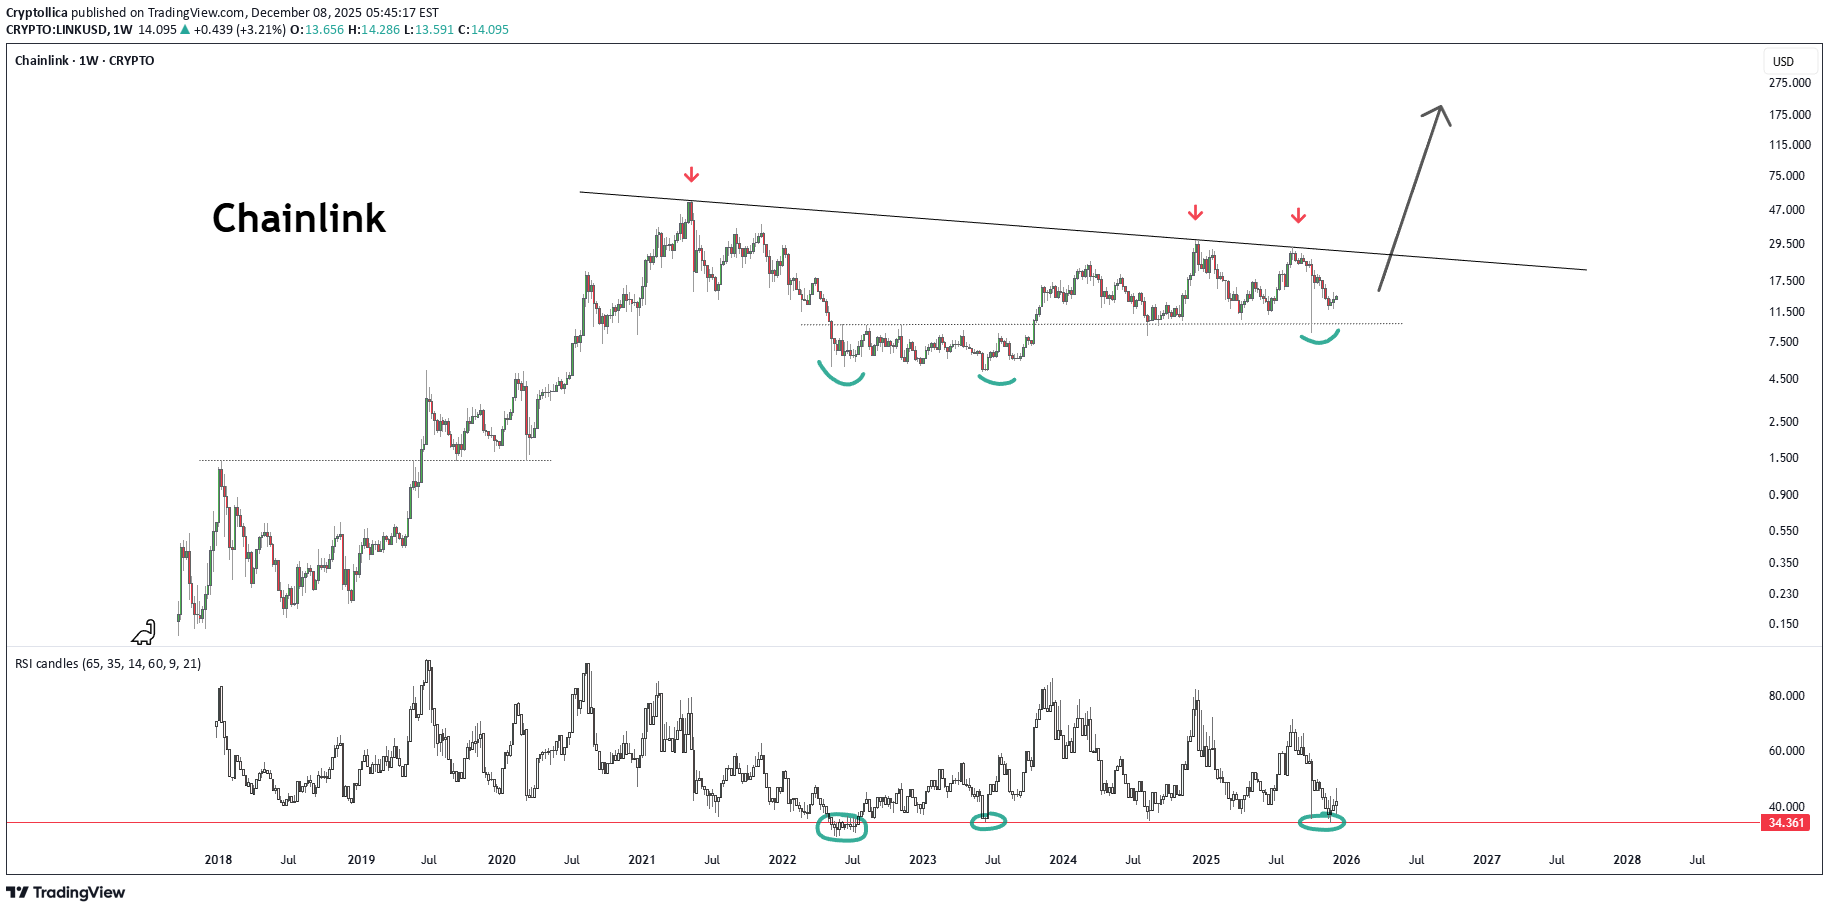
Chainlink (LINK) – The Final Stage of a 5-Year Compression** The chart is telling one very clear story: > **Chainlink is approaching the end of a 4-year descending macro trend while sitting on a 3-year accumulation floor.** > The moment these two structures converge, a major regime shift usually follows. **“The 5-Year Pressure Is About to Break.”** --- 🔹 **1) The 4-Year Descending Macro Trend (2021 → 2025)** The red arrows mark the same long-term trendline connecting the major tops of: * 2021 * 2022 * 2024 This line has acted as the **spine of the bear market**. And LINK is now marching **back into this line for the next major test**. A break here is not just a trend break. It is a **market regime shift**. --- 🔹 **2) The 3-Year Horizontal Accumulation Floor** The green curved bottoms highlight how: * 2022 * 2023 * 2024 * and late 2025 have all produced **identical bottom structures** around the 12–13$ region. This is: **A large, asymmetric inverse H&S (iH&S) structure** Ugly, uneven, but extremely powerful. Key observations: * Bottoms don’t break * Selling is absorbed * Volatility is compressing * Strong structural demand refuses to give way This is **large-scale accumulation**, not weakness. --- 🔹 **3) Weekly RSI – The Macro Cycle Floor** The RSI bottom line around **34** has marked every major cyclical low since 2018: * 2018 bear bottom * 2020 crash * 2022 bear bottom * 2023 correction * **And right now** LINK’s **macro oscillator cycle is at bottom territory** — a region historically followed by multi-month expansions. --- 🔹 **4) Technically, the picture is this:** * **A 4-year descending trendline above** * **A 3-year accumulation zone below** * **RSI sitting at cycle lows inside** This is the type of setup that precedes massive impulsive waves. --- ⭐ **"Chainlink is coiled inside a high-timeframe expansion structure."** When these structures break, they don’t produce small moves — they produce **cycle expansions**. --- 🔹 **5) Fundamental Drivers – Why This Cycle Is Different for LINK** Chainlink now sits at the center of crypto’s real infrastructure layer. **1) CCIP (Cross-Chain Interoperability Protocol)** Adopted by: * BlackRock * DTCC * SWIFT * Multiple banks and RWA platforms 2024–2025 marks the first time traditional finance begins using LINK’s infrastructure at scale. **2) Oracle fee growth** The rise of RWA (Real-World Assets) means: * More data feeds * More volume * More fees * More burn pressure on the token economy Chainlink’s tokenomics finally enter a structurally bullish regime. **3) Macro Altcoin Liquidity Expansion** In every cycle, certain infrastructure tokens become early movers. LINK is positioned to be one of them due to: * Dominance in the oracle sector * Institutional integrations * Network effects --- 🧭 **6) Probable Scenario (Technical)** **Bullish scenario (primary expectation):** * Break above the 4-year trendline * Weekly close above **18–20$** → 29–32$ → 46$ → **Macro target: 70–75$** **Bearish scenario (lower probability):** * Breakdown below 13$ → liquidity sweep toward 9–10$ (Indicators currently reject this scenario) Log MACD --- 🎯 **Conclusion **Chainlink is approaching the most important structural point since 2020.** The alignment is extremely rare: * RSI at cycle lows * Price at a 3-year demand floor * Approaching a 4-year macro trendline * CCIP adoption accelerating * RWA growth pulling LINK into real-world usage This is not a normal chart. This is a **macro cycle setup**. And these setups usually play out like this: > **“Trend breaks → FOMO awakens → Expansion begins.”**
Cryptollica
هدف بزرگ دوج کوین: رسیدن به ۱.۳۰ دلار در کوتاهمدت!
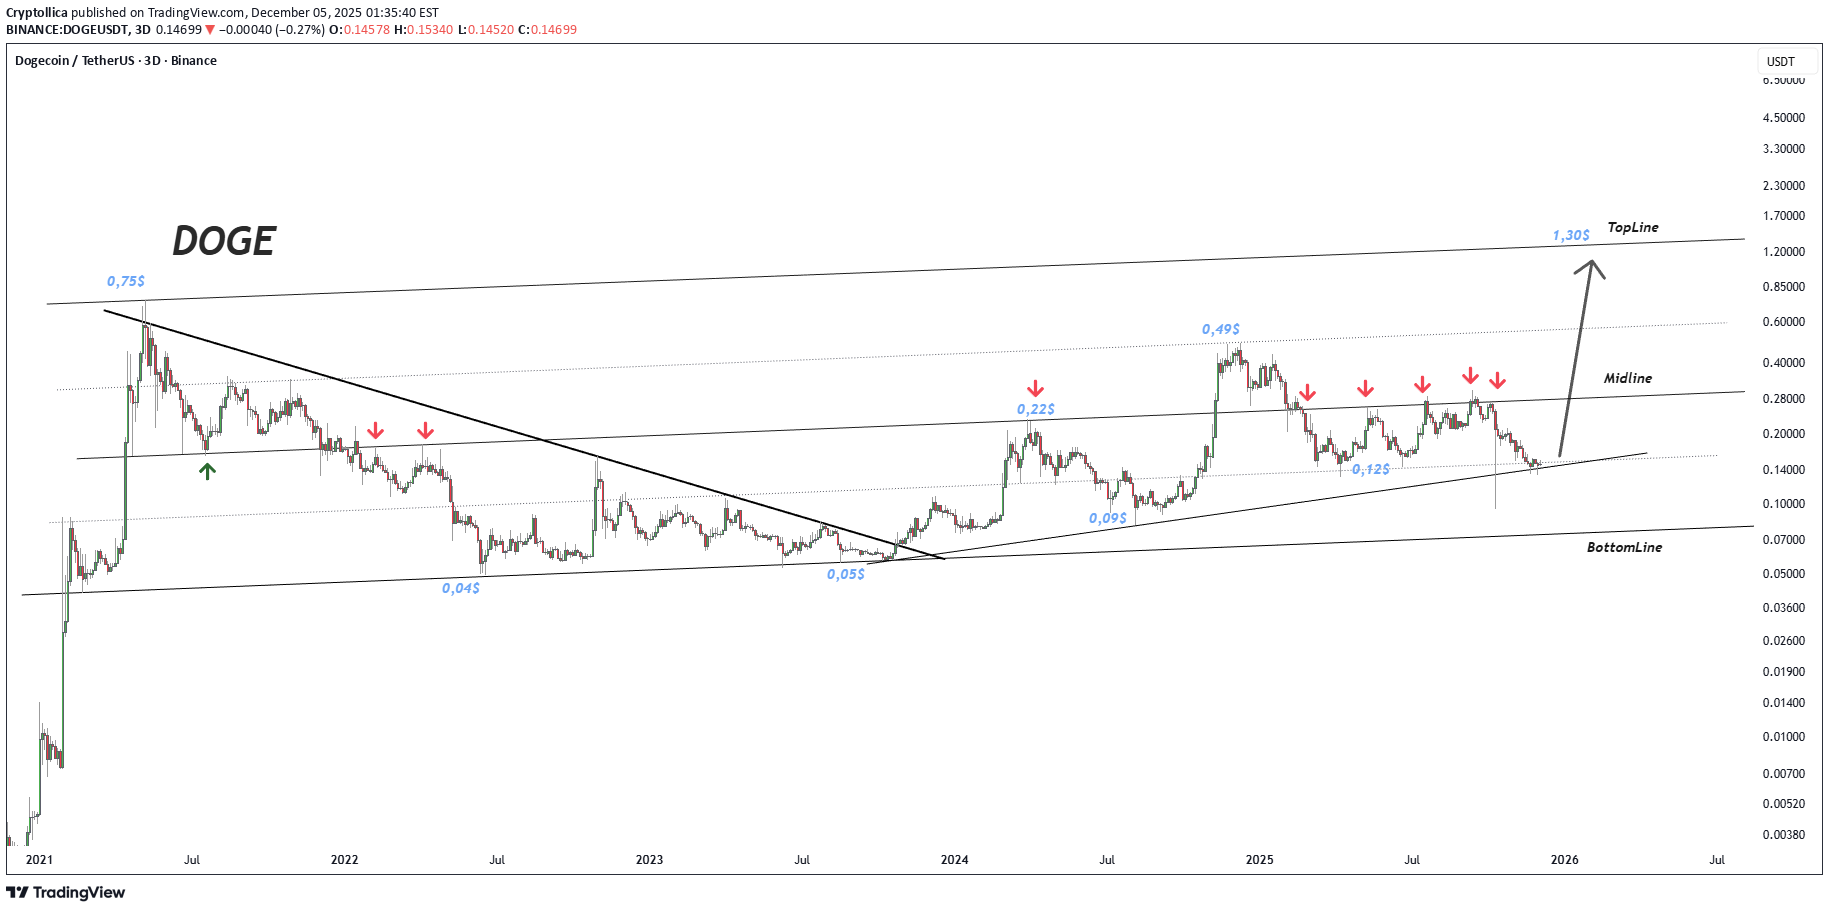
DOGE/USD 3d midterm chart Mid Target: 1.3$ (parallel channel tops) Doge is ready to go
Cryptollica
پیشبینی هیجانانگیز: آینده بلندمدت ریپل (XRP) تا سال 2025؛ آیا قیمت به 10 دلار میرسد؟
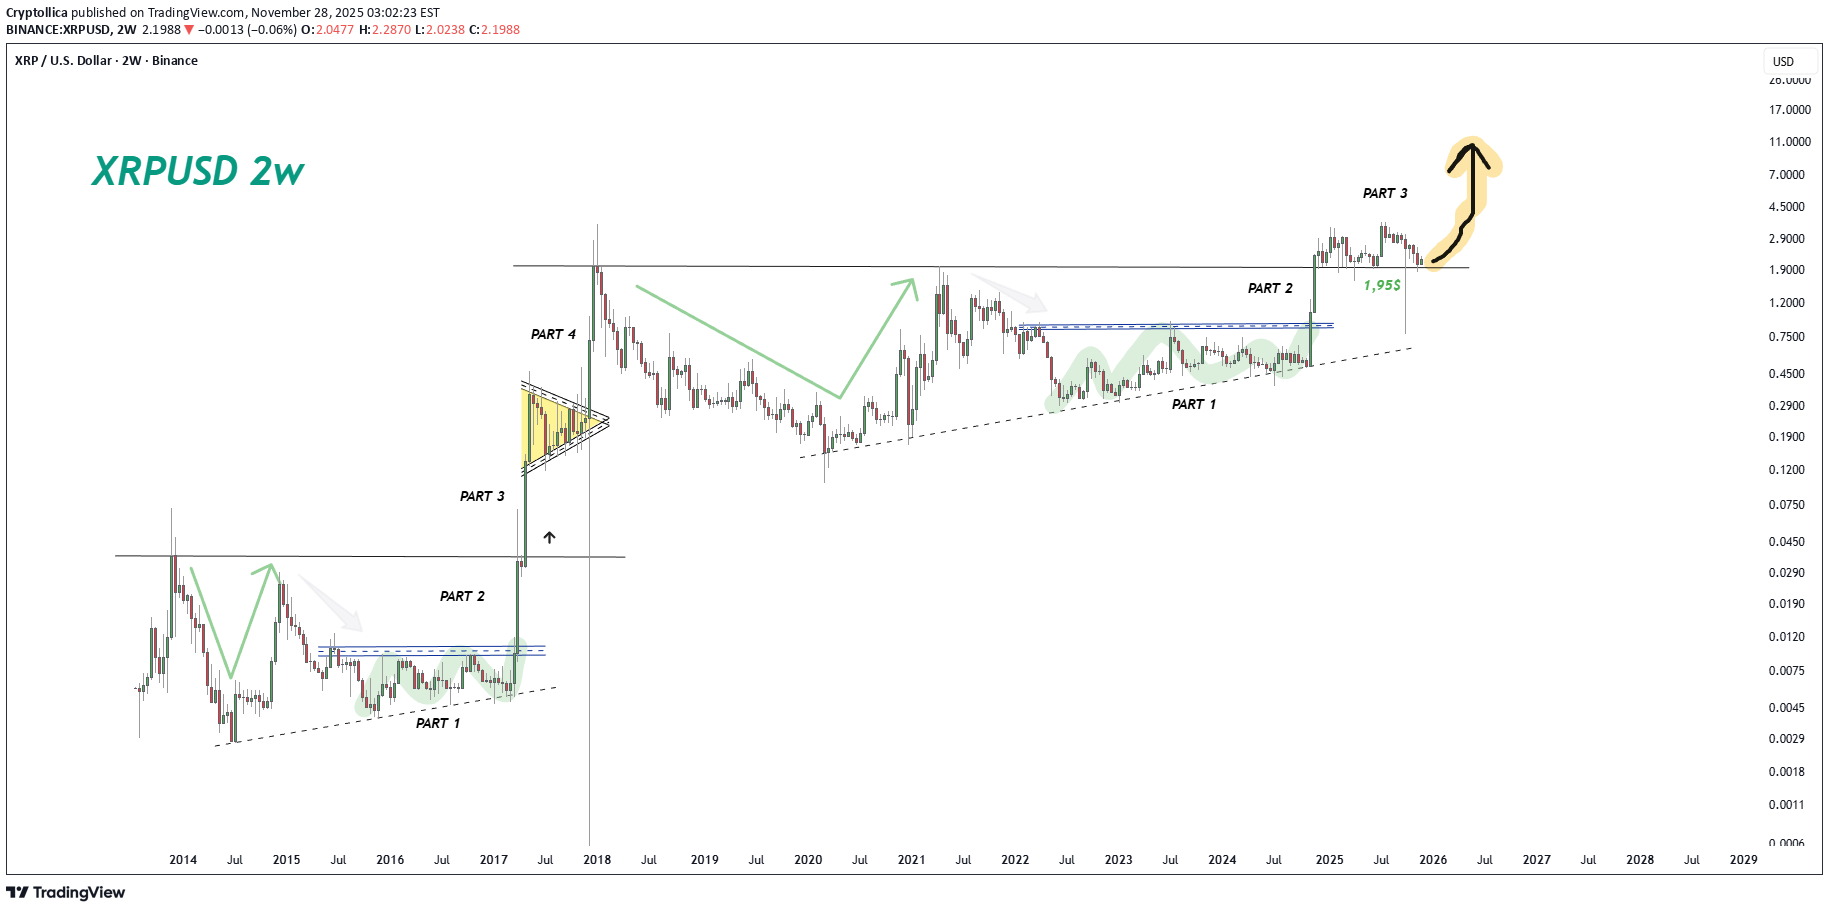
XRP/USD 2w chart (2014-2025) Longterm fractal Target: +10$ (ripple)
Cryptollica
Cryptollica
ETHEREUM vs. GÜMÜŞ

ETHEREUM vs. GÜMÜŞ Haftalık grafik üzerinde karşılaştırma 2017-2025 arası dönemKeltner Kanalı Logaritmik Bollinger Bandı (2 haftalık mum)Paralel Kanallarla ETHUSD Trend ETHUSD Mevcut yapı (2020 vs 2025)
Cryptollica
Bitcoin Döngünün Neresindeyiz ? 2011-2024

BTCUSD Döngünün Neresindeyiz ? 2011-2024 BTCUSD 11 günlük grafik üzerinden hazırlamış olduğum döngüsel çalışma Mayer multiple band (33MA -33X11)RSI(28)4 bölgede olduğumuzu düşünüyorum. Yükseliş trendi devam ediyor. 1-2-3-4 işaretli yerler her yılın aralık ayları. sarı dikey çizgi halving.düzeltmeleri göre göre zirveye doğru ilerleyeceğiz.
Cryptollica

Cryptollica
BTCUSD Hedef 130.000$ ! =)
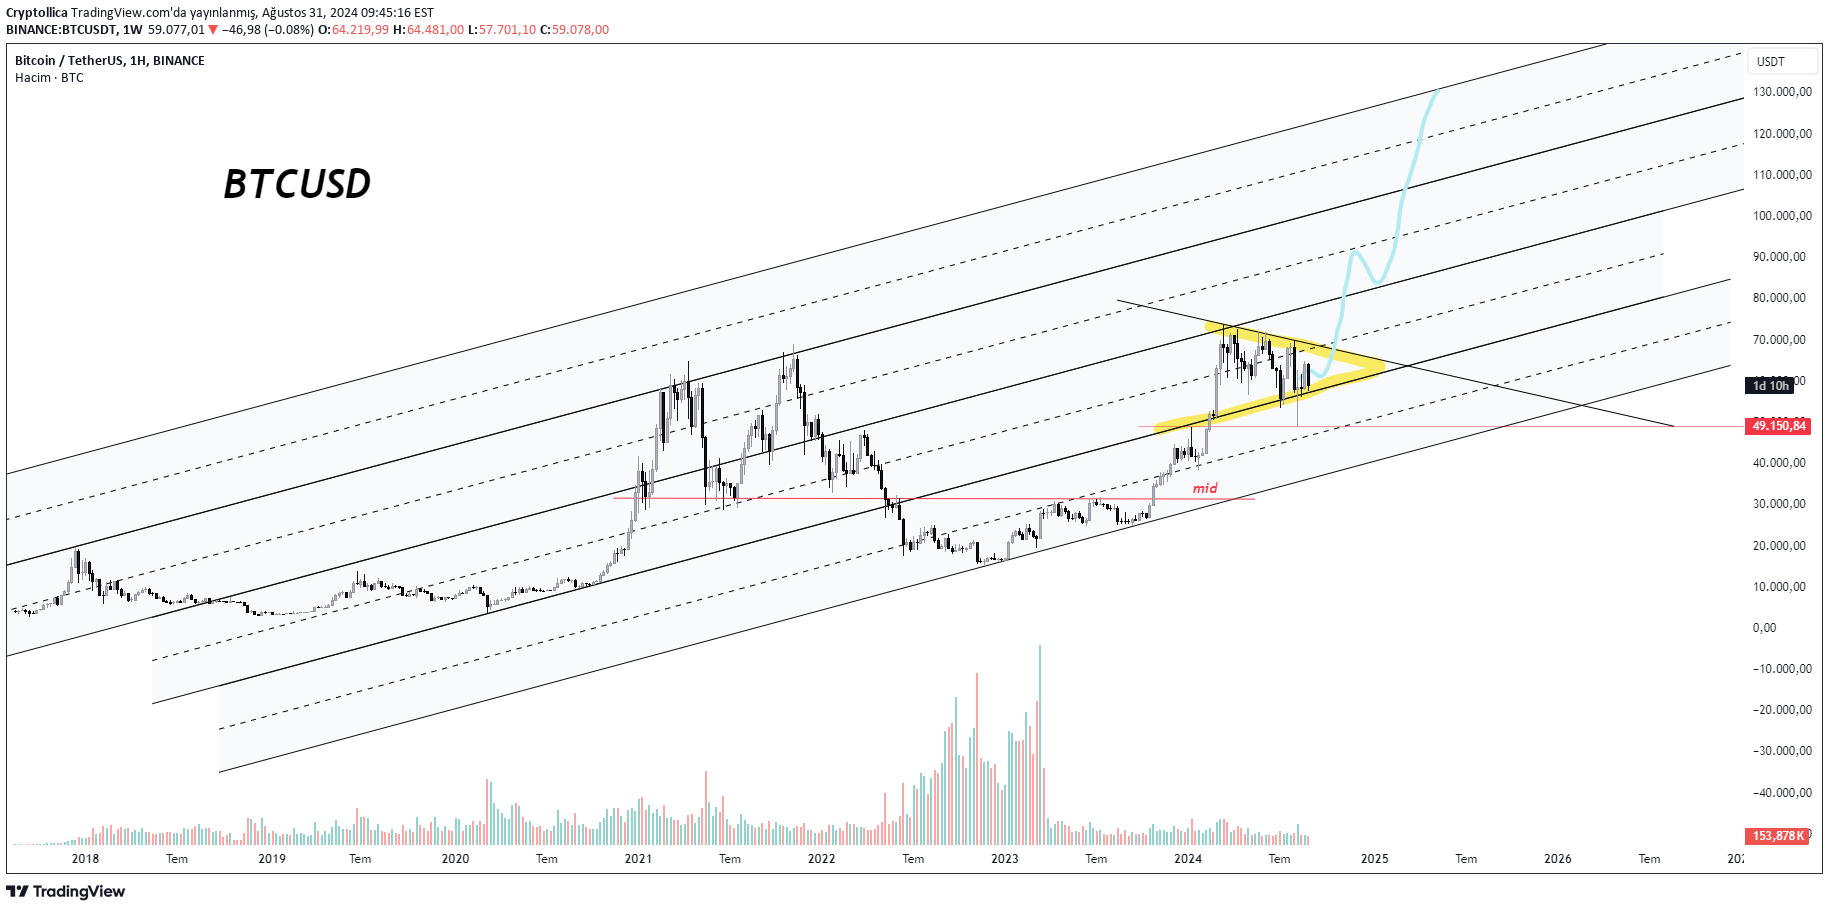
BTCUSD Hedef 130.000$ Lineer grafik. >Döngü : Süreleri farklı olmakla beraber, bu evreler birbirini izler. Bu şekilde döngüler oluşmuş olur. Bitcoin 2008 yılından beri 4 yıllık halving (yarılanma) döngüsünü izliyor. 4 yıl bir döngüyü oluşturuyor. 4 yılın içerisinde de boğa-ayı-akümülasyon süreçleri gerçekleşiyor. Üçgen kırılımı ile agresif hareket bölgesine geçeceğiz. BTCUSD/DXY (2014-2024 )2014 yılından günümüze uzanan süreçte BTCUSD/DXY grafiği oluşturdum.İlk dikkat çeken kısım bana göre; yaşadığımız sürecin döngüsel anlamda 2015-2016 dönemine benziyor oluşudur.bu dönemleri grafiğe işleyerek 4 ayrı parçaya böldüm.4. kısımdan sonra da yeni ATH göreceğiz. Benim tahminim 2025 ilk aylarıdır.BTCUSD 50 MA Mayer Multiple Zirveden bugüne (1029 gün)
Disclaimer
Any content and materials included in Sahmeto's website and official communication channels are a compilation of personal opinions and analyses and are not binding. They do not constitute any recommendation for buying, selling, entering or exiting the stock market and cryptocurrency market. Also, all news and analyses included in the website and channels are merely republished information from official and unofficial domestic and foreign sources, and it is obvious that users of the said content are responsible for following up and ensuring the authenticity and accuracy of the materials. Therefore, while disclaiming responsibility, it is declared that the responsibility for any decision-making, action, and potential profit and loss in the capital market and cryptocurrency market lies with the trader.