Technical analysis by Cryptollica about Symbol LINK: Buy recommendation (6 hour ago)

Cryptollica
Chainlink (LINK) – The Final Stage of a 5-Year Compression
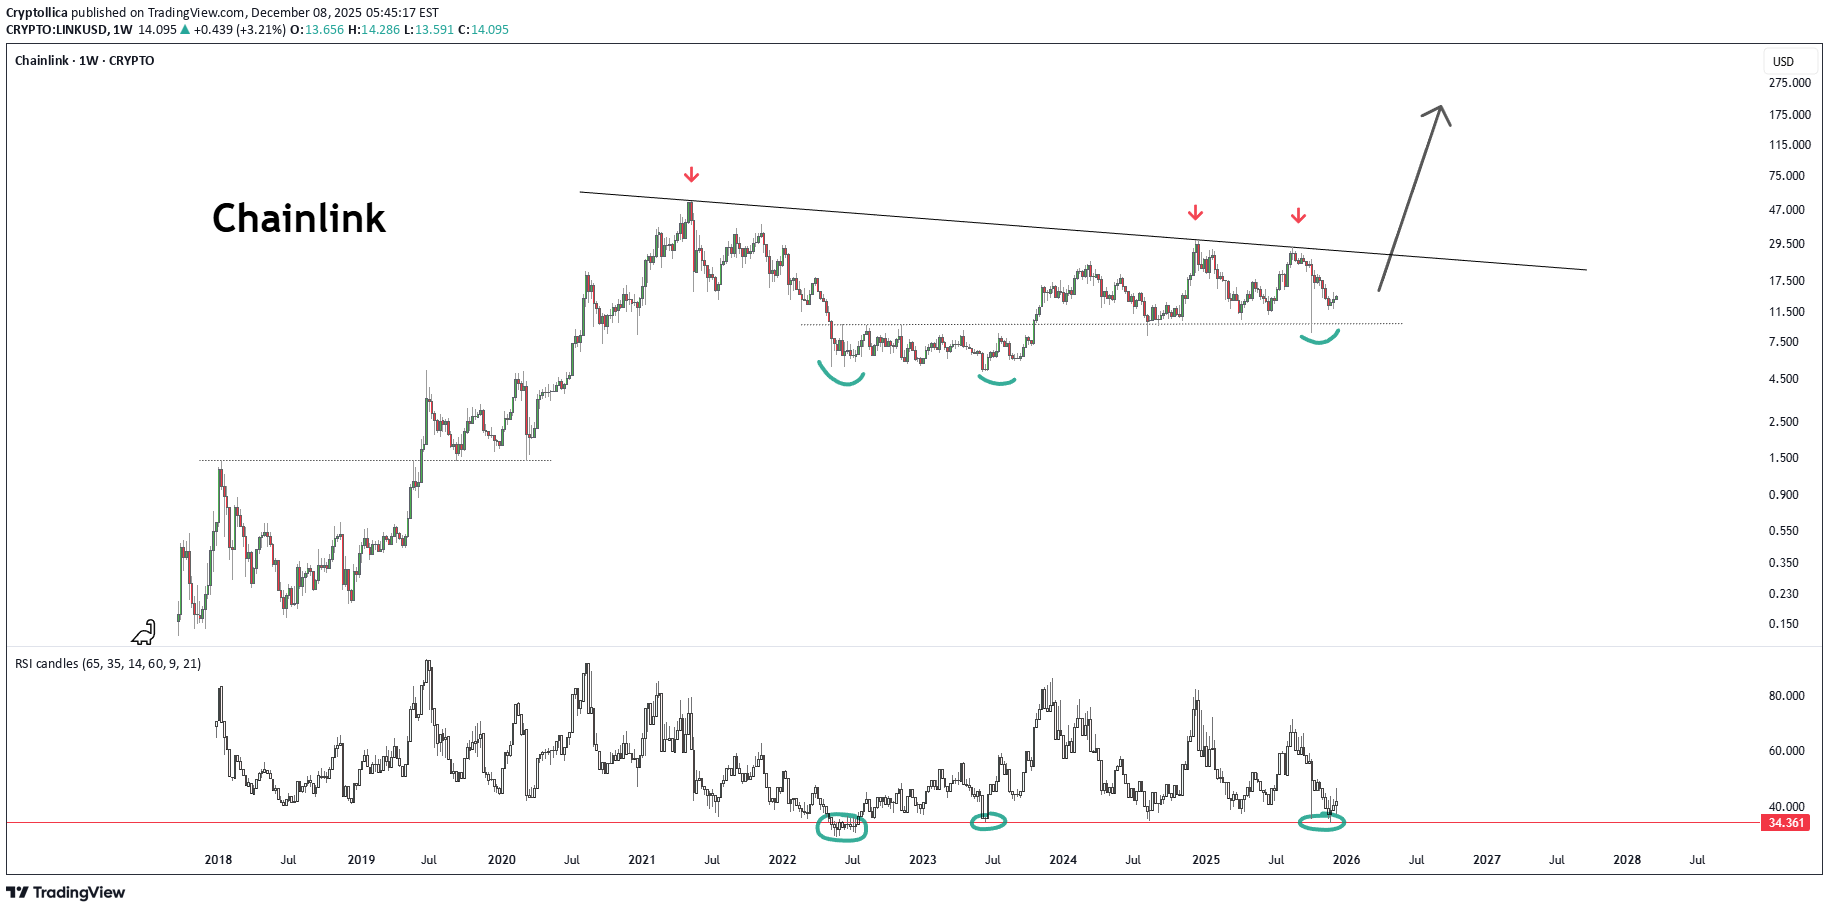
Chainlink (LINK) – The Final Stage of a 5-Year Compression** The chart is telling one very clear story: > **Chainlink is approaching the end of a 4-year descending macro trend while sitting on a 3-year accumulation floor.** > The moment these two structures converge, a major regime shift usually follows. **“The 5-Year Pressure Is About to Break.”** --- 🔹 **1) The 4-Year Descending Macro Trend (2021 → 2025)** The red arrows mark the same long-term trendline connecting the major tops of: * 2021 * 2022 * 2024 This line has acted as the **spine of the bear market**. And LINK is now marching **back into this line for the next major test**. A break here is not just a trend break. It is a **market regime shift**. --- 🔹 **2) The 3-Year Horizontal Accumulation Floor** The green curved bottoms highlight how: * 2022 * 2023 * 2024 * and late 2025 have all produced **identical bottom structures** around the 12–13$ region. This is: **A large, asymmetric inverse H&S (iH&S) structure** Ugly, uneven, but extremely powerful. Key observations: * Bottoms don’t break * Selling is absorbed * Volatility is compressing * Strong structural demand refuses to give way This is **large-scale accumulation**, not weakness. --- 🔹 **3) Weekly RSI – The Macro Cycle Floor** The RSI bottom line around **34** has marked every major cyclical low since 2018: * 2018 bear bottom * 2020 crash * 2022 bear bottom * 2023 correction * **And right now** LINK’s **macro oscillator cycle is at bottom territory** — a region historically followed by multi-month expansions. --- 🔹 **4) Technically, the picture is this:** * **A 4-year descending trendline above** * **A 3-year accumulation zone below** * **RSI sitting at cycle lows inside** This is the type of setup that precedes massive impulsive waves. --- ⭐ **"Chainlink is coiled inside a high-timeframe expansion structure."** When these structures break, they don’t produce small moves — they produce **cycle expansions**. --- 🔹 **5) Fundamental Drivers – Why This Cycle Is Different for LINK** Chainlink now sits at the center of crypto’s real infrastructure layer. **1) CCIP (Cross-Chain Interoperability Protocol)** Adopted by: * BlackRock * DTCC * SWIFT * Multiple banks and RWA platforms 2024–2025 marks the first time traditional finance begins using LINK’s infrastructure at scale. **2) Oracle fee growth** The rise of RWA (Real-World Assets) means: * More data feeds * More volume * More fees * More burn pressure on the token economy Chainlink’s tokenomics finally enter a structurally bullish regime. **3) Macro Altcoin Liquidity Expansion** In every cycle, certain infrastructure tokens become early movers. LINK is positioned to be one of them due to: * Dominance in the oracle sector * Institutional integrations * Network effects --- 🧭 **6) Probable Scenario (Technical)** **Bullish scenario (primary expectation):** * Break above the 4-year trendline * Weekly close above **18–20$** → 29–32$ → 46$ → **Macro target: 70–75$** **Bearish scenario (lower probability):** * Breakdown below 13$ → liquidity sweep toward 9–10$ (Indicators currently reject this scenario) Log MACD --- 🎯 **Conclusion **Chainlink is approaching the most important structural point since 2020.** The alignment is extremely rare: * RSI at cycle lows * Price at a 3-year demand floor * Approaching a 4-year macro trendline * CCIP adoption accelerating * RWA growth pulling LINK into real-world usage This is not a normal chart. This is a **macro cycle setup**. And these setups usually play out like this: > **“Trend breaks → FOMO awakens → Expansion begins.”**