Technical analysis by Cryptollica about Symbol XRP: Buy recommendation (4 hour ago)

Cryptollica
XRP/USD 2-Week Chart Analysis: Is History Repeating Itself?
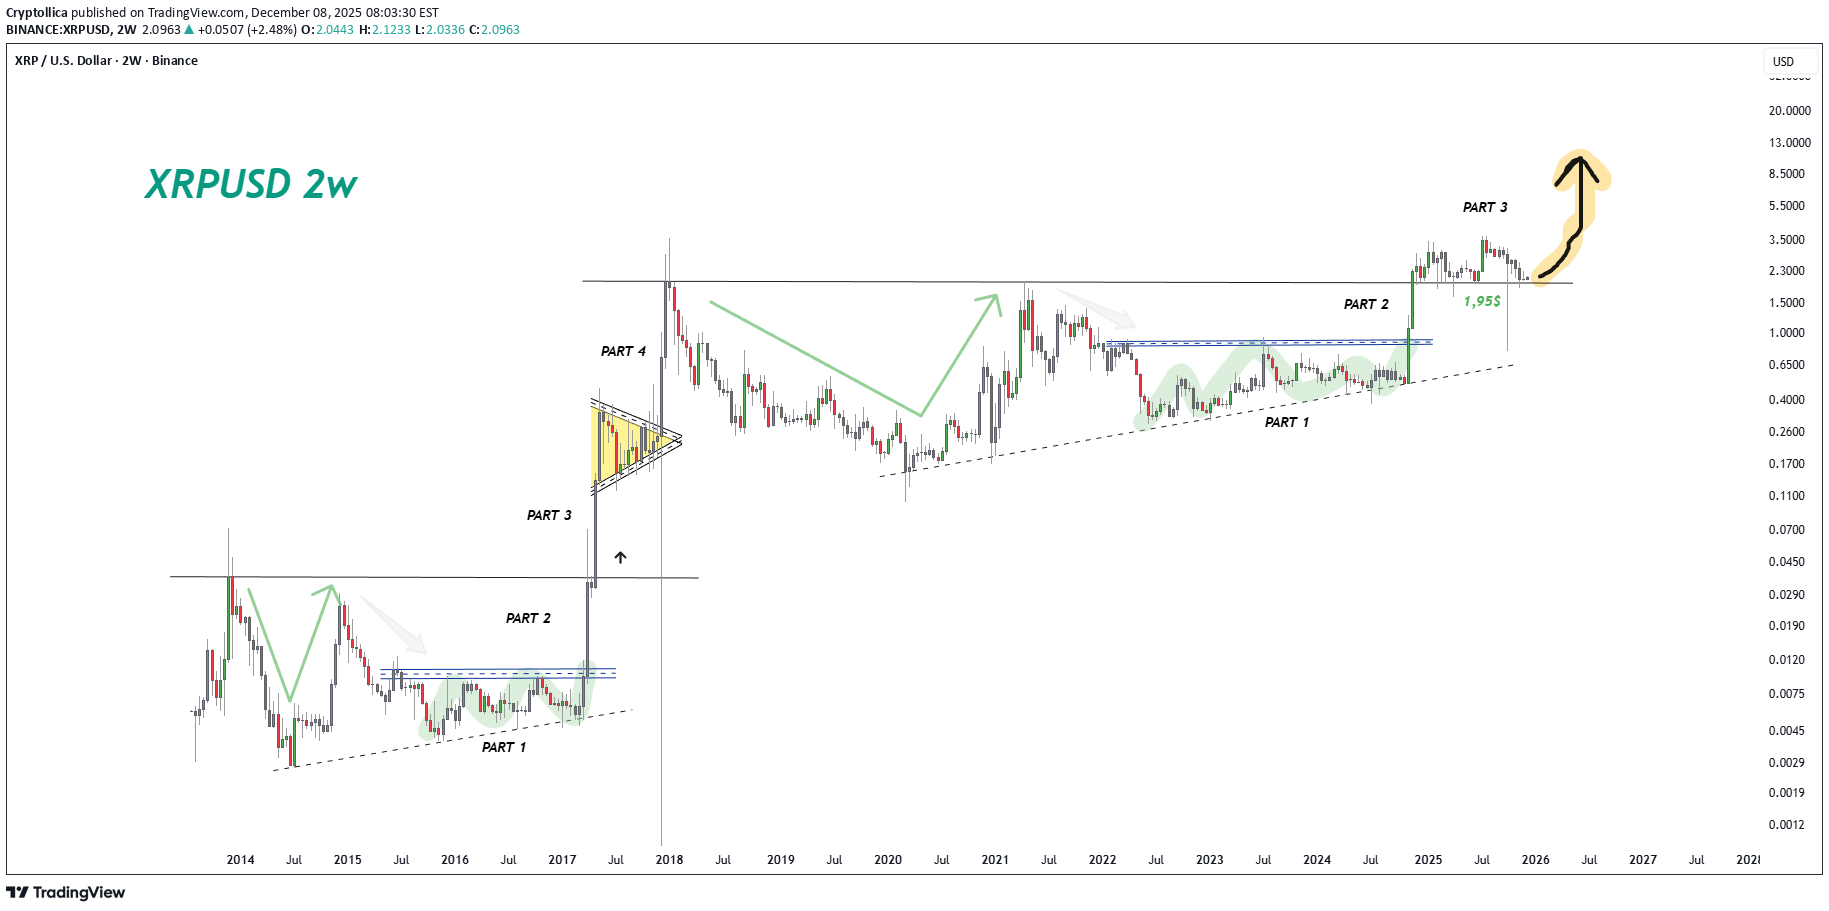
1. Overall Structure: The Fractal Recurrence (2017 vs. 2025) The chart’s main hypothesis is that the cycle experienced by XRP between 2014 and 2017 is almost an identical copy of the current cycle spanning 2021 to 2025. Left Side (2014-2017): Depicts the "dead" period, accumulation, and subsequent vertical surge that preceded XRP’s legendary 2017 rally. Right Side (Current Situation): Shows a similar "rounding bottom" formation, consolidation, and the recent breakout. 2. Segment-by-Segment Technical Breakdown Let's evaluate the labeled "PART" segments on the chart individually: PART 1 (Accumulation Phase): In both cycles, this was a period where investor patience was tested, and the price was suppressed within a specific range (below the dashed blue lines) for an extended time. In the current cycle, this process (2022-2024) lasted significantly longer. A fundamental rule in technical analysis states: "The bigger the base, the higher in space." This prolonged sideways movement indicates a massive build-up of energy that could intensify the magnitude of the eventual surge. PART 2 (Breakout and Retest): The moment the blue resistance area is broken to the upside. The chart suggests we are currently at the tail end of, or have just completed, this phase. Price consolidation and sustained movement above the blue box confirms the official end of the downtrend and the start of a bull market. PART 3 (Parabolic Rise - Discovery Phase): This is the most critical juncture of the chart. In 2017, following "Part 2," the price rose in a near-vertical line, seemingly defying gravity. The analysis contends that we are standing right on the precipice of this "vertical lift-off" in the current cycle. The large yellow arrow indicates an expectation for the price to accelerate rapidly on the logarithmic scale. Critical Level: The $1.95 Support: The $1.95 level, marked in green, is of vital importance. This was the previous major resistance. According to technical analysis, "Once resistance is broken, it turns into support." The price currently holding above this level (performing a successful retest) is the most crucial confirmation point for the continuation of the uptrend. 3. Targets and Expectations Considering the yellow arrow and the scaling on the right side of the chart: Short-to-Medium Term: The first primary target is the range around XRP's All-Time High (ATH) of $3.30 – $3.84. The Chart's Implied Target: If the 2017 fractal plays out precisely, the chart suggests a peak target between $9.00 and $13.00 (or potentially even higher). 4. Risks and Commentary from an Experienced Analyst While the chart is visually compelling, as an experienced broker, I must add these nuances: Market Cap Reality: The crypto market was much smaller in 2017. For XRP to hit $10+ now implies reaching a colossal market capitalization. While not impossible (logic often takes a backseat in crypto mania), expecting the exact "x100" moves of 2017 is mathematically more challenging. Fundamental Catalysts (SEC and ETF): The success of this chart relies not just on technical data but on fundamental factors. SEC lawsuit closure, rumors of an XRP ETF, and Ripple’s stablecoin moves are the core elements that will fuel this "Part 3." Volatility Warning: Parabolic rises (Part 3) are accompanied by very severe corrections (sudden drops of 30-40%). This is the most dangerous territory for leveraged trading. Conclusion Outlook: Extremely Positive (Bullish). Strategy: If you currently hold XRP: A "Hold" strategy seems prudent as long as the $1.95 level is maintained. The trend momentum is extremely strong. For New Entries: Retracements (retests) into the $1.95 - $2.10 range could be viewed as secure buying opportunities. In summary: The chart indicates that XRP is at the moment of "breaking its chains" that has been long-awaited. If Bitcoin does not derail the broader market, double-digit targets ($10+) for XRP are technically on the table. BONUS CHART: XRP/DXY 1w