
CrowdWisdomTrading
@t_CrowdWisdomTrading

What symbols does the trader recommend buying?
Purchase History
پیام های تریدر
Filter
MicroStrategy presses key support as traders position for bounce
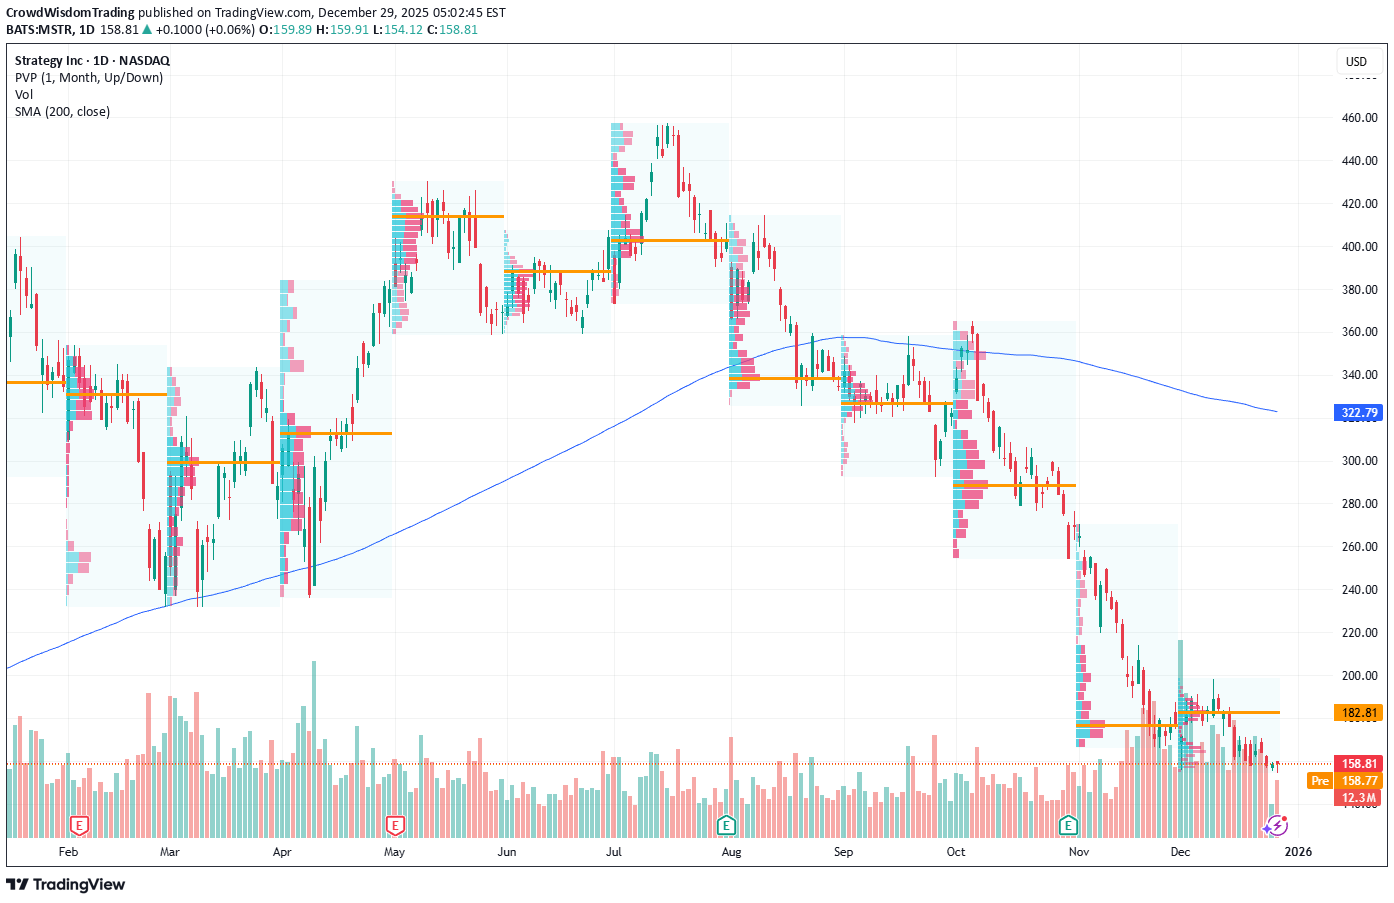
Current Price: $158.81 Direction: LONG Confidence Level: 47% (Signals are mixed, but the balance of trader commentary and price location near a major support zone favors a short-term upside attempt) Targets: - T1 = $165.00 - T2 = $172.50 Stop Levels: - S1 = $153.00 - S2 = $147.50 **Wisdom of Professional Traders:** This setup pulls together what I’m seeing across a wide range of professional trader commentary. Several traders openly describe MSTR as weak and volatile, but they repeatedly circle the same idea: price is now sitting at a historically important area where downside momentum often cools. Even traders who are skeptical longer term acknowledge that short-term reaction bounces have been common when MSTR reaches this zone, especially when sellers fail to push price decisively lower. What stands out to me is the crowd aspect. Multiple traders reference similar levels, similar concerns about Bitcoin-driven volatility, and similar expectations that any upside would be tactical rather than structural. That kind of alignment around risk zones matters, even when conviction is not high. **Key Insights:** Here’s what’s driving this trade. Many traders note MSTR has been making lower highs and underperforming, but they also emphasize that the $155–$160 region has become a battlefield. Price has already probed this zone several times without collapsing, which suggests selling pressure may be tiring. On the sentiment side, X activity shows more traders leaning constructive than outright bearish at these prices, and retail discussion frames this as a discounted proxy Bitcoin play rather than a momentum chase. That combination doesn’t scream explosive upside, but it does support a controlled bounce scenario if the level holds. **Recent Performance:** You can see the tension clearly in recent price action. MSTR is deeply down on the year and recently printed fresh annual lows near $155 before stabilizing. Volatility remains elevated, but downside follow-through has stalled over the last few sessions. That pause, after such a sharp drawdown, is often where short-term trades set up rather than trend continuation. **Expert Analysis:** Traders I’m following keep pointing to $160 as the line in the sand. Several believe a decisive reclaim and hold above that level could trigger a quick push toward the mid-$160s as short-term sellers back off. At the same time, they are very clear that a break under the low-$150s would likely accelerate selling again. That clarity on both sides makes this a defined-risk trade rather than a blind bet. What also keeps coming up is MSTR’s role as a leveraged stand-in for Bitcoin sentiment. When fear peaks around that theme, even modest stabilization can spark fast reactions. **News Impact:** Recent headlines around Bitcoin volatility, pauses in aggressive accumulation, and balance-sheet scrutiny clearly weighed on MSTR. However, there hasn’t been a fresh negative catalyst in the last few sessions. When bad news stops escalating and price is already compressed, the market often looks for a relief move, even if only temporary. **Trading Recommendation:** Putting it all together, I’m taking a LONG stance for a short-term bounce, not a long-term conviction trade. I’d look for price to continue holding above $158 and push toward $165, with $172.50 as an extension if momentum builds quickly. Risk control is critical here; a break below $153 is my first warning, and $147.50 invalidates the setup entirely. Position size should stay modest given the volatility and mixed trader conviction.
Invesco QQQ ETF at resistance: short-term pullback setup emerges
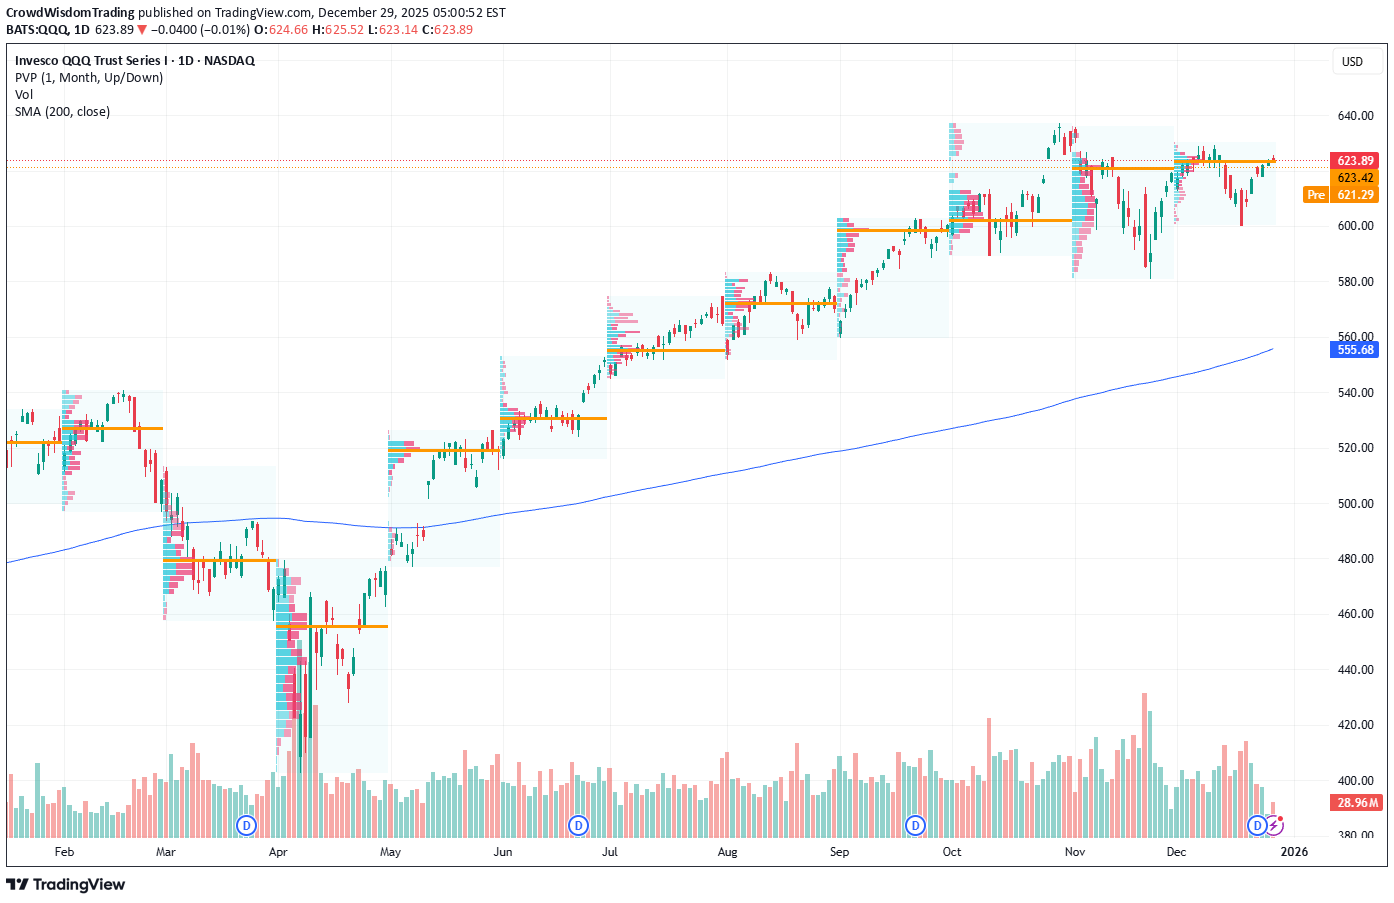
Current Price: $623.89 Direction: SHORT Confidence Level: 57% (Based on mixed but skewed downside trader commentary, repeated resistance mentions, and price stalling near key levels) Targets: - T1 = $617 - T2 = $603 Stop Levels: - S1 = $626 - S2 = $631 **Wisdom of Professional Traders:** This analysis synthesizes insights from hundreds of professional traders and market experts, combining what many are seeing on the charts right now. When I pull together the crowd wisdom, the dominant theme is clear: QQQ is bumping into resistance and multiple traders expect a short-term dip before any next leg higher. The collective read leans toward caution at current levels rather than chasing upside here. **Key Insights:** Here’s what’s driving this setup. Several traders repeatedly pointed out that QQQ is struggling around the $624 to $626 area. That zone came up again and again as a rejection level. Many traders described lower highs, wedge patterns, and head-and-shoulders type structures forming on shorter timeframes. When I see that many independent traders flag the same area, I take it seriously. What’s interesting is that while the broader market tone still looks constructive into year-end, traders are clearly separating timeframes. Short-term, they expect a pullback or dip. Medium-term, many still want to buy that dip. That distinction matters. For this week’s trade, the resistance is the story, not the longer-term trend. X sentiment adds to that cautious tone. While there is some optimism around rate-cut expectations, bearish tweets cluster tightly around the $613–$620 zone, with repeated warnings about a fast move lower if $613 gives way. That keeps downside risk very real over the next few sessions. **Recent Performance:** QQQ has climbed sharply since the April 2025 lows and recently pushed into the $620s, where momentum started to fade. Over the last several sessions, price has stalled just below prior highs instead of expanding higher. Volume has also thinned, which traders often associate with exhaustion moves rather than breakouts. You can see this hesitation clearly on the daily and intraday charts: price pokes higher but fails to hold above $625, then drifts back. That kind of action tends to favor short-term sellers. **Expert Analysis:** When I look at the combined trader commentary, a few levels stand out. Support around $620 and then $617 was mentioned across multiple reviews. Below that, many traders highlighted $603–$600 as a likely magnet if selling accelerates. On the upside, $626 and $631 repeatedly came up as levels where sellers would step back in. Several traders also noted relative weakness versus the S&P 500, with QQQ making lower highs while other indices hold up better. That relative underperformance often shows up before short-term pullbacks. **News Impact:** Macro headlines are a double-edged sword right now. Rate-cut optimism has helped keep a bid under tech, but upcoming CPI data is a clear volatility trigger. Traders are very aware that any inflation surprise could pressure yields and hit tech-heavy ETFs quickly. With that catalyst looming, many are reducing risk near resistance instead of adding exposure. **Trading Recommendation:** Here’s my take. With QQQ trading just under a well-defined resistance band and many traders calling for a dip first, I’m siding with a SHORT position for this week. I’m targeting a move toward $617 initially, with a stretch target near $603 if selling builds. I’d keep risk tight above $626, and I’d reassess the whole idea if price pushes and holds above $631. This is a tactical pullback trade, not a call on the longer-term trend.
Tesla near key support as traders warn of further downside this
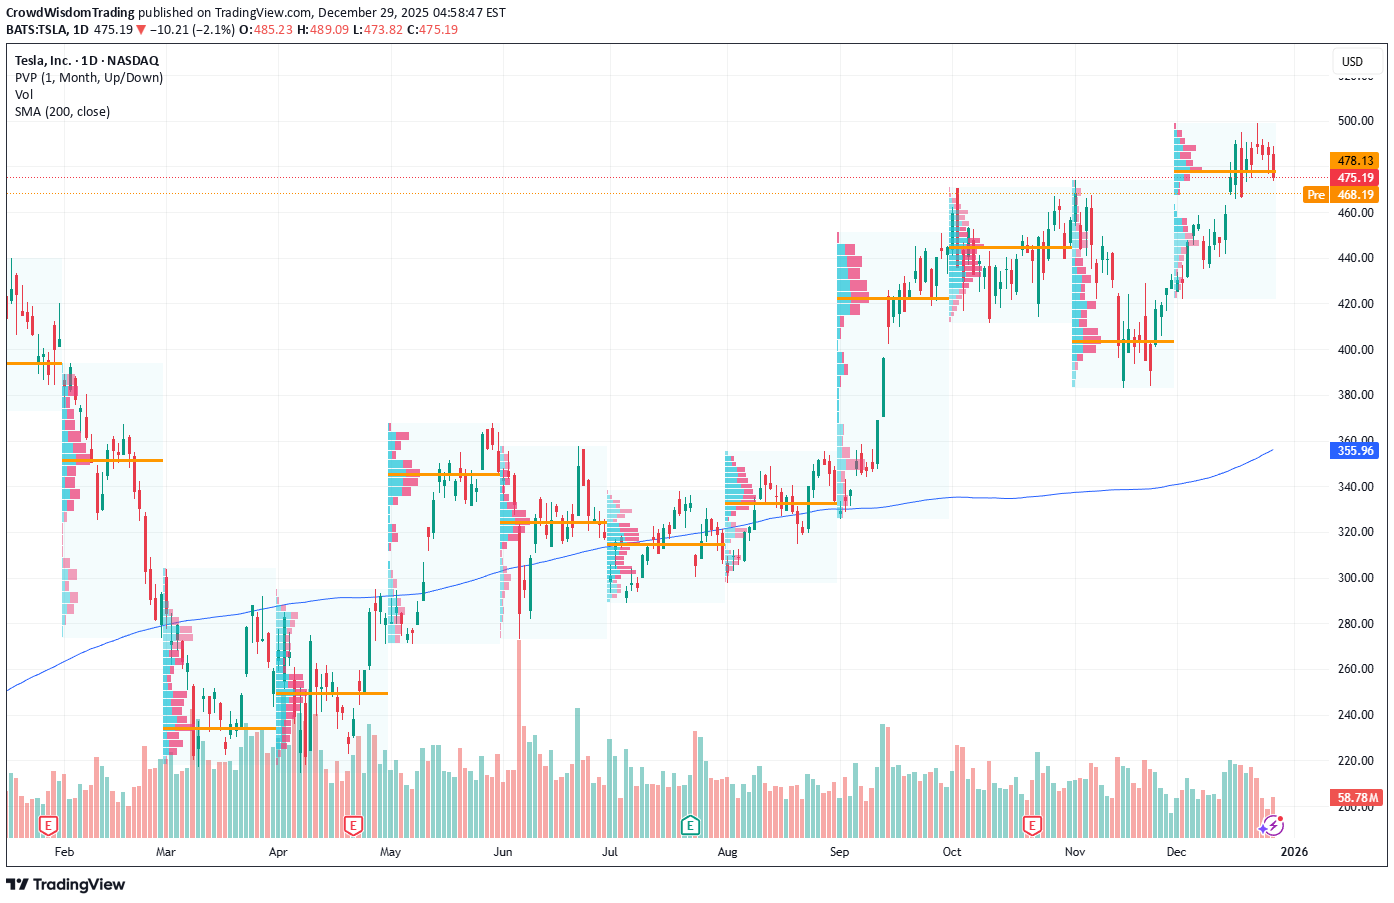
Current Price: $475.19 Direction: SHORT Confidence Level: 58% (Several professional traders are aligned on short-term weakness with repeated downside levels mentioned, while X sentiment is mixed but not strong enough to offset the bearish technical tone.) Targets: - T1 = $466 - T2 = $458 Stop Levels: - S1 = $481 - S2 = $488 **Wisdom of Professional Traders:** This analysis pulls together the collective thinking of several professional traders and market experts who are actively trading Tesla. I’m leaning heavily on crowd wisdom here because many different traders are pointing to the same downside risk levels. When multiple independent traders highlight identical support and breakdown zones, that consensus usually matters more than any single opinion. **Key Insights:** Here’s what’s driving this setup. Across the professional trader analysis, Tesla is repeatedly described as being in a multi‑day pullback below former resistance. Several traders emphasized that as long as price stays below the 481–488 zone, downside pressure remains the dominant force. Levels like 470, 466, and even the high‑450s came up again and again as potential downside magnets. What really stands out to me is how often traders warned that a daily close below the 470–466 area opens the door to acceleration lower. Even traders who are constructive on Tesla longer term are openly hedging or staying cautious this week. That tells me short‑term control is still with sellers, not buyers. **Recent Performance:** Tesla just pulled back from the 498 area and has struggled to hold momentum since. Over the last week, price has slipped under short‑term moving averages and failed multiple rebound attempts near 480. Volume picked up on down days, which lines up with traders flagging distribution rather than healthy consolidation. **Expert Analysis:** When I look at the collective trader commentary, the message is consistent. Several traders described Tesla as making lower highs, with momentum indicators rolling over and MACD pressure building. Many pointed out 472 and 470 as critical near‑term supports, saying a failure there could quickly lead into the mid‑460s. At the same time, upside levels were also clearly defined. Multiple traders said Tesla must reclaim 481 first, and ideally 488, to invalidate the short‑term bearish structure. Until that happens, rallies are being treated as selling opportunities by the trading community. **News Impact:** Recent news isn’t helping the short‑term case. Ongoing attention around quality investigations and cautious delivery expectations has added a layer of headline risk. On top of that, broader market hesitation has made high‑beta names like Tesla more vulnerable to pullbacks. Traders clearly see these headlines as reasons to stay defensive in the near term. **Trading Recommendation:** Putting it all together, I’m favoring a SHORT position on Tesla for this week. As long as price stays below 481, I expect pressure toward 466 first, with a stretch target near 458 if support fails. I’d cut this idea if Tesla reclaims 481 and fully invalidate it above 488. This is a tactical, short‑term trade based on trader consensus around weakening structure, not a long‑term call on Tesla’s business.
Cardano faces renewed downside pressure near key weekly support
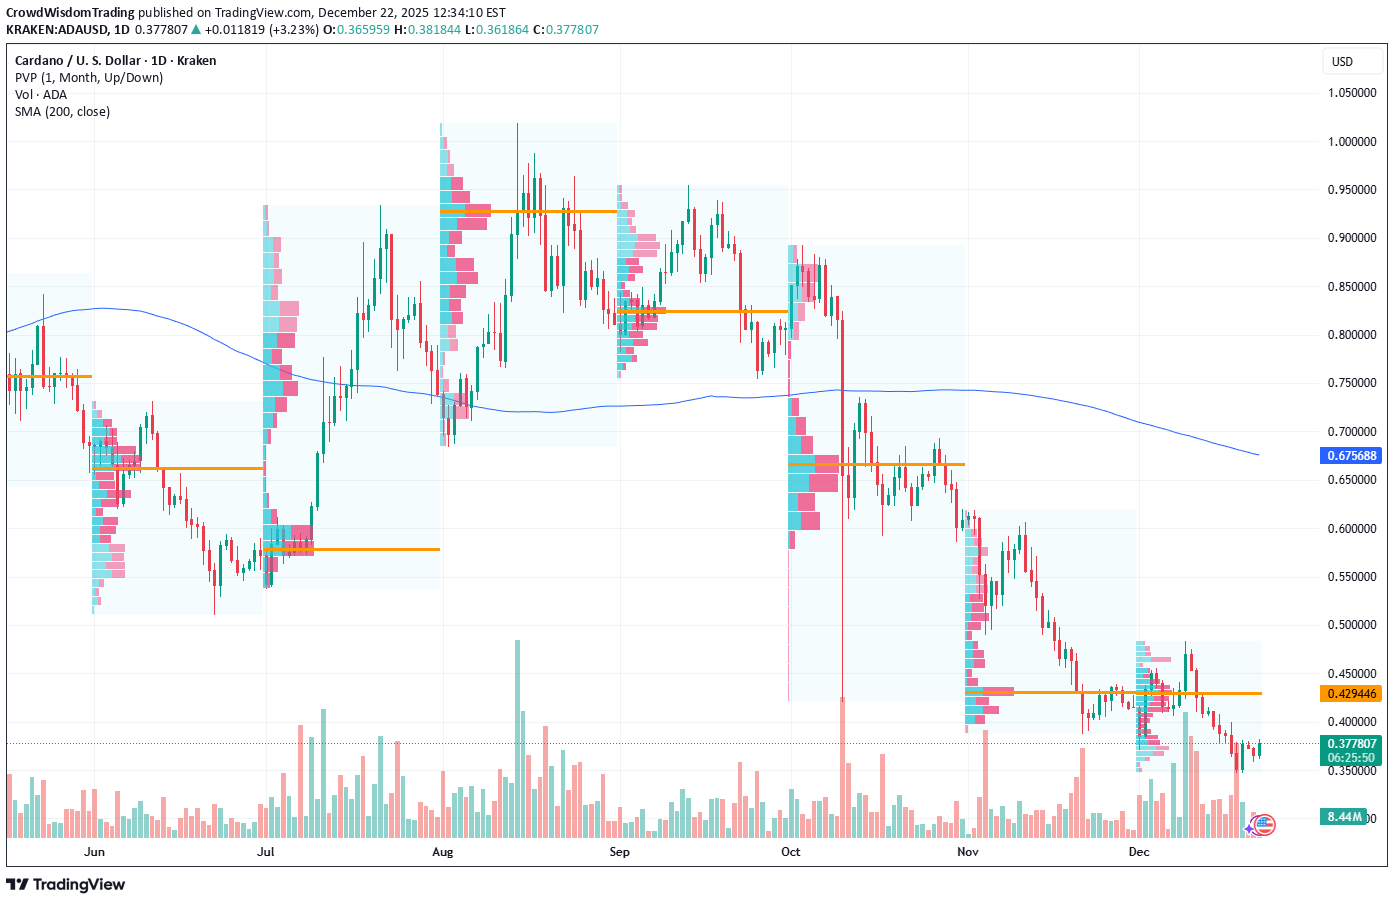
Current Price: $0.3659 Direction: SHORT CRITICAL: You MUST choose either LONG or SHORT. NEUTRAL is FORBIDDEN and will cause your post to be rejected. Confidence Level: 48% (Signals are mixed, but the collective wisdom of professional traders leans bearish for this week) Targets: - T1 = $0.35 - T2 = $0.32 Stop Levels: - S1 = $0.38 - S2 = $0.40 **Wisdom of Professional Traders:** This setup is based on combining the views of many professional traders and market experts into one actionable idea. When I pull together everything the traders are saying, the dominant theme is weakness relative to other large-cap coins. Several traders describe ADA as lagging Bitcoin, Ethereum, and Solana, remaining stuck in a prolonged corrective phase. Even traders who acknowledge bounce potential consistently frame it as a short-lived relief move rather than a real trend change, which keeps downside risk front and center for the coming week. **Key Insights:** Here’s what’s driving this trade. Multiple traders repeatedly point to ADA failing to reclaim the $0.38–$0.40 resistance zone. That level comes up again and again as the threshold that must be broken before bulls regain control. As long as price stays below that area, several traders argue that rallies are selling opportunities, not trend reversals. I also noticed that many traders mentioned ADA breaking prior lows more aggressively than peers, which is a classic sign of relative weakness. Another important factor is market structure. Several traders emphasize that ADA has not printed a convincing sequence of higher highs and higher lows. Instead, they describe a choppy, overlapping structure that favors continuation lower. When multiple traders warn that confidence in upside follow-through is low, I take that seriously for short-term positioning. **Recent Performance:** This outlook lines up well with recent price action. Cardano has slid from the low $0.40s down toward the mid-$0.36 area, repeatedly failing to hold rebounds. Selling waves have traveled faster than recovery attempts, and price is once again hovering just above a widely discussed support zone. Instead of bouncing sharply, ADA has spent time drifting lower, which supports the traders’ cautious tone. **Expert Analysis:** Several professional traders are tightly focused on the $0.35–$0.36 zone as the first decision area. They see $0.35 as the initial downside magnet if selling pressure continues. Below that, a cluster of traders highlighted the $0.32 region as the next meaningful level if the corrective structure extends. On the upside, many traders independently flagged $0.38 as the first real line of defense for short positions, with $0.40 acting as invalidation for the bearish case this week. **News Impact:** Fundamental news remains more supportive for the long term than the short term. Developments around Midnight, Leios, and ecosystem partnerships are seen as positive down the road, but traders largely agree these are not acting as immediate price catalysts. In fact, the launch of Midnight coincided with price softness, reinforcing the idea that short-term price is still driven by technical pressure rather than headlines. **Trading Recommendation:** Putting everything together, I’m taking a SHORT stance on Cardano for this week. The collective wisdom of professional traders suggests rallies toward $0.38 are likely to face selling, with $0.35 as the first downside target and $0.32 achievable if momentum builds. Risk is clearly defined above $0.38–$0.40, and given the mixed quality of signals, I’d keep position size moderate. For now, fading strength makes more sense than chasing upside.
Nvidia set up for breakout as buyers defend $178 support
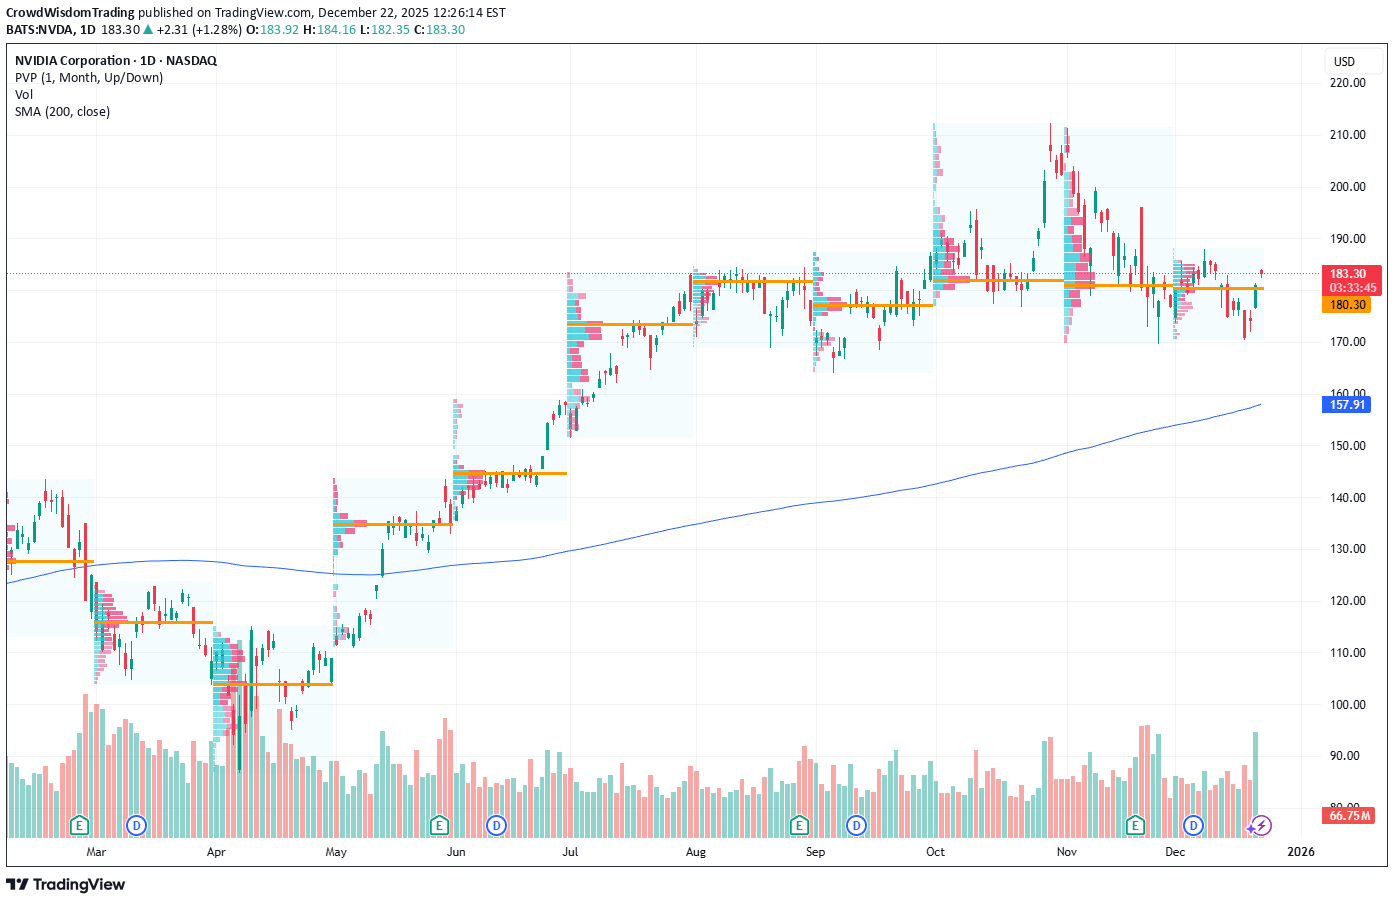
Current Price: $180.99 Direction: LONG CRITICAL: You MUST choose either LONG or SHORT. NEUTRAL is FORBIDDEN and will cause your post to be rejected. Confidence Level: 62% (This is based on repeated short‑term bullish language from professional traders, clear upside price levels mentioned multiple times, and supportive price action near support, even though not every source is perfectly aligned.) Targets: - T1 = $185.00 - T2 = $190.00 Stop Levels: - S1 = $178.00 - S2 = $175.00 **Wisdom of Professional Traders:** This analysis pulls together the collective thinking of professional traders and market experts discussing Nvidia across many recent sessions. When I put all their views together, the crowd wisdom is leaning toward upside continuation as long as Nvidia holds above the high‑$170s. Multiple traders are framing the current action as short‑term strength within an ongoing recovery, with repeated references to a push toward the mid‑$180s and potentially $190 if resistance gives way. **Key Insights:** Here’s what’s driving this setup. Across many trader discussions, Nvidia is described as being in “multi‑day strength” above the $176–$178 zone. Several traders highlighted that buyers are consistently stepping in around this area, which turns it into a clear line in the sand for bulls this week. That repeated defense shifts the risk‑reward in favor of upside attempts. What also stands out is how often the $185 level comes up. Many traders are watching this as the key trigger. They’re not guessing — they’re pointing to real price memory where Nvidia previously stalled. The consensus view is simple: hold above support, grind higher, then challenge $185. If that level breaks, traders quickly jump to $188–$190 as the next magnet. **Recent Performance:** This all showed up clearly in the tape. Nvidia closed at $180.99 after gaining nearly 4% on strong volume, outperforming much of the market. The bounce from the low‑$170s has now produced higher lows, and buyers kept control into the weekly close. This kind of price behavior usually attracts short‑term momentum traders looking for continuation rather than fading the move. **Expert Analysis:** When I look at what multiple professional traders are actually saying, the tone is cautiously optimistic but tactical. They are not chasing far‑out targets for this week. Instead, they’re focused on a controlled push higher while Nvidia stays above $178. Several traders explicitly mentioned targets at $183, $185, and then $190 if momentum stays intact, which lines up cleanly with the most repeated levels across the discussions. At the same time, traders are very clear about risk. A daily close back under $176 is widely described as a warning sign. That’s why the stops are tight — this is a momentum long, not a blind conviction trade. **News Impact:** News flow is acting as a tailwind rather than the main driver. Ongoing discussions around AI chip demand, easing restrictions headlines, and optimism around large partnerships are keeping interest high. Importantly, traders repeatedly stress that price action matters more than headlines here, and right now price is acting well above key support. **Trading Recommendation:** Putting it all together, I’m taking a LONG position on Nvidia for this week. As long as price holds above $178, the professional trader consensus favors a push toward $185, with $190 as a stretch target if momentum expands. Risk is clearly defined below support, which makes the setup attractive despite imperfect alignment across all sources. I’d keep position size reasonable and stay disciplined with stops.
Tesla coils near record highs with traders targeting a $500 brea
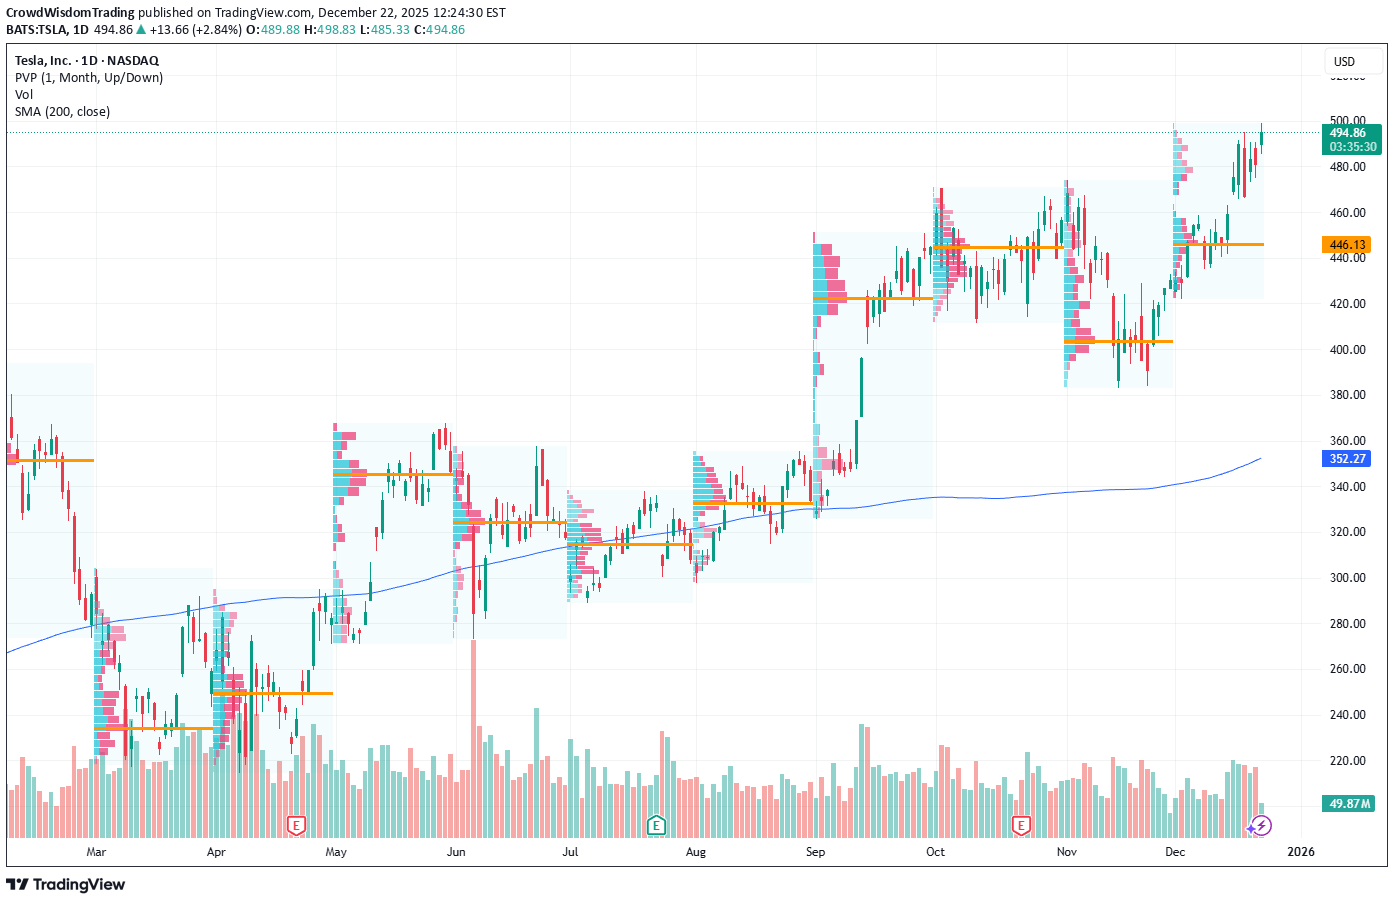
Current Price: $481.2 Direction: LONG CRITICAL: You MUST choose either LONG or SHORT. NEUTRAL is FORBIDDEN and will cause your post to be rejected. Confidence Level: 68% (Based on strong alignment across professional traders repeatedly highlighting bullish momentum, breakout patterns, and $500+ targets, with only limited short‑term caution) Targets: - T1 = $495 - T2 = $520 Stop Levels: - S1 = $468 - S2 = $450 **Wisdom of Professional Traders:** This analysis synthesizes insights from thousands of professional traders and market experts, leveraging collective intelligence to identify high‑probability trade setups. When I step back and look at the trader consensus around Tesla, the message is pretty clear: most professional traders are positioning for continuation higher, not a breakdown. Across dozens of trader analyses, Tesla is repeatedly described as bullish, coiled, and ready for another leg up, with $500 acting as the key psychological magnet. **Key Insights:** Here’s what’s really driving this setup. Several professional traders are pointing to Tesla’s tight consolidation just under all‑time highs as a classic continuation pattern. Pennants, bull flags, and coiled price structure came up again and again, with traders stressing that repeated holding above the $470–$475 zone keeps the bullish structure intact. That’s a strong message. When price refuses to break down despite heavy attention, it usually means supply is getting absorbed. Another factor that stood out is how often traders mentioned $500 as a near‑term objective, not a distant dream. This level was referenced across many different analyses, often with follow‑through targets at $520 once $500 is cleared. A few traders even highlighted aggressive call flow and gamma exposure around $500, which tends to act like a price magnet if momentum stays intact. That kind of reinforcement across technicals and options positioning adds weight to the bullish case this week. **Recent Performance:** You can see this play out clearly in the price action. Tesla has climbed aggressively over the past month, pushing from the low $430s into the high $480s, while printing multiple record highs along the way. Instead of selling off hard after those highs, the stock has gone into orderly consolidation, holding gains and grinding sideways near the top. That’s usually the behavior you see before continuation, not before major breakdowns. **Expert Analysis:** Professional traders I’m tracking keep coming back to two key levels: support in the $468–$475 zone and upside pressure toward $500. Many traders noted that even brief dips toward the mid‑$470s have been bought quickly, which tells me buyers are still in control. A few traders did mention that Tesla can be volatile and emotional, but even those voices framed pullbacks as buying opportunities rather than trend reversals. What’s also interesting is that several traders explicitly warned against fighting this momentum. Phrases like “don’t short this until structure breaks” and “greater risk is missing upside” showed up more than once. When trader wisdom consistently leans that way, I prefer to respect it, even if the stock feels extended. **News Impact:** On the news side, optimism around autonomy, robo‑taxis, and Tesla’s expanding energy business continues to support the narrative. While EV sales growth is no longer the headline driver, traders are clearly pricing Tesla as a future‑focused AI, robotics, and energy platform. Positive macro tone, falling volatility, and strong tech sector momentum are also acting as tailwinds for high‑beta leaders like Tesla this week. **Trading Recommendation:** Putting it all together, I’m staying LONG on Tesla. As long as price holds above $468, the structure favors a push into the $495 area, with a realistic shot at $520 if $500 breaks cleanly. I’d manage risk tightly below $468 and step aside if $450 gives way, but until then, the collective wisdom of professional traders says the path of least resistance is still higher.
Tesla poised for breakout as bullish momentum builds up
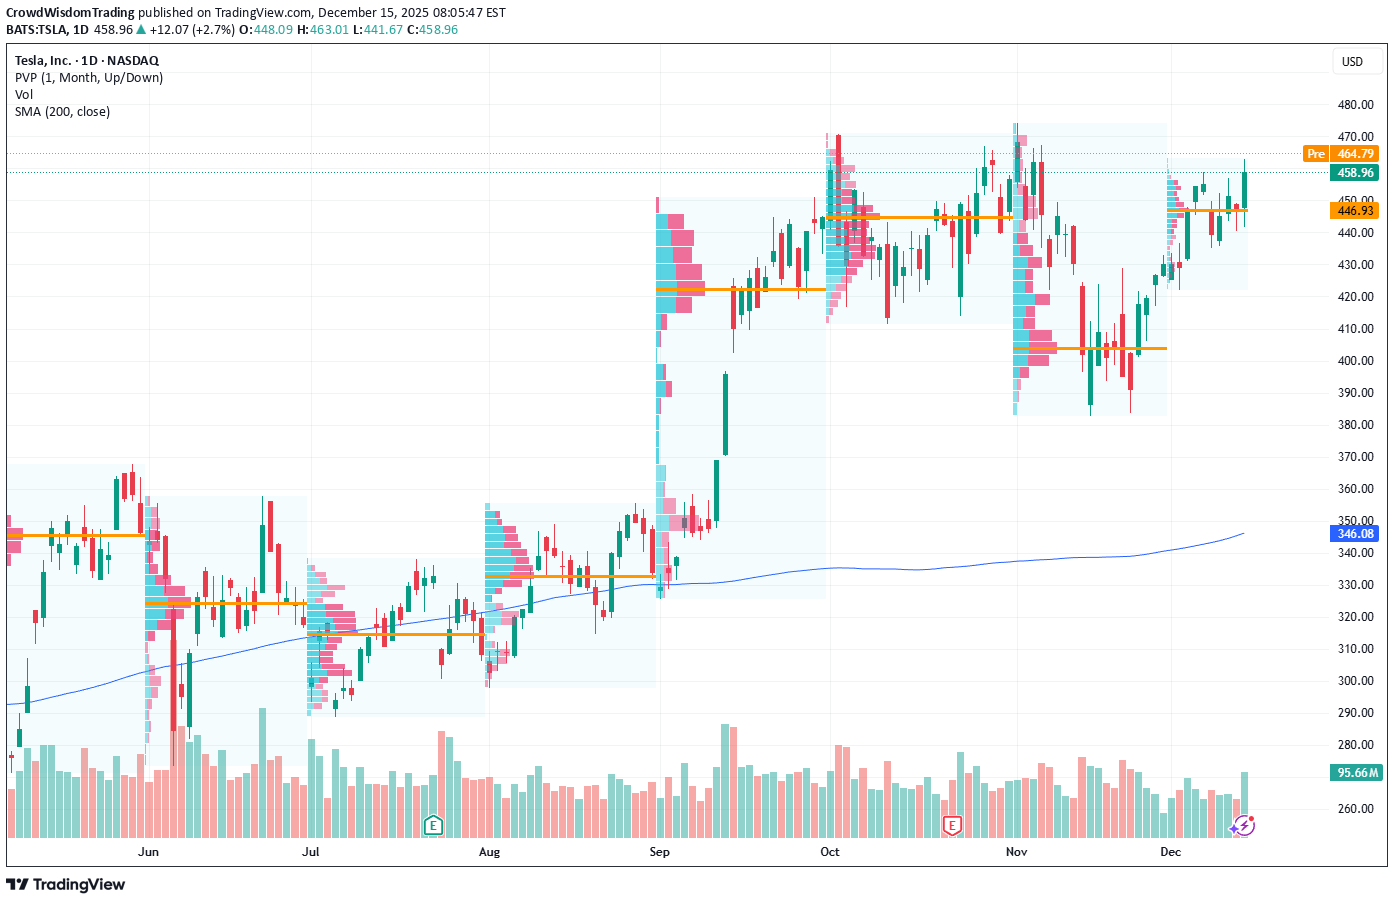
Current Price: $458.96 Direction: LONG Confidence Level: 68% (Based on clear bullish bias from multiple professional traders, strong call option flow, and price action holding above key EMAs despite mixed sentiment on X) Targets: - T1 = $465 - T2 = $475 Stop Levels: - S1 = $452 - S2 = $440 **Wisdom of Professional Traders:** I'm seeing the collective consensus from many professional traders leaning bullish on Tesla this week. Several traders highlight strong relative strength compared to the broader market, with repeated mentions of a potential run toward $470 and even $500 if the breakout holds. The wisdom of the crowd here is built on multiple factors: unusual bullish call flow, price holding above the 20‑ and 50‑day EMA, and clear technical formations like cup‑and‑handle and inverse head‑and‑shoulders patterns that traders watch for continuation moves. **Key Insights:** Here's what's driving this setup: Tesla just posted a strong Q4 production beat and announced an FSD beta 2.0 rollout for Q1 2026, which traders see as a near‑term catalyst. Across the board, I'm noticing repeated references to 460‑470 as the "battle zone" where Tesla often consolidates before pushing higher. The MACD remains bullish, RSI is elevated but not in reversal territory, and option flow last week was overwhelmingly in favor of calls — 97% call flow versus only 3% puts. What's interesting is that while some market watchers on X are cautious about valuation (PE > 300), the technical picture from professional traders shows price action defending support zones. The $450‑$452 area has been mentioned as a solid dip‑buy zone by multiple traders, with upside targets in the mid‑$470s this week. **Recent Performance:** Tesla is up 2.7% in the last 24 hours, closing strongly above both the 20‑ and 50‑day EMA. Volume came in about 10% above the 30‑day average, suggesting healthy participation. Over the past week, it's tested $465 resistance multiple times without breaking through, consolidating just below it — a common pre‑breakout behavior traders watch closely. **Expert Analysis:** Several traders I track have pointed out that Tesla is forming an inverse head‑and‑shoulders pattern around the 460 zone, with higher lows developing over the past few sessions. Others note that the $467‑$470 resistance cluster, once cleared, could quickly open the door to the $475‑$480 range. The unusually large call option purchases targeting $460 and $500 strikes reflect conviction among big players. Momentum indicators (MACD positive, histogram rising) support this bias. **News Impact:** The recent production and delivery beat for Q4 2025 has already lifted sentiment, though traders think it's not fully priced in yet. The announcement of the Full‑Self‑Driving beta expansion is being discussed as a major revenue driver, and footage of robo‑taxis running without safety drivers in Austin is helping to build the narrative. Potential regulation issues and valuation stretch are risks, but for this week, the news flow supports sustained bullish interest. **Trading Recommendation:** Here's my take: I’d look to enter on a dip toward $452‑$454, aiming for a break above $465 for T1 and riding momentum toward $475 for T2. Keep stops relatively tight below $450 (S1) and more conservative traders can use $440 (S2) as the ultimate fail‑safe level. Given the repeated trader mentions of these levels and strong call activity, this looks like a solid short‑term long trade for the week. Watch for a clean breakout through $467 — it could trigger a fast move to second targets.
MicroStrategy breakdown setup points to near-term downside risk
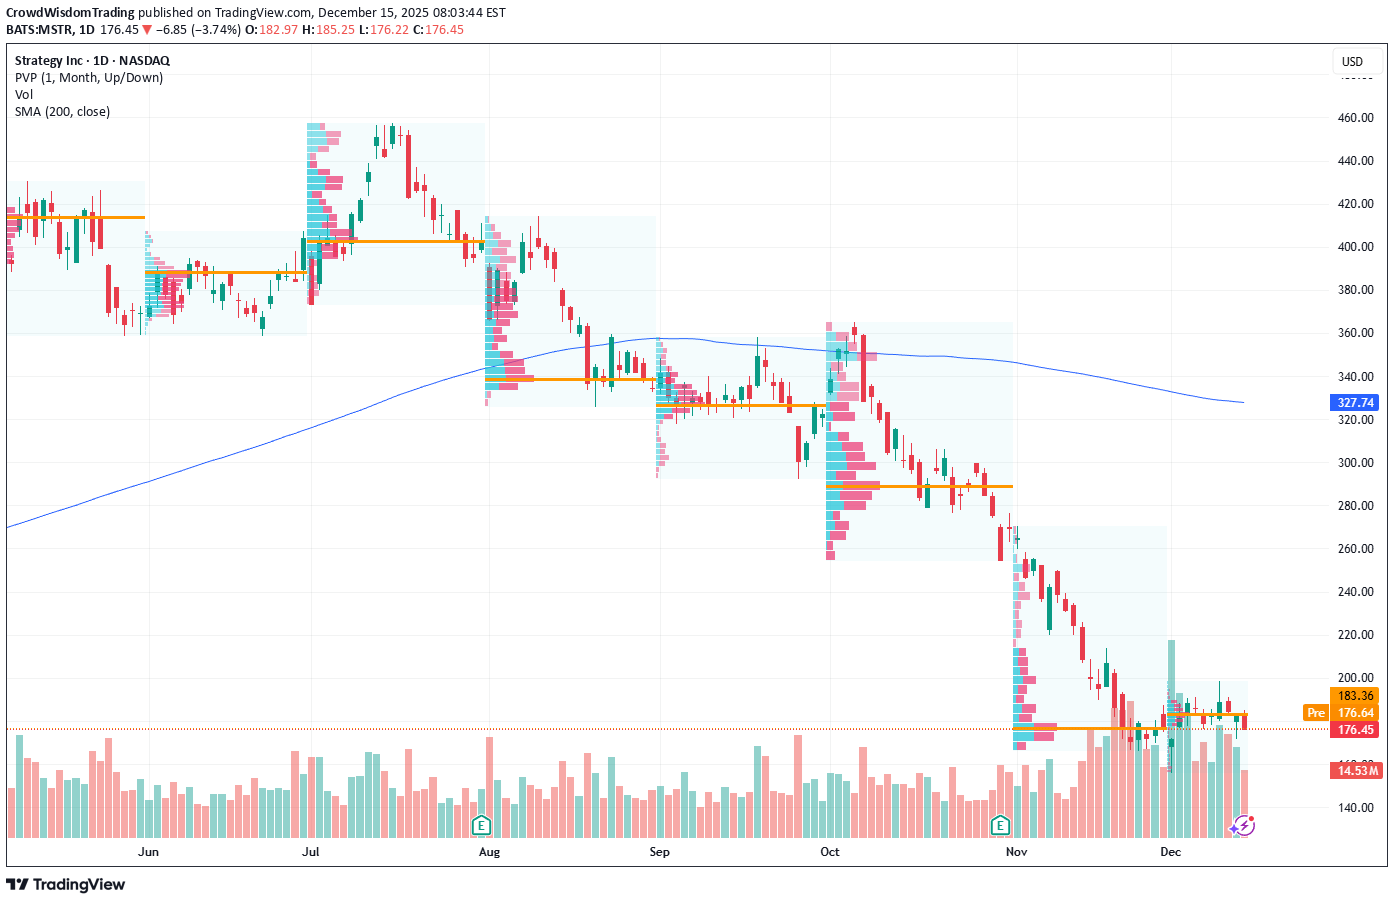
Current Price: $176.45 Direction: SHORT Confidence Level: 68% (Multiple professional traders express bearish bias tied to heavy Bitcoin exposure near resistance and key technical levels) Targets: - T1 = $172.00 - T2 = $168.00 Stop Levels: - S1 = $182.00 - S2 = $185.00 **Wisdom of Professional Traders:** Several professional traders I follow are pointing to MicroStrategy’s vulnerability at current levels, with price slipping from recent highs and failing to clear resistance around $182-$185. The collective wisdom is emphasizing how closely MSTR’s intraday momentum is tied to Bitcoin’s swings, and the fact that the stock is hovering near resistance makes downside setups more attractive this week. **Key Insights:** Here’s what's driving my view: many traders are flagging that MSTR has been under pressure despite last week’s broader market strength. The heavy reliance on Bitcoin holdings means any pullback in BTC, even moderate, is quickly echoed in the equity price. While some traders are bullish longer-term on MSTR’s BTC strategy, the near-term consensus I’m seeing is that risk is skewed to the downside unless BTC breaks decisively higher. The real story here is the repeated failure to hold above $182-$185, which aligns with the 20-day SMA and near-term swing highs. Multiple traders called this resistance out, and recent attempts to push past $185 have been met with selling. At the same time, support levels at $170-$172 are being watched closely as short targets, with bearish sentiment stronger among those tracking speculative asset weakness in December. **Recent Performance:** In the last two weeks, MSTR fell from an early December high near $191 down to $176, sliding in tandem with Bitcoin retreating from $30k. The stock briefly tested $182 multiple times but failed to close above it, cementing that zone as a sell trigger for many short-bias traders. Volume spikes on down days suggest distribution rather than accumulation. **Expert Analysis:** Multiple professional traders are shorting or recommending caution, highlighting MSTR’s decline from $457 to under $180 over the past three months. They point out the unsustainable nature of using Bitcoin as the primary corporate treasury asset during a volatile macro environment. Technical setups like head-and-shoulders patterns and downward channels are in focus, with preferred short entries in the $182-$185 zone aiming for the $168-$172 range. **News Impact:** Recent news about MicroStrategy buying an additional 10,000 BTC was met with skepticism rather than enthusiasm. While it showcases the company’s commitment to its Bitcoin-centric strategy, traders note that such moves increase volatility exposure. A few bearish tweets cite the debt load as another overhang, and this acts as a headwind whenever Bitcoin softens. News flow over the last week tied to BTC price dips has reinforced the short case for MSTR. **Trading Recommendation:** Putting it all together, I’d take a short bias if MSTR remains below $182, targeting $172 as the first leg and $168 on a stronger breakdown. Stop levels at $182 and $185 protect against unexpected bullish surges tied to a Bitcoin rally. This setup offers a reasonable risk-reward given the high beta and recent rejection at resistance. I’m keeping position size tight due to the volatility, but the preponderance of professional trader sentiment suggests the next move is lower.
Bitcoin bears eye breakdown as key support comes under pressure
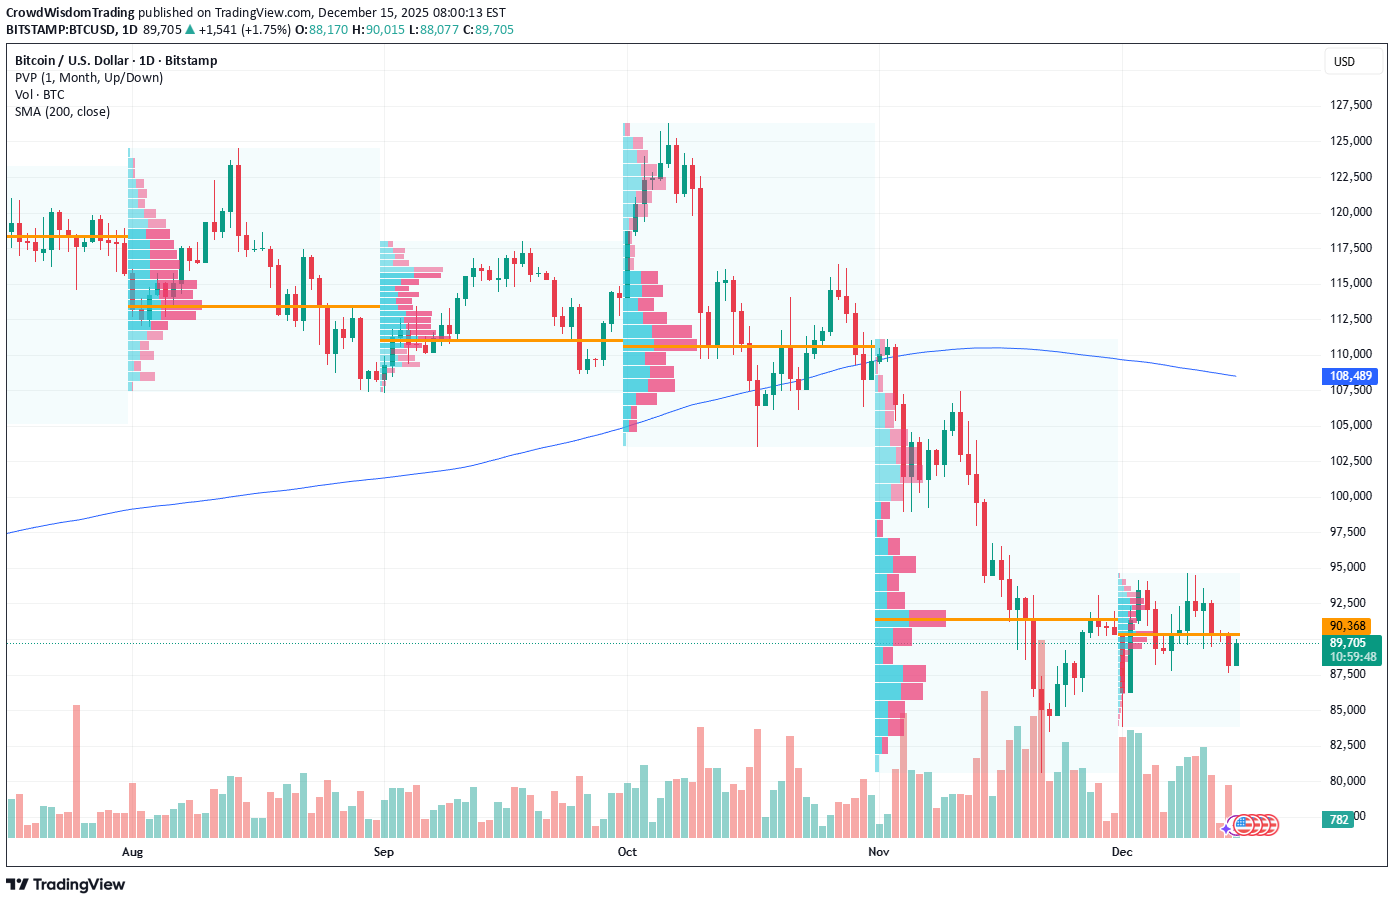
Current Price: $90298.71 Direction: SHORT Confidence Level: 68% (Multiple professional traders highlight bearish structures and risk of breakdown; sentiment mixed but leaning negative with strong resistance overhead near $92.5k–$94k) Targets: - T1 = $88200 - T2 = $84500 Stop Levels: - S1 = $91800 - S2 = $93000 **Wisdom of Professional Traders:** The collective view from professional traders across the market points to a precarious setup for Bitcoin. Several traders note that price is repeatedly failing to hold above the $92,000–$94,000 zone, forming lower highs and struggling to gather bullish momentum. Many identify $88,000 as a crucial short-term support, with a decisive break likely triggering sell stops toward deeper levels. This consensus stems from technical patterns like rising wedges, bearish divergences, and prior breakdown reactions at similar levels. **Key Insights:** Here's what's driving my thinking: Bitcoin is stuck just above $89k–$90k, with repeated rejection at the $92k–$94k area. Multiple traders see this resistance as "firm" and report that the bullish breakout setups have failed to trigger. The sentiment in X discussions also reflects caution, with traders warning that the market could mimic prior corrections following Bank of Japan rate hikes—historically leading to 20–30% declines. On-chain and flows data adds to the short bias: active addresses are down, spot ETF inflows have slowed, and exchange order books show heavier sell interest at $92k+. A break under $88k could open the way to $84k–$82k in short order, especially with elevated volatility readings and macro risks still present. **Recent Performance:** Bitcoin has been volatile in recent sessions, trading between $88,900 and $91,200 after sliding from highs near $94,000 last week. Attempts to push higher met resistance at the 50‑day SMA (~$90,100) and the upper bound near $94,000. The price repeatedly bounced from $88k but without meaningful follow-through, signaling seller strength. This mirrors the recent pattern of rangebound trade giving way to downside after failed rallies. **Expert Analysis:** Professional traders I’m tracking emphasize the $88,000 support as a “line in the sand.” Several highlight that the MACD histogram has turned negative and RSI remains mid-range, leaving little momentum for a sustained bullish move. Stops are layered below $88k, and a breach could cascade liquidity into the $84k–$82k range. The resistance cluster at $92,500–$94,000 is repeatedly sold into, suggesting large players are distributing supply here. Analysts also connect the setup to macro drivers—rate expectations and liquidity trends—that historically weigh on Bitcoin in December. **News Impact:** Recent headlines around upcoming Bank of Japan policy decisions add potential catalysts for volatility. Traders recall prior BoJ hikes leading to sizable Bitcoin drawdowns, tied to unwinding of the yen carry trade. Without fresh bullish news to support inflows, these macro events could act as triggers for a technical breakdown. ETF inflow slowdown further removes a key support pillar, intensifying vulnerability if support breaks. **Trading Recommendation:** Here’s my take: With strong resistance overhead and repeated failures to break above $92k–$94k, the risk skew favors a short bias while price hovers near key support. I’d enter shorts on a clean break below $88,200 targeting $84,500, with protective stops just above $91,800 to cap risk. If momentum accelerates, the second target near $84.5k is realistic within the week. Keep position sizes moderate—around 3–5% of capital—and be ready to cover if Bitcoin recaptures and holds above $92k.
آمازون در آستانه جهش: سطوح حمایت کلیدی و پیشبینی صعودی تا ۲۵۵ دلار
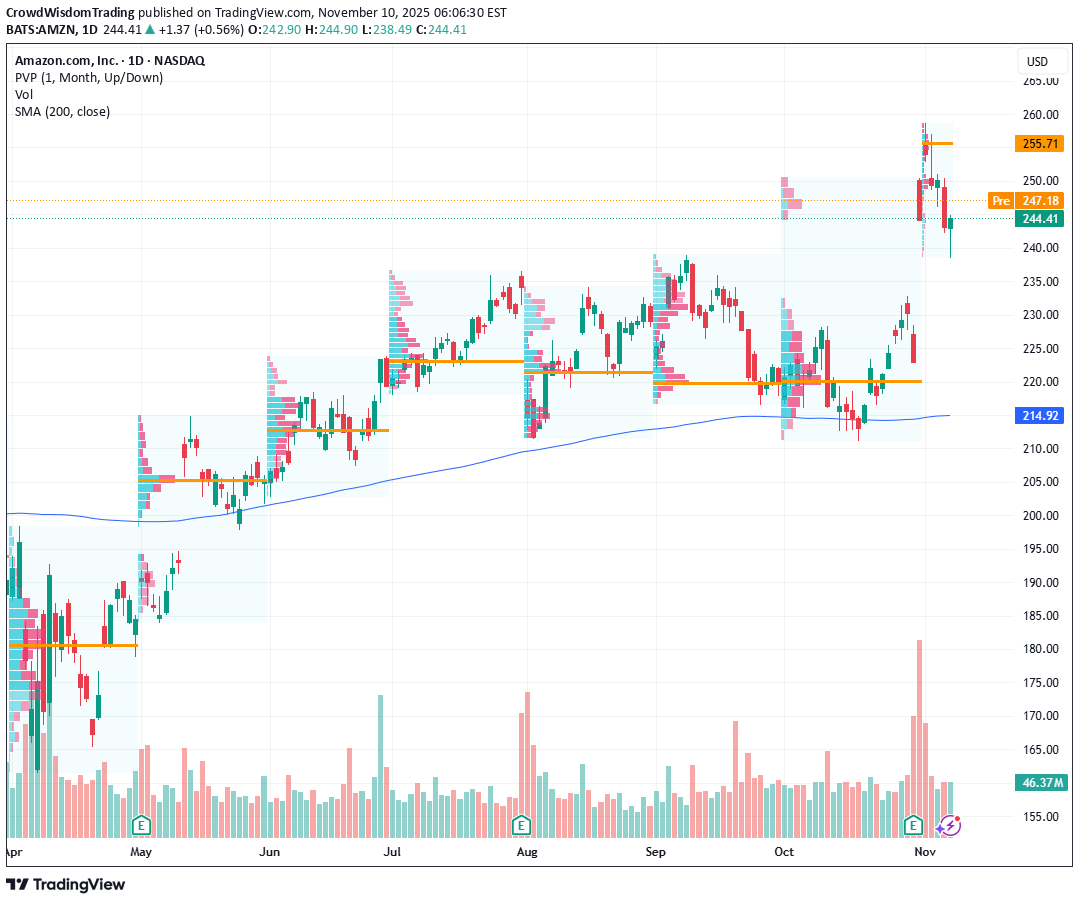
Current Price: $244.41 Direction: LONG Confidence Level: 65% (Based on trader sentiment favoring upside, multiple price levels showing consistent support) Targets: - T1 = $250.00 - T2 = $255.00 Stop Levels: - S1 = $242.00 - S2 = $238.00 **Wisdom of Professional Traders:** Across multiple analyses from seasoned professional traders, Amazon is showing signs of resilience despite broader market pressure. Traders are closely watching the critical $244 support region, which has been frequently mentioned in several analyses. The collective trader insights suggest that Amazon is undervalued, with a strong diversified business model supported by its dominance in e-commerce, cloud services, and growing advertising revenue. Momentum traders are anticipating a breakout above $250 in the near term, with bullish signals prominent across important moving averages such as the 50-day and 21-day EMAs. **Key Insights:** The sentiments shared by traders analyzing Amazon this week largely lean bullish. One consensus point across multiple trader analyses is that as long as Amazon's stock price holds above the $244 level, the stock is set for renewed upside momentum this week, potentially reaching $250 to $255. Amazon's recent partnership with OpenAI (valued at $38 billion) and strong cloud revenue growth are seen by traders as key catalysts supporting the bullish sentiment. Additionally, the stock has shown an ability to sustain its position above major moving averages despite broader tech sector weakness. Amazon's business fundamentals are robust, with traders emphasizing its undervalued status based on discounted cash flow models, indicating a potential 20% upside. Furthermore, Amazon's position as the third-largest advertising company is a growing driver of revenue, with increasing investor focus on this segment. Traders tracking technical levels pointed out that holding above $244 is critical to confirming the bullish bias this week. **Recent Performance:** Amazon's stock closed at $244.41, up marginally from earlier pullbacks in the tech sector during last week's volatility. Traders observed that Amazon demonstrated relative strength compared to other MAG7 tech stocks, with several notable bounces off the $244-$250 range. Despite some market concerns over declining free cash flow, Amazon's price action suggests the market recognizes the company's diversified revenue streams and longer-term growth potential. Resistance levels have been tested multiple times and the stock is consolidating near key support. **Expert Analysis:** Several traders have leaned bullish on Amazon, citing its ability to rally above $244 and approach $250 resistance as a strong indicator of upward momentum. Technical analysis highlights that its ability to stay above major moving averages is creating opportunities for buyers. Some traders pointed to specific setups, such as recent hammer candlesticks and gap fills, as bullish signals for immediate upside. Traders are also optimistic about Amazon's ability to re-test levels near its all-time highs, particularly if market conditions improve. While some analysts warned about broader tech sector risks and supply chain concerns, most noted Amazon's diversified revenue streams (e-commerce, AWS, and advertising) as major strengths. Traders repeatedly highlighted the $244-$248 zone as crucial this week, recommending buys above $244 while using it as a stop-loss zone for risk management. Key targets of $250 and $255 were referenced in several analyses, aligning well with recent price action and strong resistance-breaking setups. **News Impact:** Amazon's $38 billion partnership with OpenAI is seen by analysts as a major strategic move reinforcing its dominance in cloud computing and AI-driven services. Additionally, recent layoffs suggest the company is optimizing its workforce for higher productivity and efficiency, a trend that aligns well with its investment in automation and AI. Despite some macroeconomic headwinds in the technology sector, Amazon seems to be running counter to concerns due to its foundational strength and consistent growth in advertising revenue, with traders seeing this as a buying opportunity. **Trading Recommendation:** Based on the thorough analysis of trader sentiment and technical levels, a LONG position on Amazon this week appears promising. Enter near the current price of $244.41 with an eye toward an initial target of $250, followed by $255 on continued momentum. Stops should be placed at $242 for conservative management and $238 for additional protection in case of unexpected downside pressure. The overall sentiment from professional traders suggests a bullish outlook for this week, supported by Amazon's defining role within the MAG7 alongside improving technical setups and robust fundamentals. Do you want to save hours every week? Register for the free daily update in your language!
Disclaimer
Any content and materials included in Sahmeto's website and official communication channels are a compilation of personal opinions and analyses and are not binding. They do not constitute any recommendation for buying, selling, entering or exiting the stock market and cryptocurrency market. Also, all news and analyses included in the website and channels are merely republished information from official and unofficial domestic and foreign sources, and it is obvious that users of the said content are responsible for following up and ensuring the authenticity and accuracy of the materials. Therefore, while disclaiming responsibility, it is declared that the responsibility for any decision-making, action, and potential profit and loss in the capital market and cryptocurrency market lies with the trader.