Technical analysis by CrowdWisdomTrading about Symbol QQQX: Sell recommendation (12/29/2025)

Invesco QQQ ETF at resistance: short-term pullback setup emerges
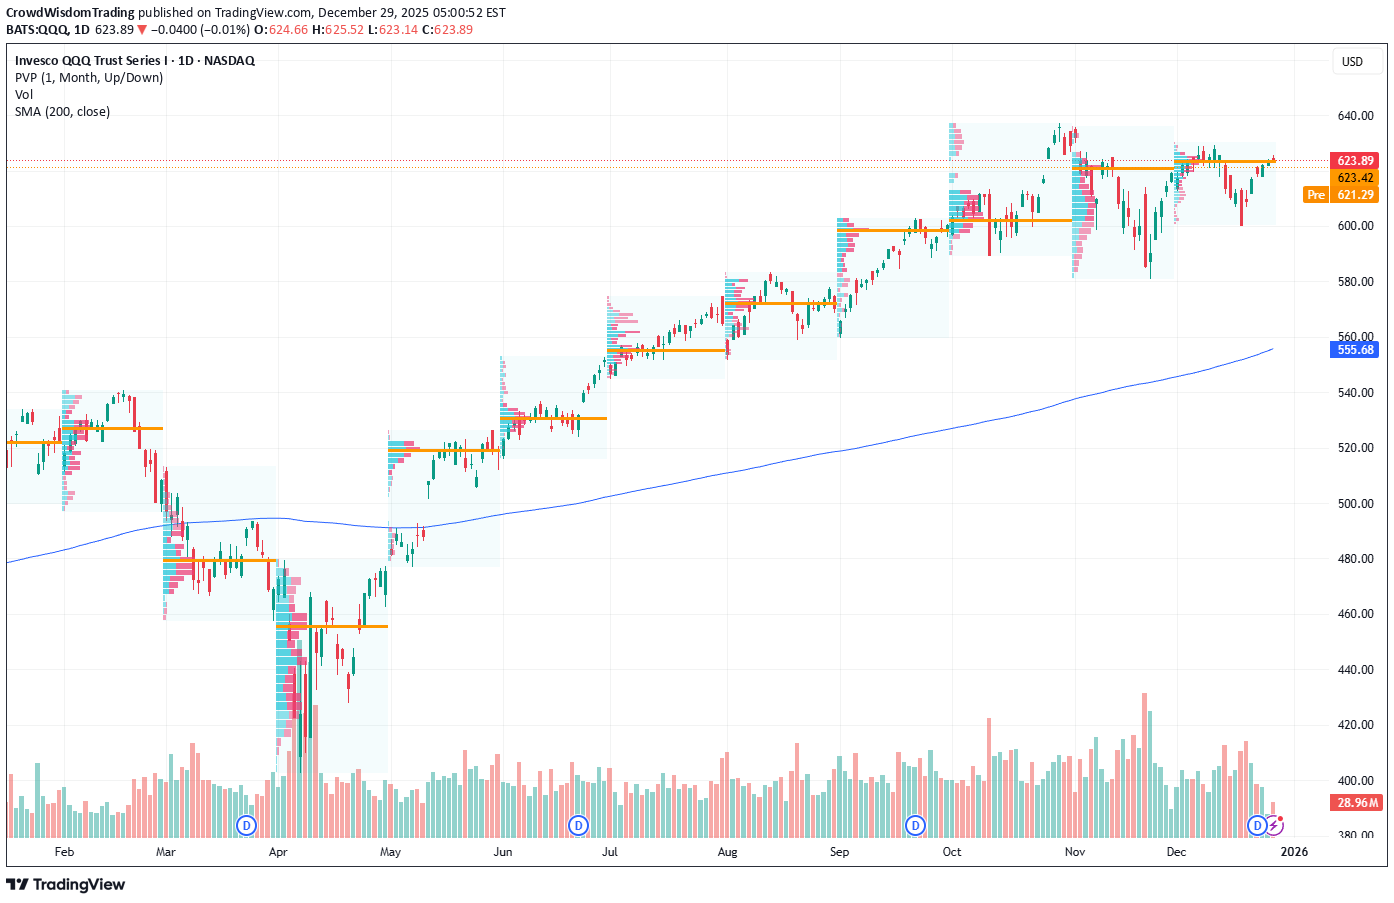
Current Price: $623.89 Direction: SHORT Confidence Level: 57% (Based on mixed but skewed downside trader commentary, repeated resistance mentions, and price stalling near key levels) Targets: - T1 = $617 - T2 = $603 Stop Levels: - S1 = $626 - S2 = $631 **Wisdom of Professional Traders:** This analysis synthesizes insights from hundreds of professional traders and market experts, combining what many are seeing on the charts right now. When I pull together the crowd wisdom, the dominant theme is clear: QQQ is bumping into resistance and multiple traders expect a short-term dip before any next leg higher. The collective read leans toward caution at current levels rather than chasing upside here. **Key Insights:** Here’s what’s driving this setup. Several traders repeatedly pointed out that QQQ is struggling around the $624 to $626 area. That zone came up again and again as a rejection level. Many traders described lower highs, wedge patterns, and head-and-shoulders type structures forming on shorter timeframes. When I see that many independent traders flag the same area, I take it seriously. What’s interesting is that while the broader market tone still looks constructive into year-end, traders are clearly separating timeframes. Short-term, they expect a pullback or dip. Medium-term, many still want to buy that dip. That distinction matters. For this week’s trade, the resistance is the story, not the longer-term trend. X sentiment adds to that cautious tone. While there is some optimism around rate-cut expectations, bearish tweets cluster tightly around the $613–$620 zone, with repeated warnings about a fast move lower if $613 gives way. That keeps downside risk very real over the next few sessions. **Recent Performance:** QQQ has climbed sharply since the April 2025 lows and recently pushed into the $620s, where momentum started to fade. Over the last several sessions, price has stalled just below prior highs instead of expanding higher. Volume has also thinned, which traders often associate with exhaustion moves rather than breakouts. You can see this hesitation clearly on the daily and intraday charts: price pokes higher but fails to hold above $625, then drifts back. That kind of action tends to favor short-term sellers. **Expert Analysis:** When I look at the combined trader commentary, a few levels stand out. Support around $620 and then $617 was mentioned across multiple reviews. Below that, many traders highlighted $603–$600 as a likely magnet if selling accelerates. On the upside, $626 and $631 repeatedly came up as levels where sellers would step back in. Several traders also noted relative weakness versus the S&P 500, with QQQ making lower highs while other indices hold up better. That relative underperformance often shows up before short-term pullbacks. **News Impact:** Macro headlines are a double-edged sword right now. Rate-cut optimism has helped keep a bid under tech, but upcoming CPI data is a clear volatility trigger. Traders are very aware that any inflation surprise could pressure yields and hit tech-heavy ETFs quickly. With that catalyst looming, many are reducing risk near resistance instead of adding exposure. **Trading Recommendation:** Here’s my take. With QQQ trading just under a well-defined resistance band and many traders calling for a dip first, I’m siding with a SHORT position for this week. I’m targeting a move toward $617 initially, with a stretch target near $603 if selling builds. I’d keep risk tight above $626, and I’d reassess the whole idea if price pushes and holds above $631. This is a tactical pullback trade, not a call on the longer-term trend.