
ClassicallegendFx
@t_ClassicallegendFx

What symbols does the trader recommend buying?
Purchase History
پیام های تریدر
Filter
ClassicallegendFx
بیت کوین (BTC/USDT) از کف حمایتی جهش کرد: آیا صعود به ۱۱۶ هزار قطعی است؟
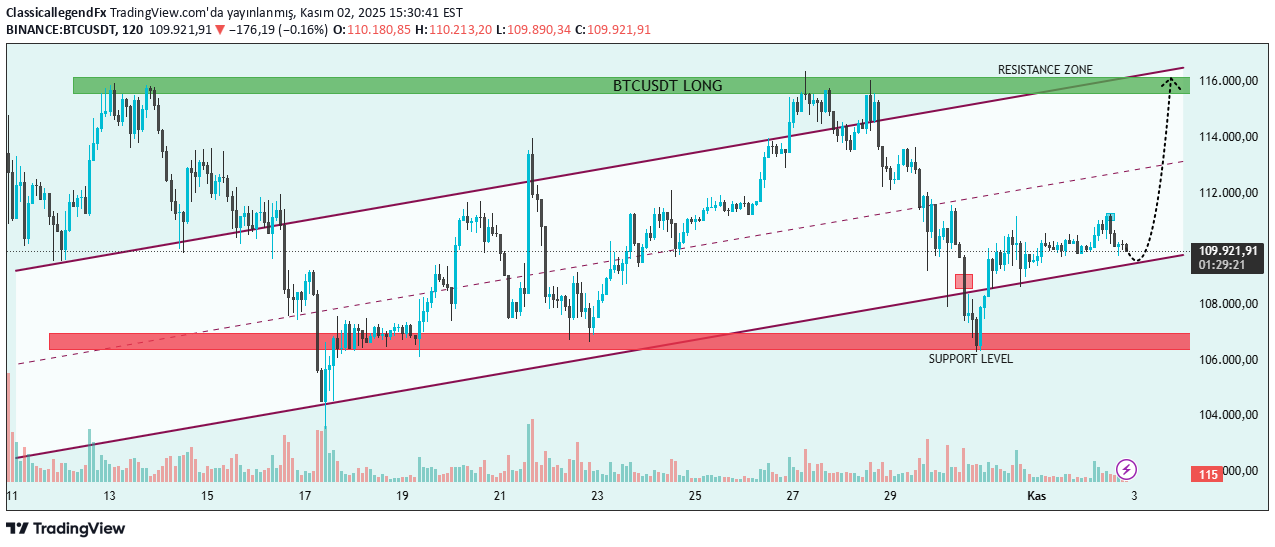
Genel Görünüm: BTC/USDT grafiğinde Bitcoin’in 106,000 civarındaki destek seviyesinden toparlanarak yükselen paralel kanal içinde hareketini sürdürdüğü görülüyor. Fiyat yapısı, alıcıların yeniden güç kazandığını gösteriyor. Önemli Seviyeler: Direnç Bölgesi: Yaklaşık 115,000–116,000 aralığı – bir sonraki güçlü kâr alma bölgesi. Destek Seviyesi: Yaklaşık 106,000–107,000 aralığı – geçmişte fiyat düşüşlerinin durduğu, güçlü alıcı ilgisi olan bölge. Kanal Desteği: Fiyat şu anda yükselen kanalın alt sınırını test ediyor ve buradan tepki alıyor. Teknik Görünüm: Kısa vadeli düşüş düzeltmesinin ardından, fiyat kanalın alt trend çizgisi üzerinden yukarı yönlü tepki vermiş durumda; bu da alış baskısının sürdüğünü gösteriyor. Grafikteki noktalı çizgi, fiyatın bu seviyeden toparlanarak üst direnç bölgesine (115,000–116,000) doğru yükselebileceğine işaret ediyor. Genel trend yapısı yükseliş yönünde, çünkü fiyat daha yüksek dipler oluşturarak kanal içinde ilerliyor. Fiyatın 112,000 seviyesinin üzerinde kalıcı bir kırılım yapması, yükseliş ivmesini hızlandırabilir. Ancak 106,000 seviyesinin altına bir kırılım, bu yükseliş senaryosunu geçersiz kılabilir ve yatay ya da düşüş yönlü harekete yol açabilir. Sonuç: Bitcoin (BTC/USDT) şu anda yükseliş yönlü bir toparlanma evresinde. Fiyat 106,000 destek seviyesi üzerinde ve yükselen kanal içinde kaldığı sürece, hedef 116,000 direnç bölgesi olmaya devam edecek.
ClassicallegendFx
بیت کوین در آستانه پرش بزرگ: سطح حمایت ۱۰۰,۰۰۰ دلار نجاتبخش شد!
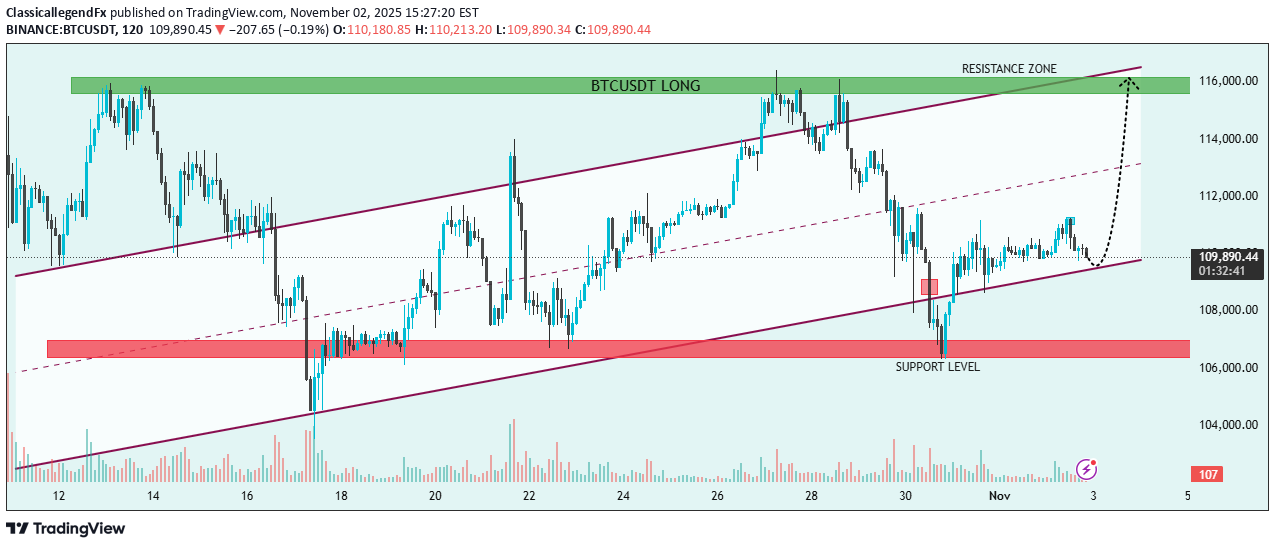
The BTC/USDT chart shows that Bitcoin has recently rebounded from the support level near 106,000, maintaining its movement within a rising parallel channel. The current price action suggests renewed bullish momentum. Key Levels: Resistance Zone: Around 115,000–116,000, acting as the next major profit target for buyers. Support Level: Around 106,000–107,000, where previous price drops have been absorbed by strong buying interest. Mid-Channel Support: The price is currently testing the lower boundary of the ascending channel, suggesting a possible continuation of the uptrend. Technical Outlook: After a short-term correction, the price has bounced back from the lower trendline, showing buying pressure around the channel’s support. The dotted bullish projection indicates a potential rally toward the upper resistance zone if the price holds above the lower boundary. The trend structure remains bullish, supported by higher lows and steady upward channel formation. A confirmed breakout above 112,000 could accelerate momentum toward 115,000–116,000. However, if Bitcoin breaks below 106,000, it may invalidate the bullish pattern and shift bias toward consolidation or further downside. Conclusion: Bitcoin (BTC/USDT) is currently in a bullish recovery phase. As long as the price stays above the support level (106,000) and within the ascending channel, the target remains the resistance zone near 116,000.
ClassicallegendFx
سقوط طلا ادامه دارد؟ تحلیل کامل XAU/USD و سطوح کلیدی حمایتی و مقاومتی
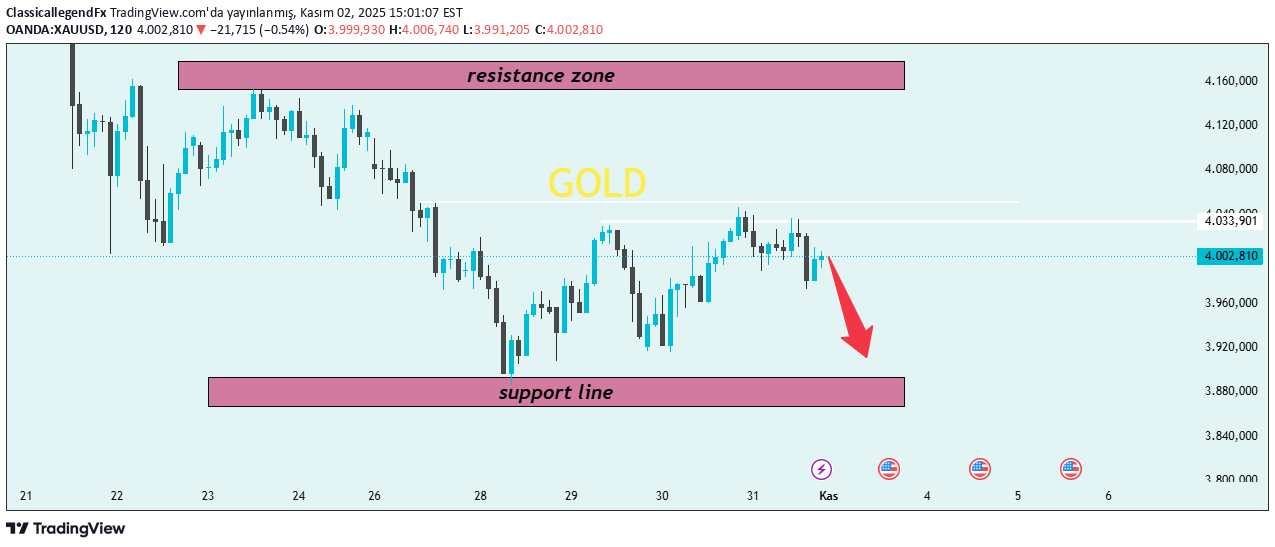
Genel Görünüm: Grafikte XAU/USD (Altın / ABD Doları), 4002.81 seviyelerinde işlem görüyor ve yakın zamanda direnç bölgesinden reddedilme göstermiş durumda. Önemli Seviyeler: Direnç Bölgesi: Yaklaşık 4060–4150 aralığı – fiyatın daha önce defalarca yükselişi durdurduğu alan. Destek Hattı: Yaklaşık 3880–3920 aralığı – geçmişte güçlü alıcıların devreye girdiği bölge. Teknik Görünüm: Fiyat, kısa vadeli minör direnç olan 4040–4050 seviyesini yeniden test ettikten sonra ayı yönlü mumlar oluşturarak düşüş sinyali vermiştir. Grafikteki kırmızı ok, fiyatın destek hattına doğru devam edebilecek bir düşüş hareketini işaret ediyor. Fiyat yapısı, düşük tepe – düşük dip formasyonu sergiliyor; bu da kısa vadede ayı trendinin devam ettiğini gösteriyor. Eğer fiyat 3900 seviyesinin altına kırarsa, düşüşler destek bölgesinin altına doğru derinleşebilir. Ancak 4050–4060 üzeri bir kırılım, bu düşüş senaryosunu geçersiz kılarak fiyatın yeniden 4150 civarına yönelmesine yol açabilir. Sonuç: Altın, şu anda satış baskısı altında ve 4050 seviyesi altında kaldığı sürece, 3900 destek bölgesine doğru geri çekilme olasılığı yüksek görünüyor.
ClassicallegendFx
طلا سقوط میکند؟ پیشبینی نگرانکننده برای جفت ارز XAU/USD پس از رد مقاومت کلیدی
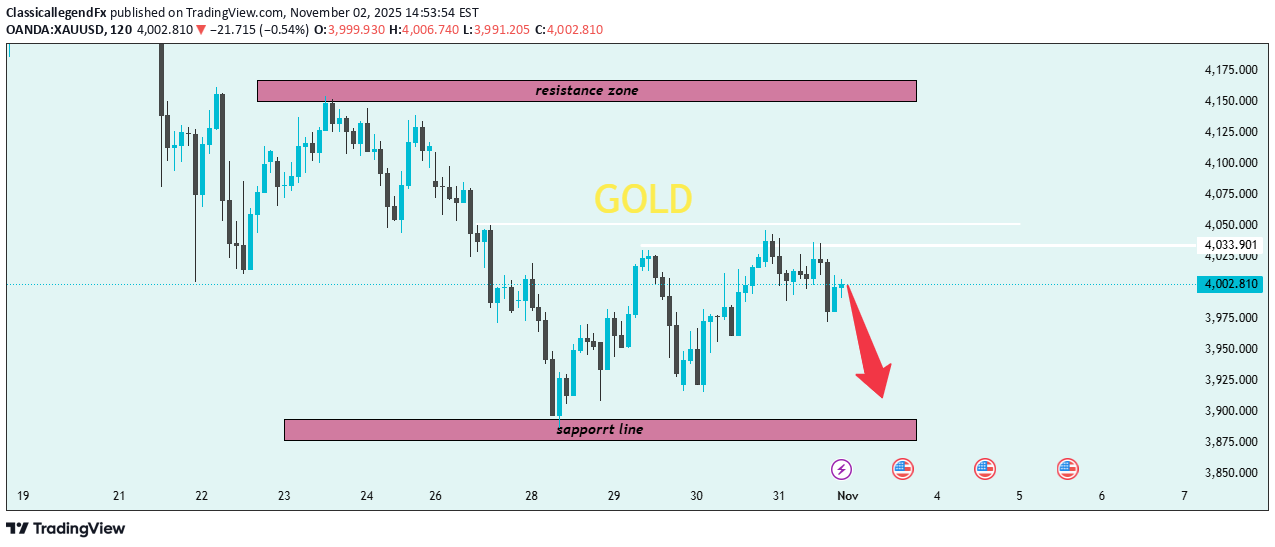
Chart Overview: The chart shows that XAU/USD (Gold vs US Dollar) is currently trading around 4002.81, following a rejection from a near-term resistance zone. Key Levels: Resistance Zone: Around 4060–4150, where previous price rallies have failed. Support Line: Around 3880–3920, acting as a strong demand area in prior sessions. Technical Outlook: The market recently retested the minor resistance (around 4040–4050) and formed bearish candles, indicating selling pressure. The downward red arrow highlights potential continuation toward the support zone. The overall structure forms a lower high and lower low pattern, confirming a short-term bearish trend. If price breaks below 3900, it may open the door for deeper downside movement. Conversely, a break above 4050–4060 could invalidate this bearish scenario and suggest a potential retest of the upper resistance zone near 4150. Conclusion: Gold is showing bearish momentum, and unless price breaks above 4050, sellers may continue driving price down toward the 3900 support area.
ClassicallegendFx
تحلیل تکنیکال تسلا (TSLA): شکست قاطعانه قیمت و اهداف صعودی جدید!
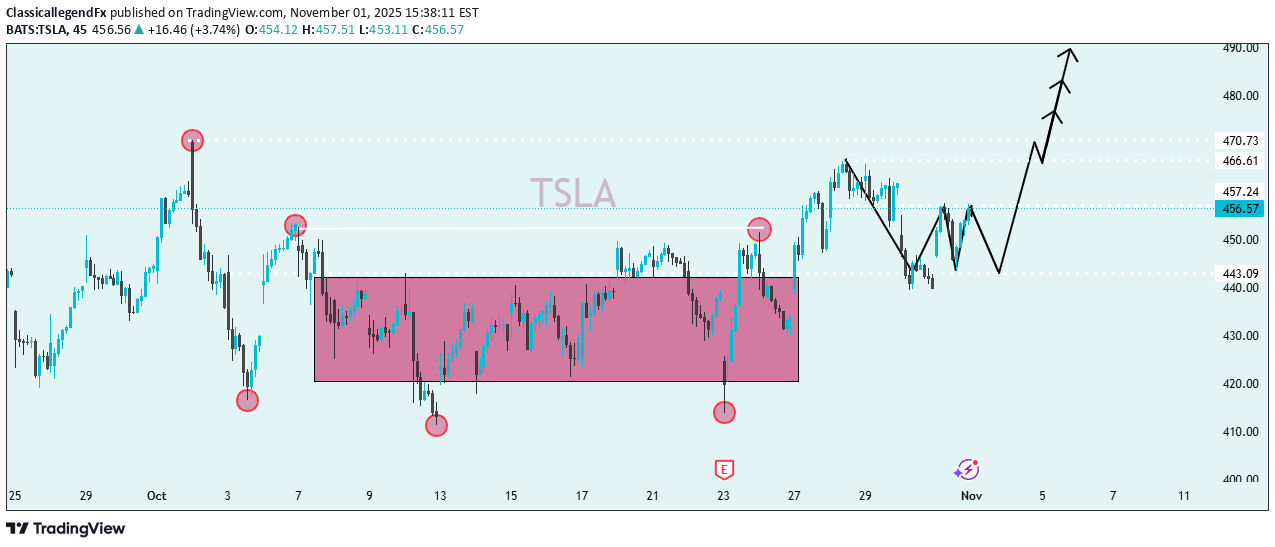
1. Chart Overview Ticker: TSLA (Tesla) Timeframe: Short-term (likely 1-hour or 4-hour chart) Current Price: Around $456.57 Date: November 1, 2025 (as shown on the chart) --- 🧩 2. Key Technical Structures 🔸 Range (Consolidation Zone) The pink shaded box marks a sideways consolidation/range between roughly $430 and $450. Price moved horizontally within this box for several sessions, indicating indecision or accumulation. 🔸 Breakout Price has broken above the upper boundary of this range near $450, signaling a bullish breakout. The breakout confirms that buyers gained control after a period of consolidation. 🔸 Support and Resistance Levels Support: ~$443.09 — previous lower boundary of the range. Resistance Levels: $457.24 (current level, acting as pivot) $466.61 (next resistance) $470.73 (major target level) --- 📈 3. Pattern Recognition The marked highs and lows (red circles) suggest a double bottom formation inside the range, which is a bullish reversal pattern. The projection (black arrow) shows a retracement (minor dip) before a strong upward continuation toward $470+. This path suggests a bullish wave structure (Elliott Wave–style impulse count or continuation move). --- ⚙️ 4. Technical Outlook 🔹 Bullish Scenario If price holds above $450, TSLA is expected to move higher toward $466 → $471 → $480+. The pattern implies momentum continuation after consolidation. 🔹 Bearish Risk A drop below $443 would invalidate the bullish scenario and could lead back into the previous range (~$430). --- 📊 5. Summary AspectObservation TrendTransitioning from range to bullish PatternRange breakout + potential bullish continuation Key Support$443 Immediate Resistance$457 Targets$466, $471, $480 BiasBullish (as long as $443 holds) --- ✅ Conclusion: This chart suggests that TSLA has broken out of a consolidation phase and is now poised for a bullish continuation. Traders may look for buying opportunities above $450 with potential upside targets near $470–$480, while maintaining caution if price falls back below $443.
ClassicallegendFx
سولانا (SOL) در آستانه انفجار؟ حمایت قوی و مسیر صعودی تا ۲۰۵ دلار!
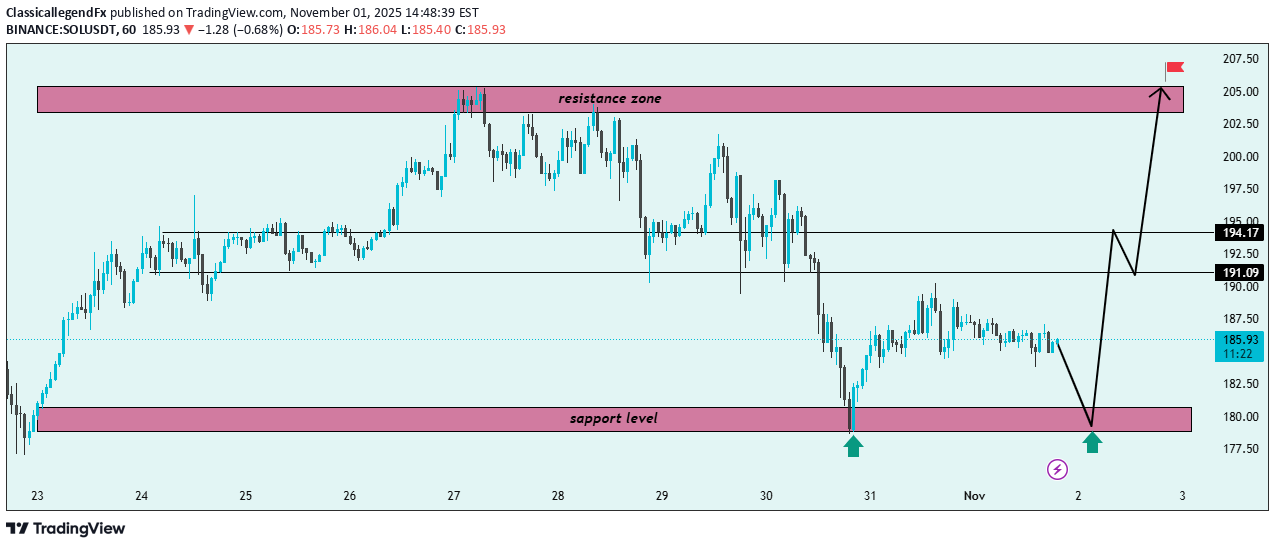
1. Market Structure Overview The chart shows Solana (SOL/USDT) trading within a well-defined range between a support level (~$179–$182) and a resistance zone (~$203–$207). The price has recently tested the support zone multiple times (marked by green arrows), confirming its strength as a key demand area. 2. Key Technical Levels Support Level: $179–$182 → Major demand zone where price has bounced twice. Resistance Zone: $203–$207 → Supply area where previous rallies have reversed. Mid-level Zones: $191.09: Intermediate resistance (potential short-term reaction point). $194.17: Secondary resistance before the upper target zone. 3. Price Action Insight Price is currently consolidating around $185, showing indecision after a prior drop. The black projection arrows suggest a potential liquidity sweep of the support zone before a bullish reversal. Expected structure: A final dip toward $180 to retest support. A bullish reaction leading to a higher low formation. A break above $191–$194, confirming bullish continuation. A final push toward the resistance zone ($205) — the main target. 4. Trade Bias Bias: Bullish from support Confirmation Needed: Strong bullish candle or breakout from $191 resistance. Invalidation: Daily close below $178 support. 5. Target Projection Primary Target: $194 Final Target: $205 (resistance zone / flagged target) Summary: SOL/USDT is showing a potential bullish reversal setup from the $180 support zone. If price confirms strength with a bounce and breaks above $191–$194, the next rally could target the $205 resistance zone. A breakdown below $178 would invalidate the bullish scenario.
ClassicallegendFx
تحلیل تکنیکال XRP: سقوط قریبالوقوع با الگوی سقف دوتایی (Eve) و هدف جدید ۲.۳۵!
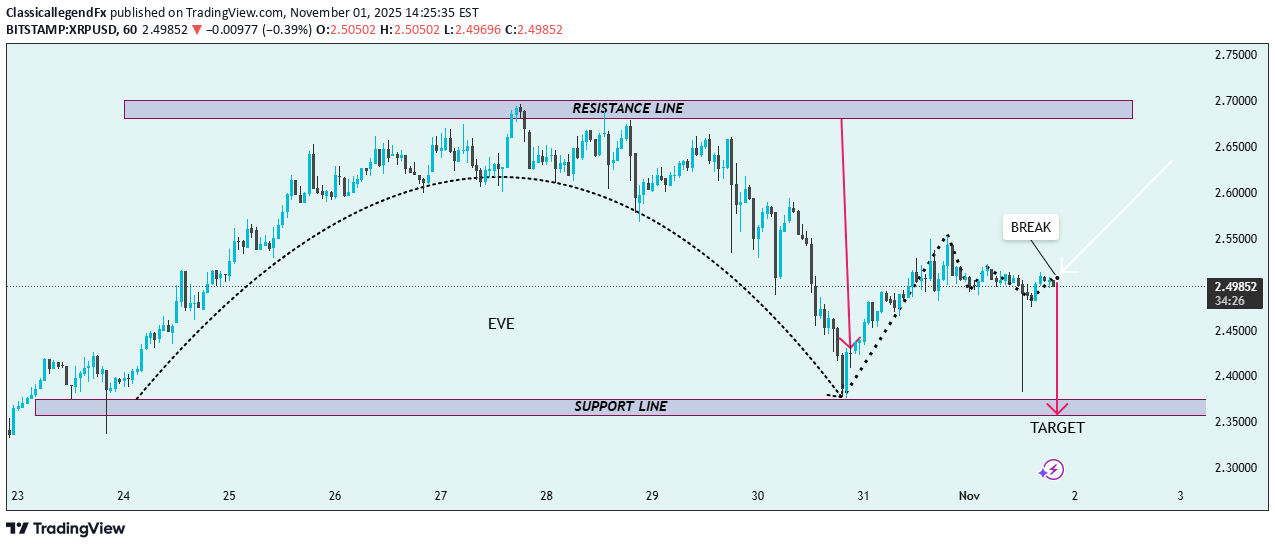
1. Pattern Overview The chart illustrates an Eve (Double Top) formation — a bearish reversal pattern signaling potential downward movement. The structure forms between the resistance line (~2.70) and the support line (~2.35). 2. Key Technical Zones Resistance Line (2.70 Zone): Price tested this level twice, forming the two peaks (the "Eve" tops), confirming strong selling pressure. Support Line (2.35 Zone): This acts as the neckline of the double-top pattern — a key level for bearish confirmation. 3. Price Behavior After the second peak, price declined sharply, completing the rounded top pattern shown by the dotted black curve. The break label marks the neckline break attempt, confirming potential bearish continuation. The target area (highlighted at the support zone) represents the expected measured move, derived from the height between resistance and neckline. 4. Projection Scenario 1 (Bearish Continuation): A confirmed break below 2.48 → 2.45 region would likely push price down to the 2.35 target zone, completing the pattern. Scenario 2 (Invalidation): If XRP reclaims above 2.55–2.60, it could indicate a failed breakdown and short-term bullish rebound. 5. Market Sentiment Current Bias: Bearish (following structure break) Next Support Target: 2.35 Invalidation Level: Close above 2.60 Summary: XRP/USD is forming a clear Double Top (Eve) pattern below 2.70 resistance. A breakdown below 2.48 would confirm the bearish continuation toward the 2.35 target zone. Traders should monitor for confirmation candles before entry.
ClassicallegendFx
تحلیل تکنیکال اتریوم (ETH): آیا روند نزولی شکسته شد؟ نقشه راه صعودی تا ۴۲۰۰ دلار
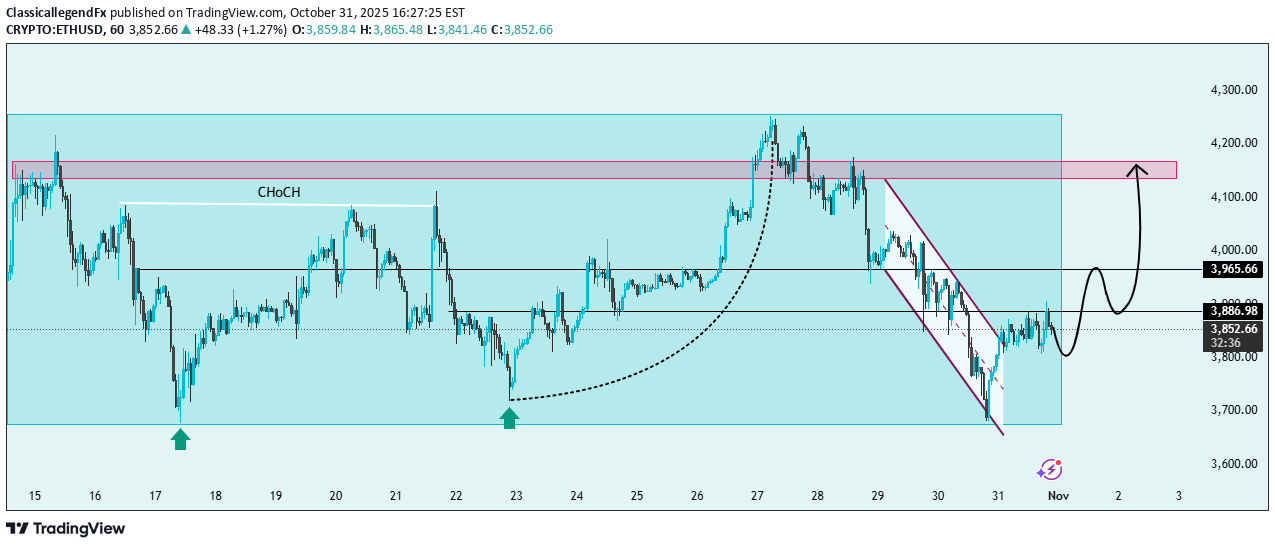
🔹 Chart Overview: The chart illustrates a clear market structure shift (CHoCH) followed by a descending channel breakout, signaling a potential bullish reversal. Price action has respected the major support zone around $3,700–$3,750 and is now showing signs of recovery. 💹 Key Levels: Support Zone: $3,700 – $3,750 🛡️ Immediate Resistance: $3,965 ⚔️ Major Resistance Zone: $4,150 – $4,200 🧱 📈 Bullish Scenario (Main Bias): ETH has broken out from the falling wedge pattern, a classic bullish reversal signal ✅. If price sustains above $3,880–$3,900, we may see continuation toward the $3,965 short-term resistance and potentially a rally toward the $4,200 zone 🎯. Confirmation Signs: Retest of breakout trendline holds support 🟢 Higher highs and higher lows begin forming 🔄 ⚠️ Bearish Scenario (Alternative View): If ETH fails to hold above $3,850, it may retest the $3,700 base again for liquidity before attempting a stronger rebound 📉. 🎯 Trading Outlook: Bias: Bullish (reversal in progress) Entry Zone: $3,850 – $3,880 (on confirmation) Targets: TP1: $3,965 TP2: $4,150 – $4,200 Invalidation: Break below $3,700 ❌ 📌 Conclusion: ETH/USD is showing a bullish recovery setup after breaking its descending channel. Maintaining support above $3,850 could fuel a move toward $4,200, completing a clean market structure reversal 🌕💪
ClassicallegendFx
تحلیل بیت کوین (BTC/USDT): سطوح حیاتی حمایت و مقاومت؛ آیا صعود به ۱۱۶,۰۰۰ ممکن است؟
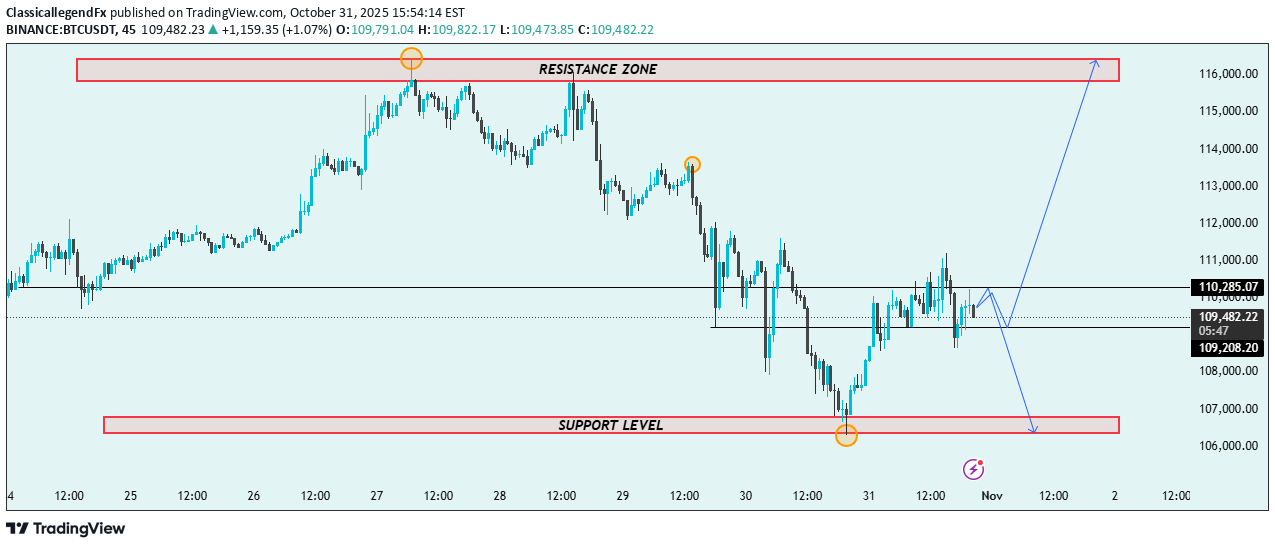
🔹 Chart Overview: The chart highlights two critical price zones: Resistance Zone: Around 115,500 – 116,000 🧱 Support Level: Around 106,000 – 107,000 🛡️ Currently, price action hovers near 110,000, showing mixed signals within this mid-range structure. 📈 Bullish Scenario (Blue Arrow Up): If BTC holds above 109,000 support and breaks 111,000 resistance, we could see a strong upward push toward the 115,000–116,000 zone 🎯. This move would confirm a bullish reversal from the recent low. Key confirmation: Break & retest above 111,000 ✅ Momentum continuation with volume 🔥 📉 Bearish Scenario (Blue Arrow Down): However, if BTC fails to sustain above 109,000–110,000, a rejection could lead to another drop toward 107,000 support ⚠️. This would maintain the range-bound structure between these two zones. Key warning signs: Lower highs near 111,000 ❌ Breakdown below 108,500 → strong bearish signal 🐻 🎯 Trading Summary: Resistance Zone: 115,000 – 116,000 💥 Support Zone: 106,000 – 107,000 🧱 Current Bias: Neutral-to-bullish (watch for breakout confirmation) Next Targets: Upside ➡️ 115,000+ Downside ➡️ 107,000 📌 Conclusion: BTC/USDT is consolidating between strong support and resistance. A breakout above 111,000 could trigger a bullish wave 🌊, while failure may result in a retest of 107,000 support 📉.
ClassicallegendFx
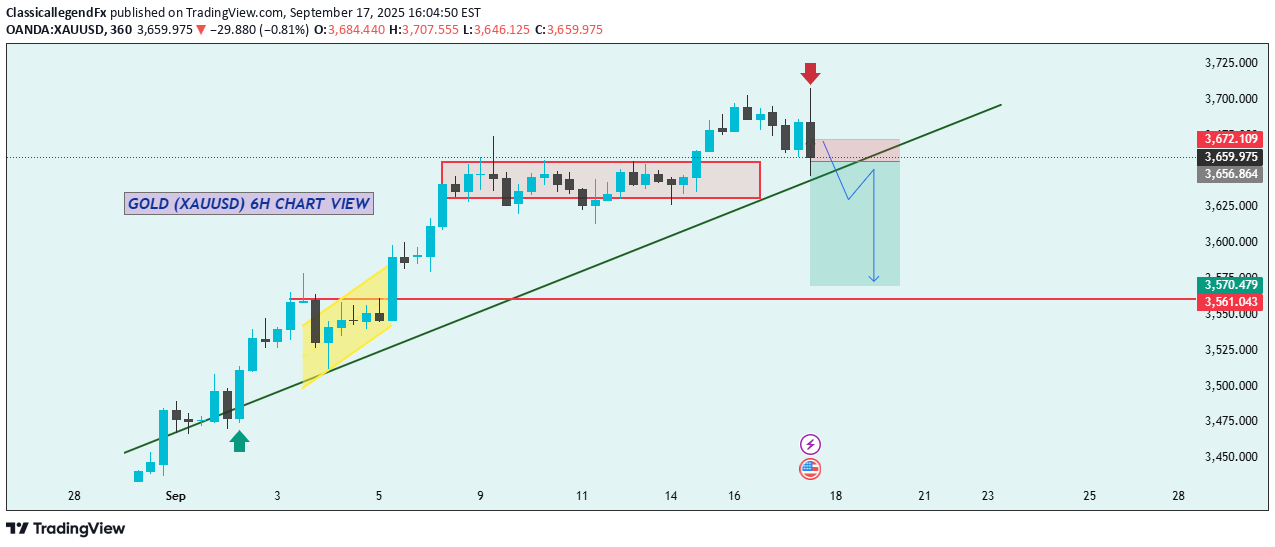
📊✨ GOLD (XAUUSD) 6H CHART ANALYSIS ✨📊 🔎 Trend Overview The chart shows that Gold (XAUUSD) has been in a strong uptrend since early September, supported by an ascending trendline ✅. After a breakout from consolidation zones 📦 (highlighted in red boxes), the price moved higher, forming new short-term highs. 📈 Current Market Behavior Price recently touched resistance near 3,725 (red arrow ⬇️) and started showing signs of weakness. A bearish rejection formed near the trendline, signaling possible downward momentum ⚠️. The price is now hovering just below the 3,672 level, with a potential breakdown forming. 📉 Bearish Scenario If the price closes below the ascending trendline 📉, we may see a drop toward the 3,570 – 3,561 support zone (red line). The projected target zone is highlighted with the blue arrow ⬇️, showing a potential correction area. 🛡️ Key Levels to Watch Resistance: 3,672 – 3,725 🔺 Immediate Support: 3,656 ⚖️ Major Support: 3,570 – 3,561 🟢 📌 Conclusion Gold is currently at a decision point. Breaking below the trendline may trigger a deeper correction 📉, while holding above could keep the bullish trend intact 🚀.
Disclaimer
Any content and materials included in Sahmeto's website and official communication channels are a compilation of personal opinions and analyses and are not binding. They do not constitute any recommendation for buying, selling, entering or exiting the stock market and cryptocurrency market. Also, all news and analyses included in the website and channels are merely republished information from official and unofficial domestic and foreign sources, and it is obvious that users of the said content are responsible for following up and ensuring the authenticity and accuracy of the materials. Therefore, while disclaiming responsibility, it is declared that the responsibility for any decision-making, action, and potential profit and loss in the capital market and cryptocurrency market lies with the trader.