Technical analysis by ClassicallegendFx about Symbol TSLAX: Buy recommendation (11/1/2025)

ClassicallegendFx
تحلیل تکنیکال تسلا (TSLA): شکست قاطعانه قیمت و اهداف صعودی جدید!
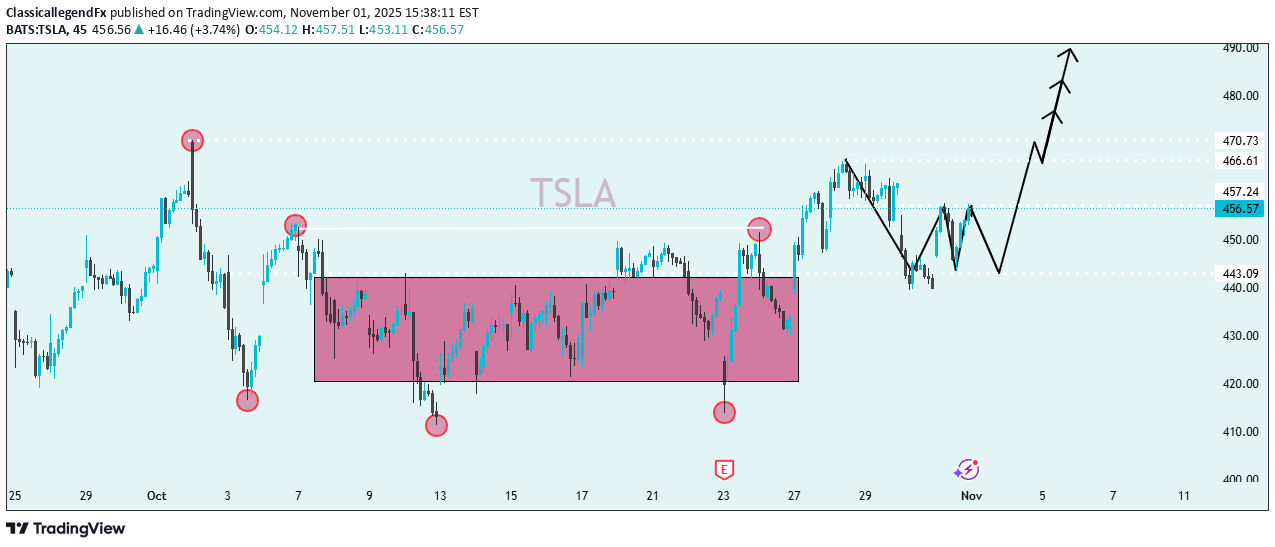
1. Chart Overview Ticker: TSLA (Tesla) Timeframe: Short-term (likely 1-hour or 4-hour chart) Current Price: Around $456.57 Date: November 1, 2025 (as shown on the chart) --- 🧩 2. Key Technical Structures 🔸 Range (Consolidation Zone) The pink shaded box marks a sideways consolidation/range between roughly $430 and $450. Price moved horizontally within this box for several sessions, indicating indecision or accumulation. 🔸 Breakout Price has broken above the upper boundary of this range near $450, signaling a bullish breakout. The breakout confirms that buyers gained control after a period of consolidation. 🔸 Support and Resistance Levels Support: ~$443.09 — previous lower boundary of the range. Resistance Levels: $457.24 (current level, acting as pivot) $466.61 (next resistance) $470.73 (major target level) --- 📈 3. Pattern Recognition The marked highs and lows (red circles) suggest a double bottom formation inside the range, which is a bullish reversal pattern. The projection (black arrow) shows a retracement (minor dip) before a strong upward continuation toward $470+. This path suggests a bullish wave structure (Elliott Wave–style impulse count or continuation move). --- ⚙️ 4. Technical Outlook 🔹 Bullish Scenario If price holds above $450, TSLA is expected to move higher toward $466 → $471 → $480+. The pattern implies momentum continuation after consolidation. 🔹 Bearish Risk A drop below $443 would invalidate the bullish scenario and could lead back into the previous range (~$430). --- 📊 5. Summary AspectObservation TrendTransitioning from range to bullish PatternRange breakout + potential bullish continuation Key Support$443 Immediate Resistance$457 Targets$466, $471, $480 BiasBullish (as long as $443 holds) --- ✅ Conclusion: This chart suggests that TSLA has broken out of a consolidation phase and is now poised for a bullish continuation. Traders may look for buying opportunities above $450 with potential upside targets near $470–$480, while maintaining caution if price falls back below $443.