Technical analysis by ClassicallegendFx about Symbol XRP: Sell recommendation (11/1/2025)

ClassicallegendFx
تحلیل تکنیکال XRP: سقوط قریبالوقوع با الگوی سقف دوتایی (Eve) و هدف جدید ۲.۳۵!
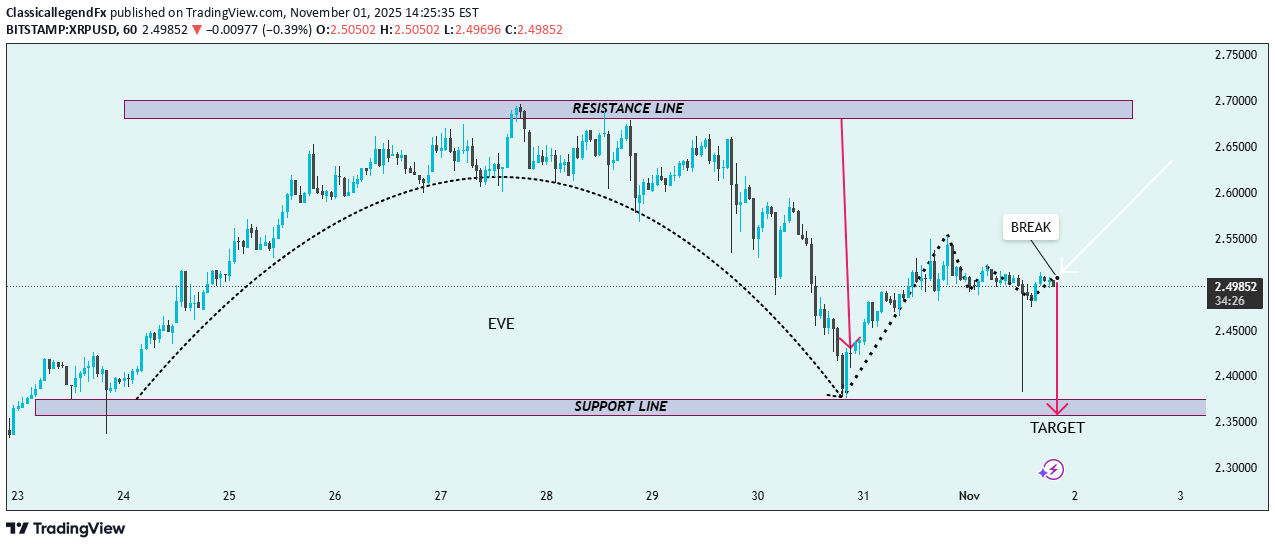
1. Pattern Overview The chart illustrates an Eve (Double Top) formation — a bearish reversal pattern signaling potential downward movement. The structure forms between the resistance line (~2.70) and the support line (~2.35). 2. Key Technical Zones Resistance Line (2.70 Zone): Price tested this level twice, forming the two peaks (the "Eve" tops), confirming strong selling pressure. Support Line (2.35 Zone): This acts as the neckline of the double-top pattern — a key level for bearish confirmation. 3. Price Behavior After the second peak, price declined sharply, completing the rounded top pattern shown by the dotted black curve. The break label marks the neckline break attempt, confirming potential bearish continuation. The target area (highlighted at the support zone) represents the expected measured move, derived from the height between resistance and neckline. 4. Projection Scenario 1 (Bearish Continuation): A confirmed break below 2.48 → 2.45 region would likely push price down to the 2.35 target zone, completing the pattern. Scenario 2 (Invalidation): If XRP reclaims above 2.55–2.60, it could indicate a failed breakdown and short-term bullish rebound. 5. Market Sentiment Current Bias: Bearish (following structure break) Next Support Target: 2.35 Invalidation Level: Close above 2.60 Summary: XRP/USD is forming a clear Double Top (Eve) pattern below 2.70 resistance. A breakdown below 2.48 would confirm the bearish continuation toward the 2.35 target zone. Traders should monitor for confirmation candles before entry.