Technical analysis by ClassicallegendFx about Symbol ETH: Buy recommendation (10/31/2025)

ClassicallegendFx
تحلیل تکنیکال اتریوم (ETH): آیا روند نزولی شکسته شد؟ نقشه راه صعودی تا ۴۲۰۰ دلار
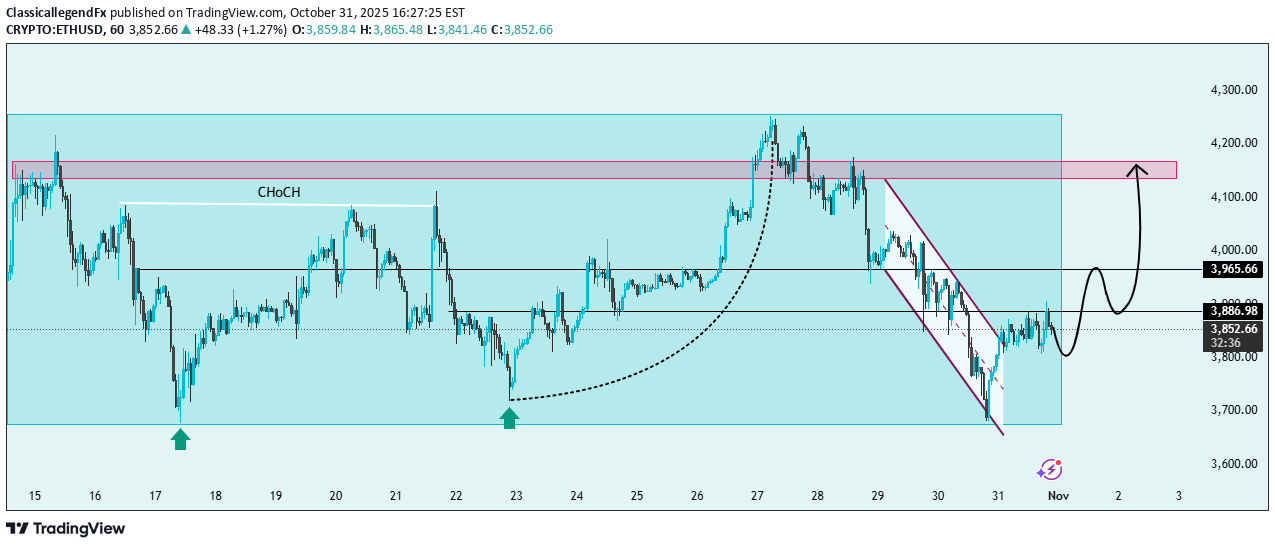
🔹 Chart Overview: The chart illustrates a clear market structure shift (CHoCH) followed by a descending channel breakout, signaling a potential bullish reversal. Price action has respected the major support zone around $3,700–$3,750 and is now showing signs of recovery. 💹 Key Levels: Support Zone: $3,700 – $3,750 🛡️ Immediate Resistance: $3,965 ⚔️ Major Resistance Zone: $4,150 – $4,200 🧱 📈 Bullish Scenario (Main Bias): ETH has broken out from the falling wedge pattern, a classic bullish reversal signal ✅. If price sustains above $3,880–$3,900, we may see continuation toward the $3,965 short-term resistance and potentially a rally toward the $4,200 zone 🎯. Confirmation Signs: Retest of breakout trendline holds support 🟢 Higher highs and higher lows begin forming 🔄 ⚠️ Bearish Scenario (Alternative View): If ETH fails to hold above $3,850, it may retest the $3,700 base again for liquidity before attempting a stronger rebound 📉. 🎯 Trading Outlook: Bias: Bullish (reversal in progress) Entry Zone: $3,850 – $3,880 (on confirmation) Targets: TP1: $3,965 TP2: $4,150 – $4,200 Invalidation: Break below $3,700 ❌ 📌 Conclusion: ETH/USD is showing a bullish recovery setup after breaking its descending channel. Maintaining support above $3,850 could fuel a move toward $4,200, completing a clean market structure reversal 🌕💪