
WIF
dogwifhat
| تریدر | نوع سیگنال | حد سود/ضرر | زمان انتشار | مشاهده پیام |
|---|---|---|---|---|
 CryptoWithJamesRank: 31413 | خرید | حد سود: تعیین نشده حد ضرر: تعیین نشده | 12/3/2025 | |
 minno91Rank: 31136 | خرید | حد سود: تعیین نشده حد ضرر: تعیین نشده | 12/3/2025 |
Price Chart of dogwifhat
سود 3 Months :
خلاصه سیگنالهای dogwifhat
سیگنالهای dogwifhat
Filter
Sort messages by
Trader Type
Time Frame

WIFUSDT: Bearish Continuation — Key Support Under Threat
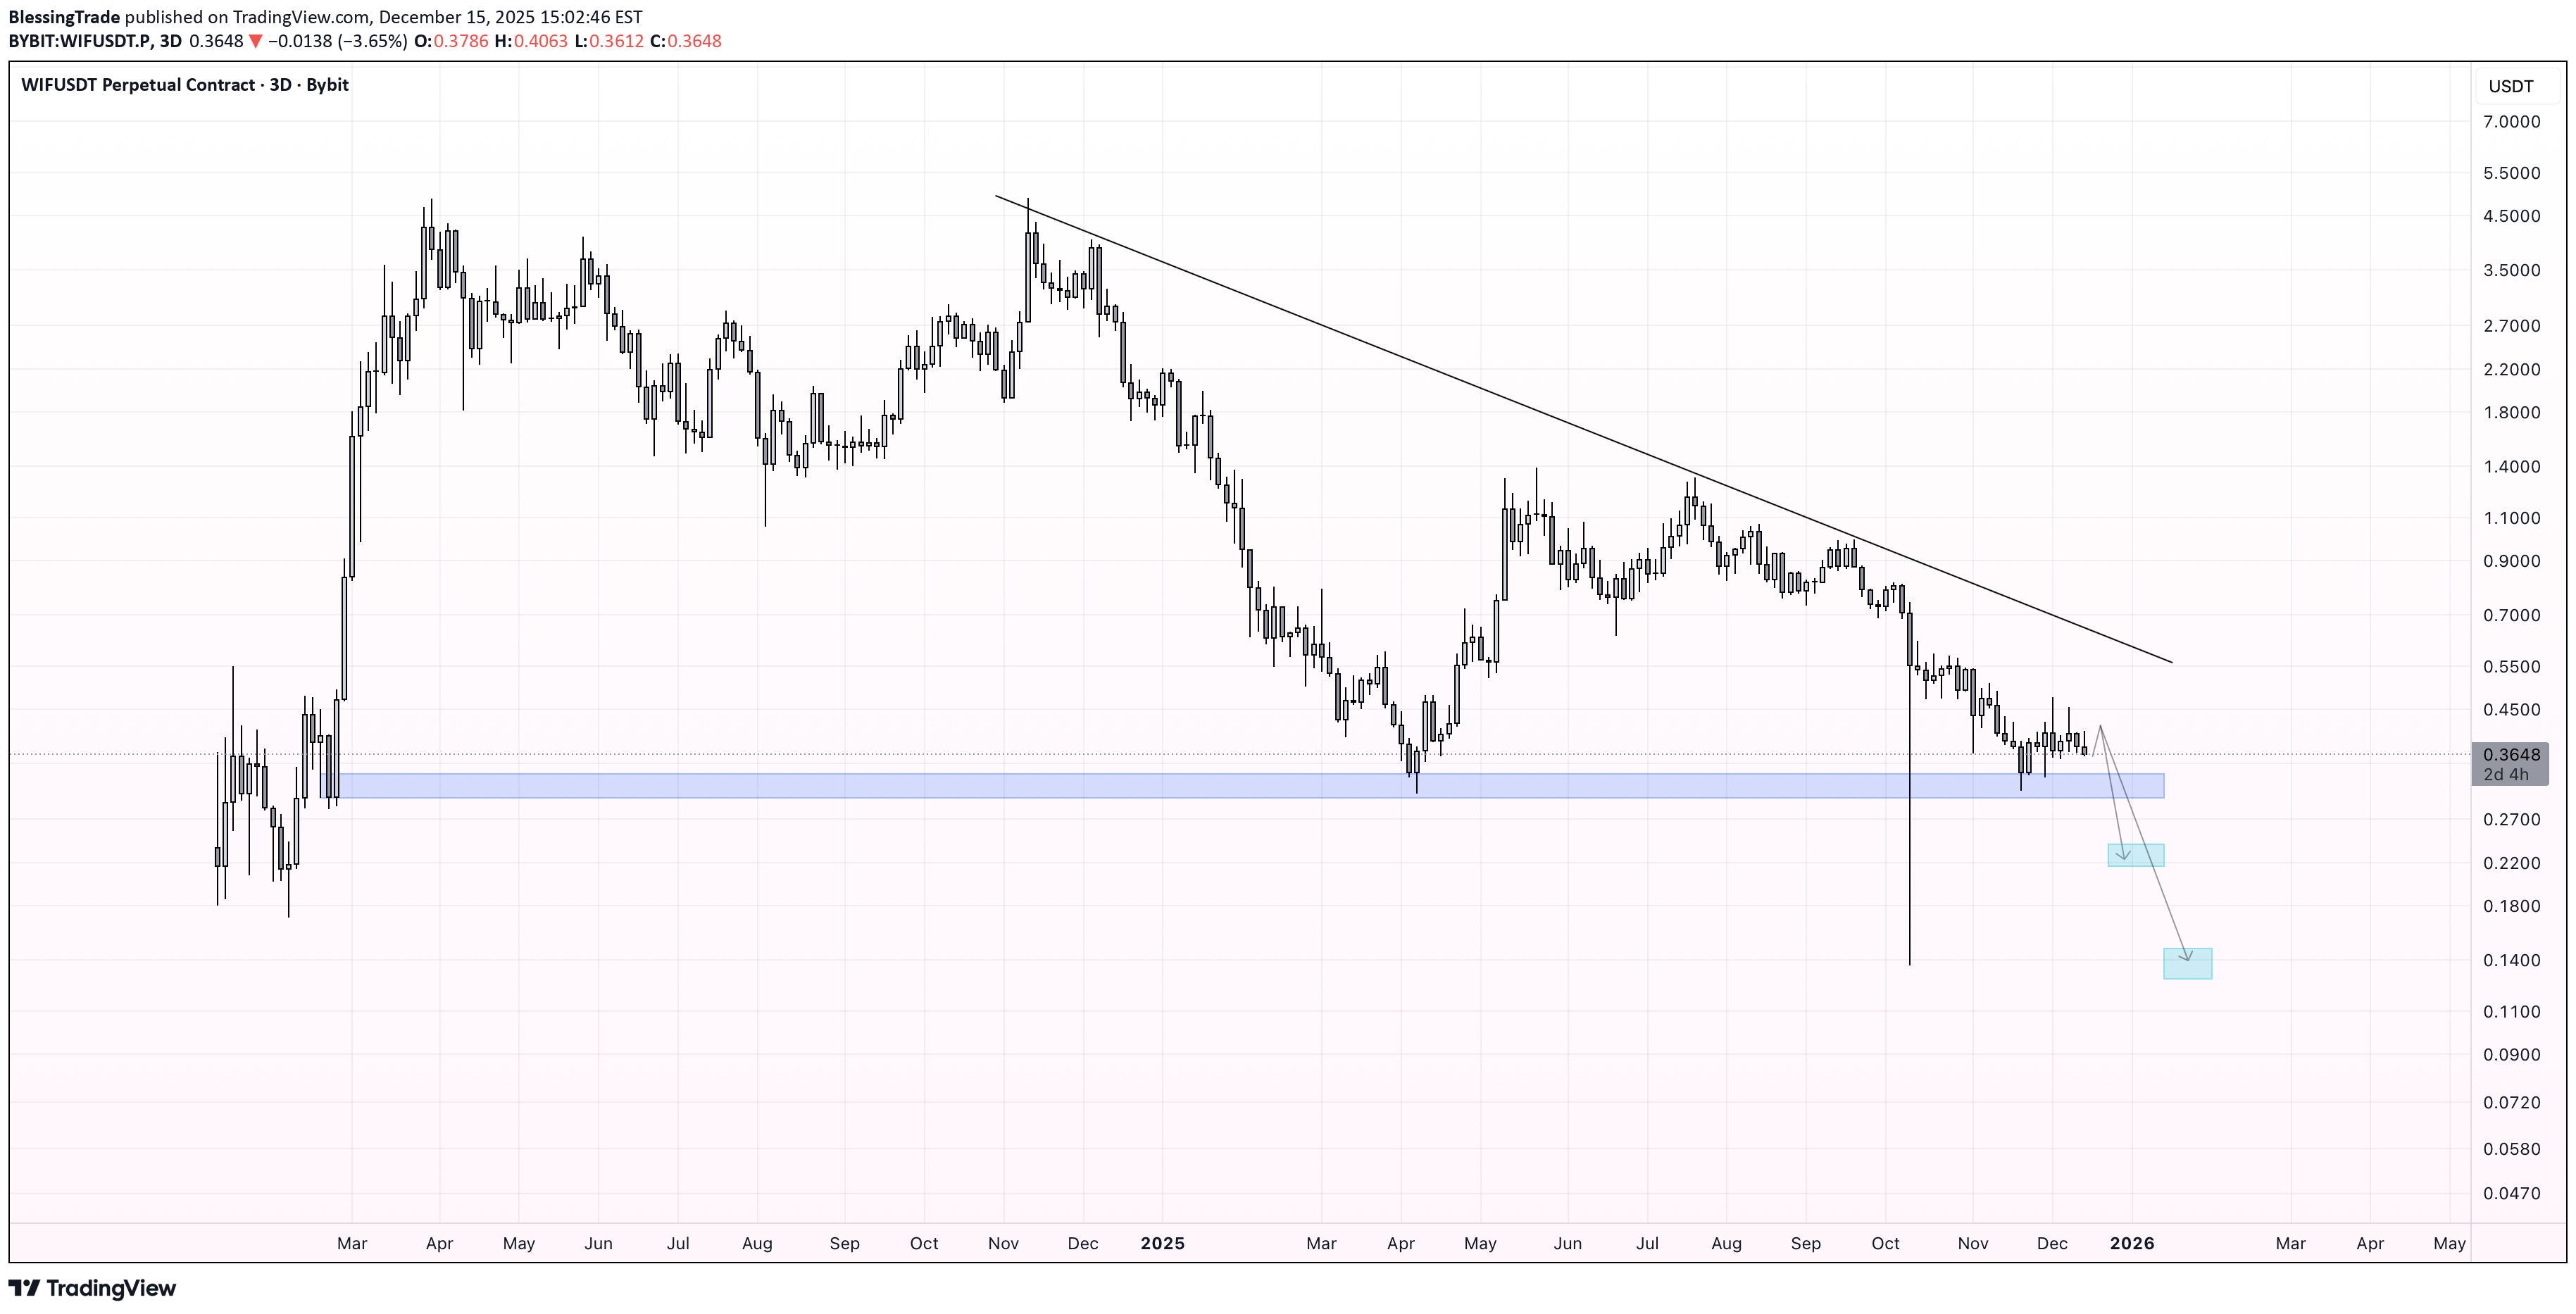
Price continues to move within a clear descending structure , respecting the long-term downtrend trendline . The marked blue zone represents a strong historical support, which has been holding price above a major downside area — essentially the last barrier before a deeper sell-off. At the moment, this support is being tested again , and momentum remains bearish. A clean breakdown below this level would likely open the door for a strong continuation to the downside. Bearish scenario: Confirmed support break → acceleration lower First target: 0.25 USD Second target: 0.15 USD If panic or high sell pressure enters the market, even lower levels are possible As long as price stays below the descending trendline, the bias remains bearish . The blue zone is the key level to watch — once it fails, the market may enter a “free fall” phase.beaarrr run!!!
تحلیل تکنیکال WIF: منتظر شکست کانال نزولی یا سقوط بیشتر؟
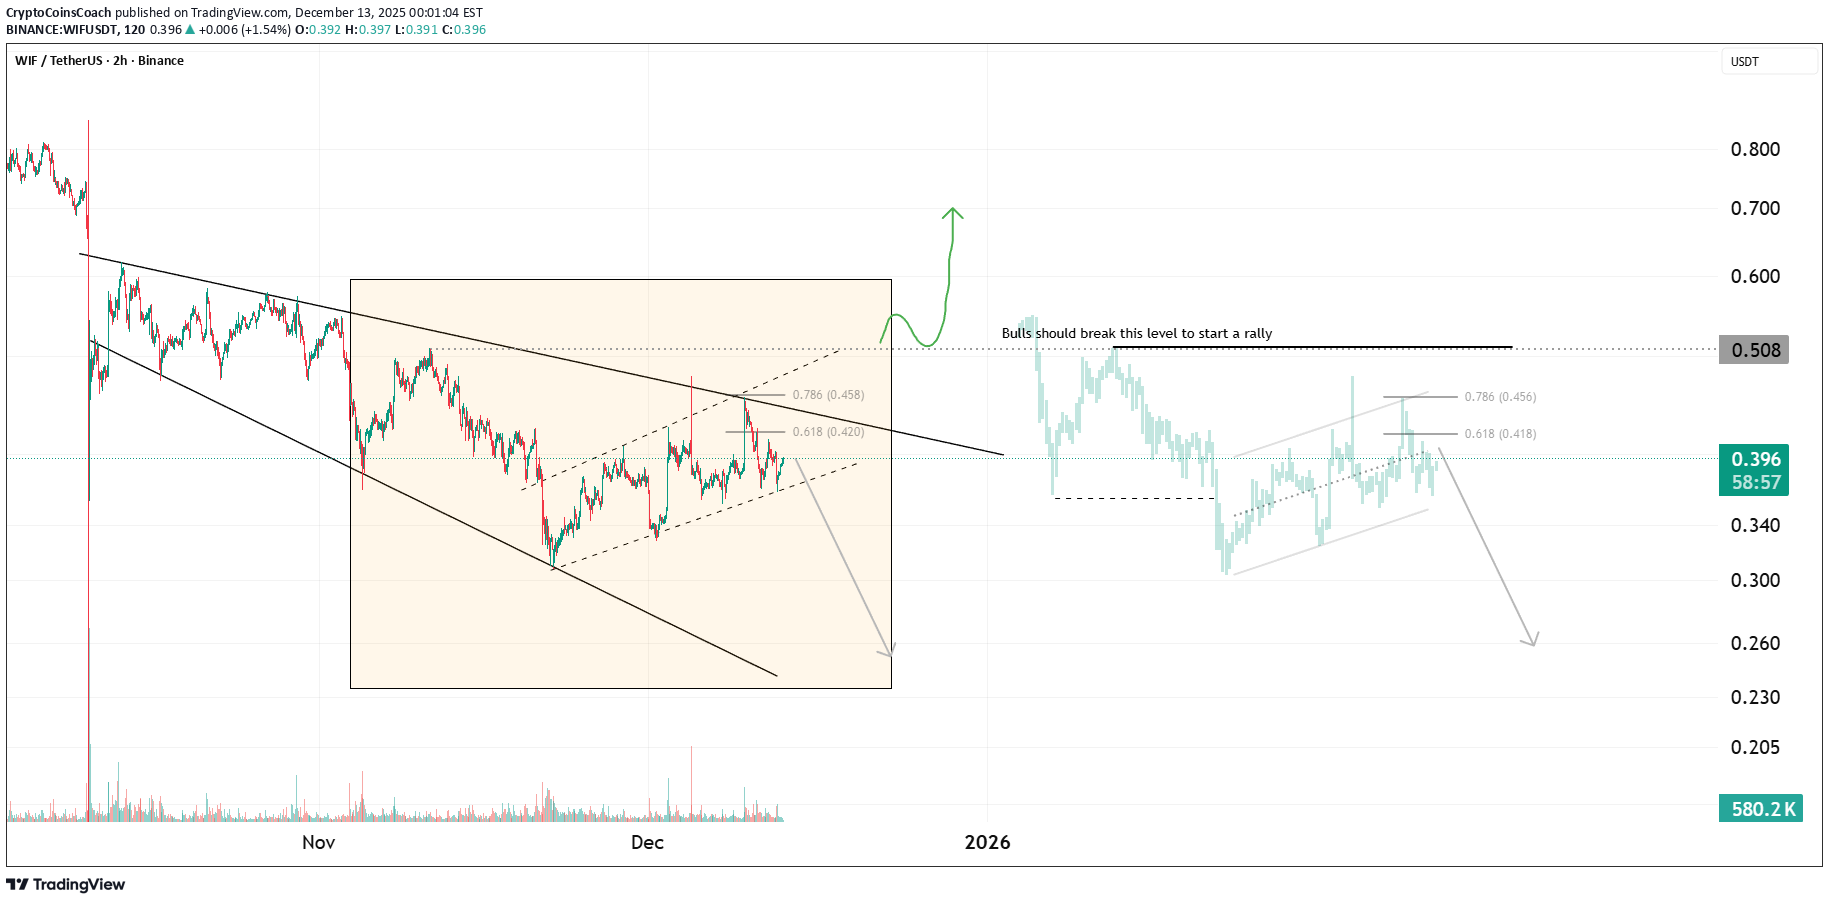
Market Structure Overview WIF is currently trading inside a well defined descending channel , where price has been respecting both the upper resistance and the lower support with clean reactions. The recent move shows price stabilizing near the lower half of the channel, suggesting selling pressure is slowing down. Key Price Behavior Price is reacting around a strong horizontal demand area that has previously acted as a base. This zone is also aligned with Fibonacci retracement support, which increases the importance of this level. Buyers are stepping in, but confirmation is still needed. What to Watch Next If price manages to reclaim and hold above the channel midline and breaks the descending trendline, momentum can shift toward a recovery phase. That would open the path for a move toward the upper resistance zone of the channel. If price fails to hold this support area, a deeper pullback toward the lower channel boundary remains possible before any meaningful reversal. Bias & Invalidation The outlook remains cautiously bullish as long as price holds above the current demand zone. A clean breakdown and acceptance below this area would invalidate the bullish scenario and favor continuation to the downside. Patience is key here. Let the market confirm direction before committing.

Cryptojobs
WIF - BULLISH OUTLOOK
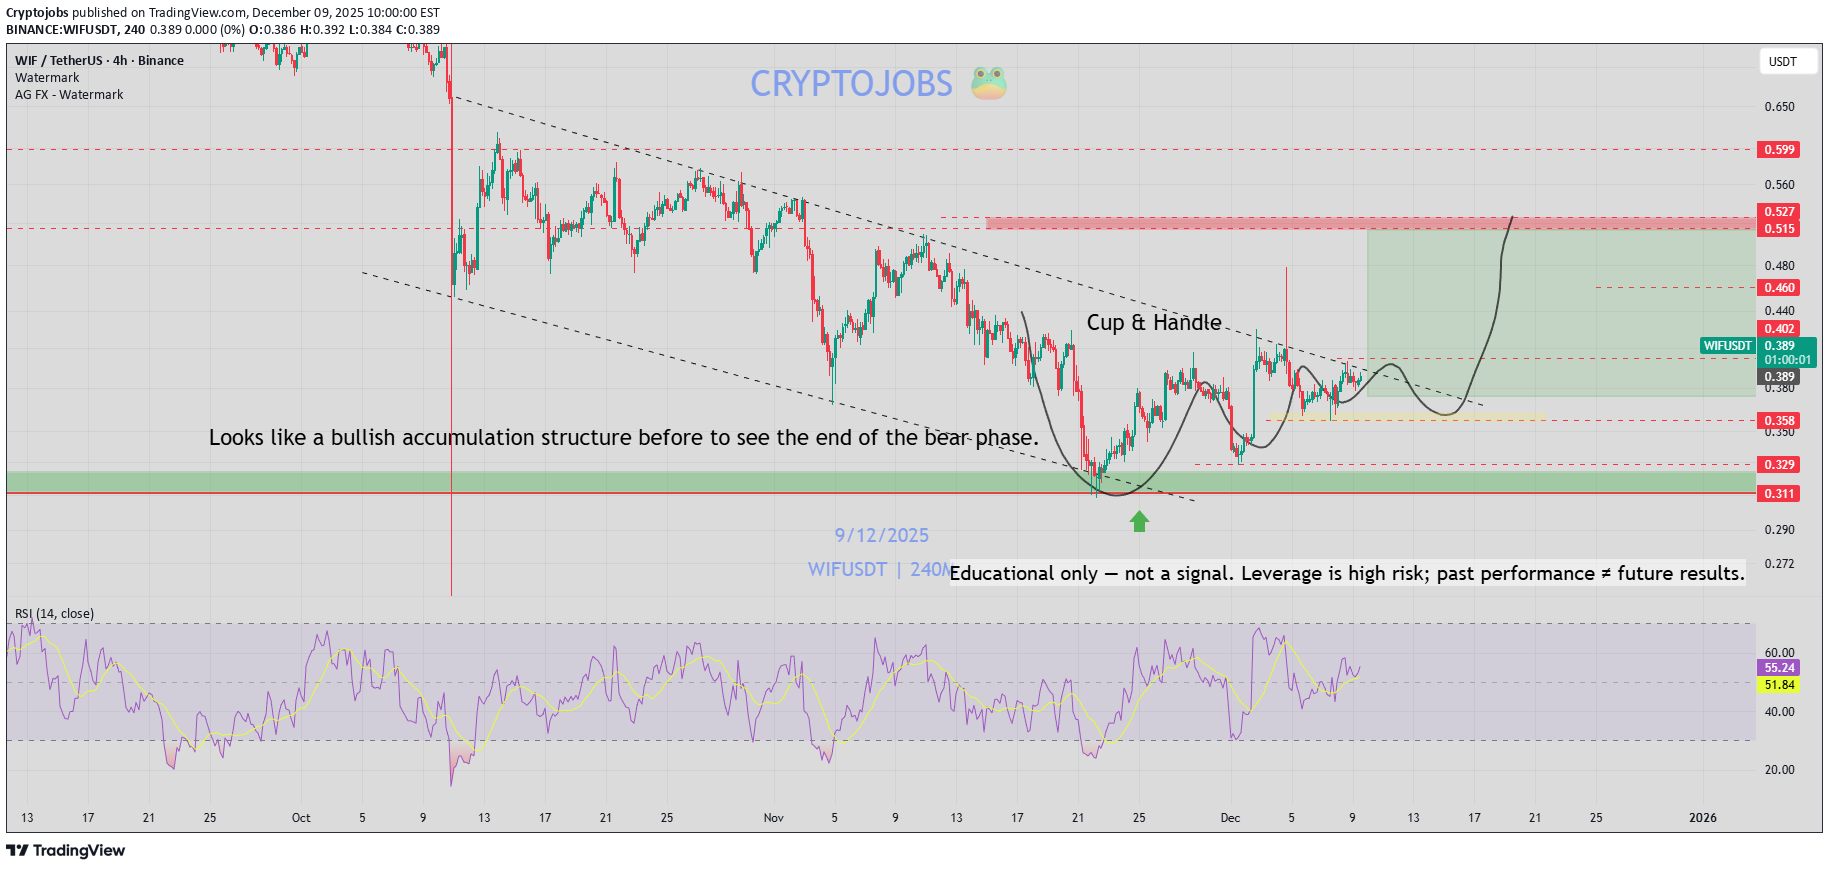
🟩 WIF - Price analysis I think we are going to see a bullish correction soon on the #alt market!📈 The Fed is expected to cut rates tomorrow, which could trigger a positive reaction across the market.📈 Here is why I am bullish: ✅ Double bottom on daily chart ✅ Bullish RSI divergence on daily ✅ Likely bullish accumulation structure (if support holds) Current price remains stuck under the 0.410 resistance. If bulls manage to push above, we could see an explosive move toward 0.520 - $ 0.550 📈 What's your point of view? 🐕

CryptoNuclear
WIF در آستانه سقوط یا صعود بزرگ؟ نبرد حیاتی قیمت در منطقه سرنوشتساز
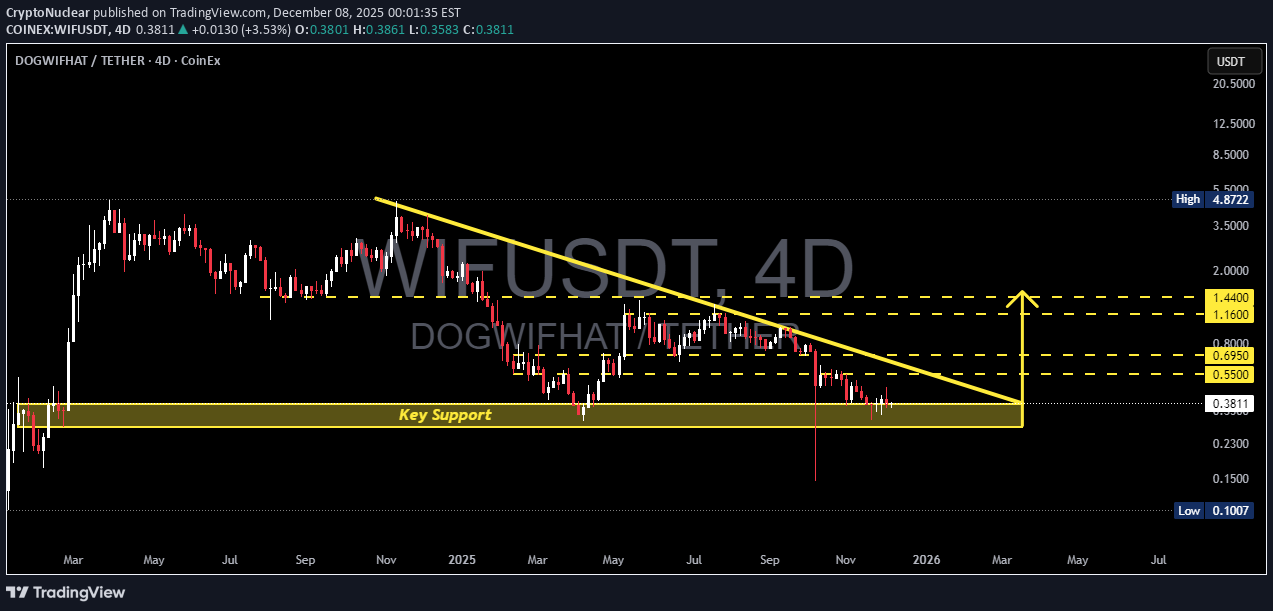
DOGWIFHAT has entered one of the most decisive phases of its entire downtrend. After months of consistent lower-highs beneath the descending trendline, the market is now compressing into the Key Support Zone at 0.38–0.285 — an area that previously acted as a re-accumulation base and a major liquidity sweep level. This is not just support. This is the trend-defining battleground. The descending trendline continues to reject every attempt to recover, creating a tight squeeze between seller pressure from above and buyer defense inside the zone. This compression often leads to a high-volatility breakout in one direction. If buyers hold this zone, a structural reversal is on the table with targets rising step-by-step toward: 0.55 → 0.695 → 0.80 → 1.16 → 1.44 If sellers break 0.285 with a clean 4D close, momentum may shift into a fresh markdown, opening downside levels toward: 0.23 → 0.15 → 0.10 The long downward wicks previously seen in this area show liquidity manipulation, confirming that smart money is active and this zone is being defended — or hunted. The next major move will likely be decided here. --- 🟢 Bullish Scenario Price holds the 0.38–0.285 zone Break + 4D close above the descending trendline Successful retest → bullish reversal confirmed Upside targets: 0.55 → 0.695 → 0.80 → 1.16 → 1.44 --- 🔴 Bearish Scenario 4D close below 0.285 Support flips into resistance Downside continuation targets: 0.23 → 0.15 → 0.10 #DOGWIFHAT #WIF #CryptoAnalysis #SupportZone #Breakout #CryptoTrend #PriceAction #AltcoinAnalysis
CryptoWithJames
تحلیل تکنیکال وایف (WIF): هدف جدید ۱۷۱٪ پس از شکست الگوی گوه نزولی!
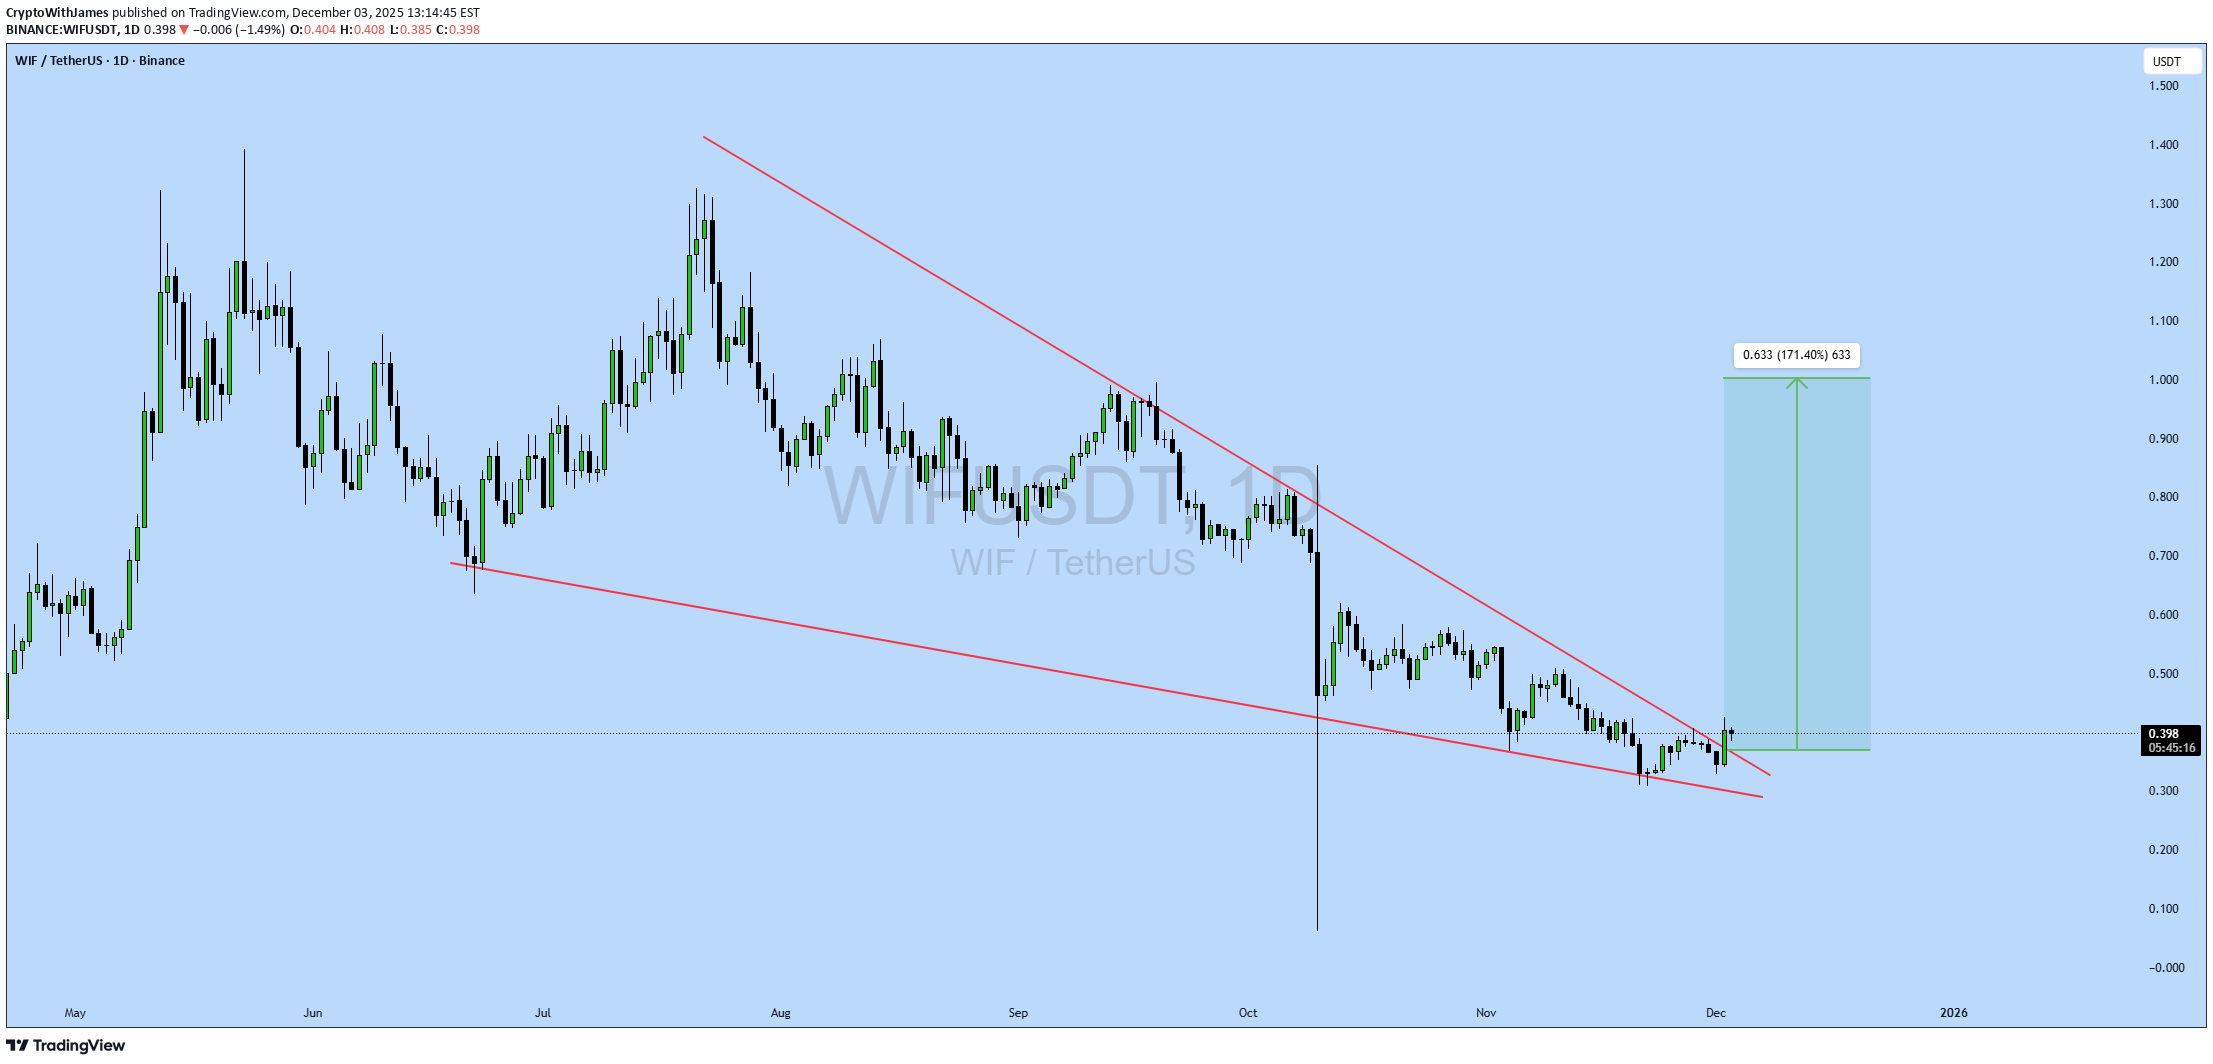
#WIF UPDATE WIF Technical Setup Pattern: Falling Wedge Pattern Current Price: $0.397 Target Price: $0.633 Target % Gain: 171.40% Technical Analysis: WIF is breaking out of a falling wedge pattern on the 1D chart, signaling a potential bullish reversal after an extended corrective phase. Price action has been compressing within the descending wedge structure and is now attempting to break above the upper resistance trendline. The breakout is supported by improving momentum, suggesting increased buyer interest. The measured move from the wedge projects a strong upside continuation toward the highlighted target zone if price holds above the breakout area. Time Frame: 1D Risk Management Tip: Always use proper risk management.
minno91
وِیف (WIF) بعد از یک ریزش کوچک به کجا میرسد؟ پیشبینی انفجاری قیمت!
Alright traders, listen up. We’ve got a beautiful little market shift happening — the kind that can send prices higher in the next days/weeks. Here’s why the market suddenly decided to stop crying: • Technically: BTC finally broke the $92K resistance like it was wet paper. Next stop? $100K test — classic crypto boss fight. • Sentiment: Fear index pointing UP Retail capitulation? DONE Degens returning from the shadow realm. • Fundamentals: ETF inflows are BACK Institutions opening their wallets QT ending → more liquidity → more pump-potential • Macro: Dovish FED + weak USD = rocket fuel for risk assets (aka “let the chaos begin”) ⸻ Now… WIF specifically? I’m expecting a tiny wick down — probably tomorrow or Friday — just enough to scare everyone, liquidate the weak, and reset the chart… …and THEN the rally next week. Classic WIF behavior. Annoying but profitable. 😄 Nothing is 100% (crypto loves trolling), BUT with proper risk management you can literally: 👉 Risk 1% to potentially make 10% Absolutely insane R:R if it plays out. ⸻ ⚠️ Trade safely, legends Watch the wick Don’t FOMO Don’t overleverage And don’t blame WIF if it decides to bark instead of pump 😄🐕 Good luck — this setup could be juicy! 🚀📈closed with 2:1 RR

Bithereum_io
پیشبینی انفجاری قیمت WIF: آیا کف حمایتی هفتگی جانشین موج صعودی میشود؟ (مراقب این نقاط باشید!)
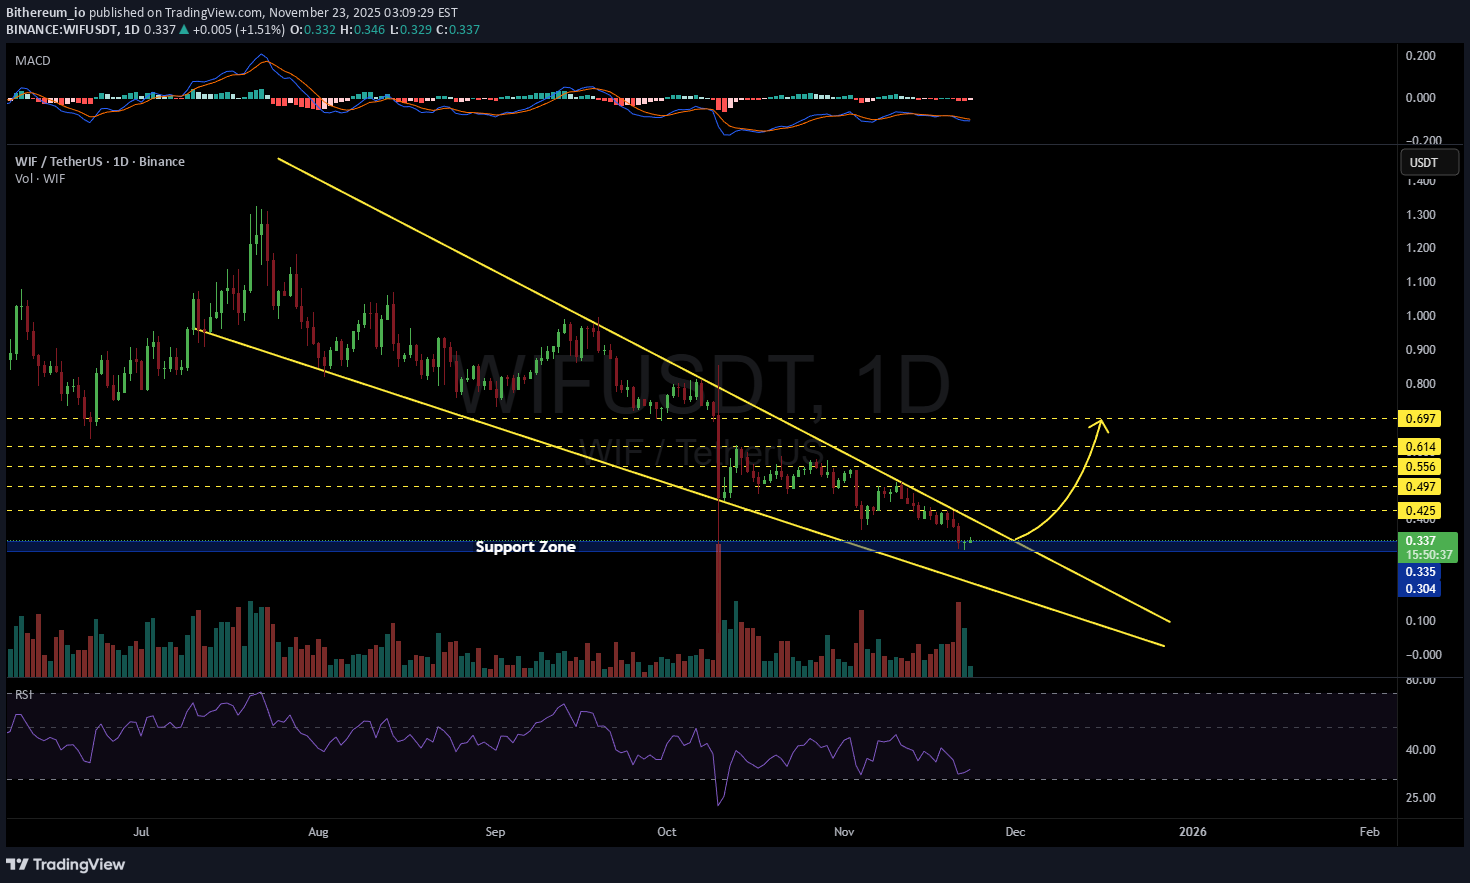
#WIF is moving inside a falling wedge pattern on the daily chart. It is currently sitting on a weekly support zone, where the probability of a bounce is high, potentially pushing price toward the wedge-breaking resistance. Consider buying only after a solid breakout. If that breakout confirms, the potential targets are: 🎯 $0.425 🎯 $0.497 🎯 $0.556 🎯 $0.614 🎯 $0.697 ⚠️ Always remember to use a tight stop-loss and maintain proper risk management.

KECapital
تحلیل تخصصی WIFUSDT: برنامه معاملاتی سودآور پس از رشد ۲۰۰ درصدی!

A trading idea for traders - for people who think, who are mentally balanced, not for those who like to gamble in a casino. I will publish another idea publicly from the closed set. Publicly and for free, I’m not going to explain anything about how to manage your capital, in what proportion, which zones, what orders and where, or the risks - everyone must decide this on their own (your profit depends directly on it). This is a continuation - the previous idea delivered around +200% on average. The overall chart shows the general expected scenarios. Let’s break them down one by one. 1) Horizontal channels. The price moves within similar horizontal channels. Right now we are in the central one, in its outer support zone. A move into the lower channel would mean complete capitulation. 2) The large descending channel. Price action within the descending channel. All zones are marked on the chart. A breakout and consolidation above the channel’s resistance is important. 3) Dragon. Implementation of the ‘dragon’ trading pattern and working with it. The phase of forming the right leg. 4) Probabilities of decline. Clear zones. Working based on risk. The snowball effect of compound interest. Stable capital growth is not about gambling, leveraged positions, or constant guessing about where the price will go.

BandForBands
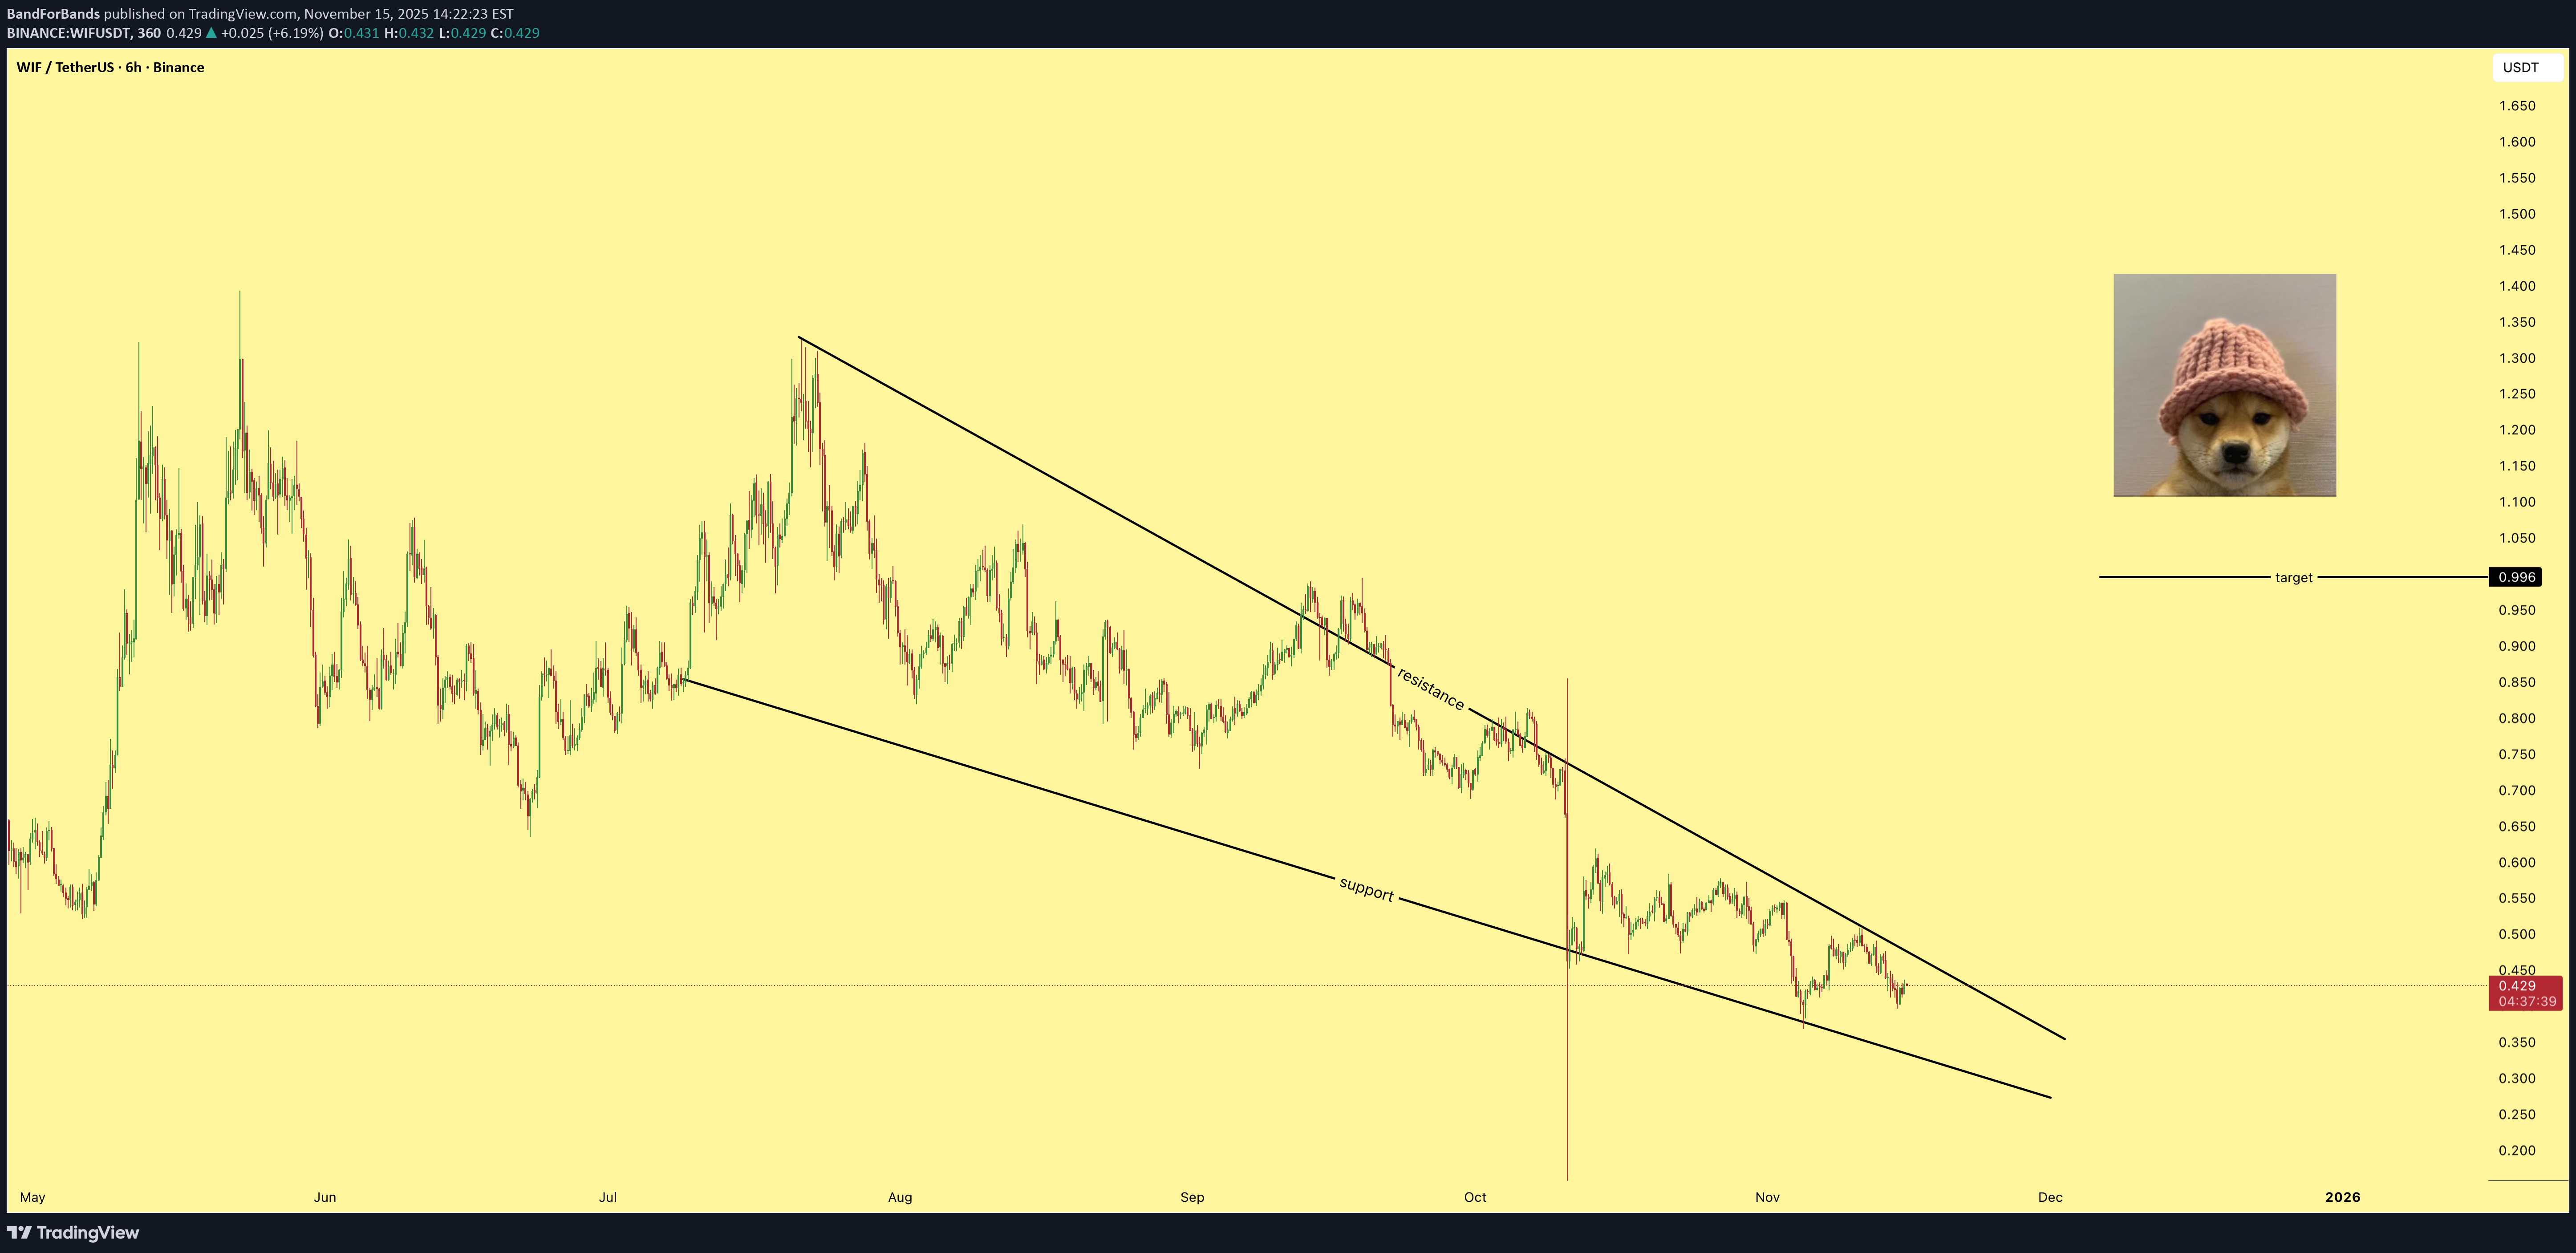
minno91
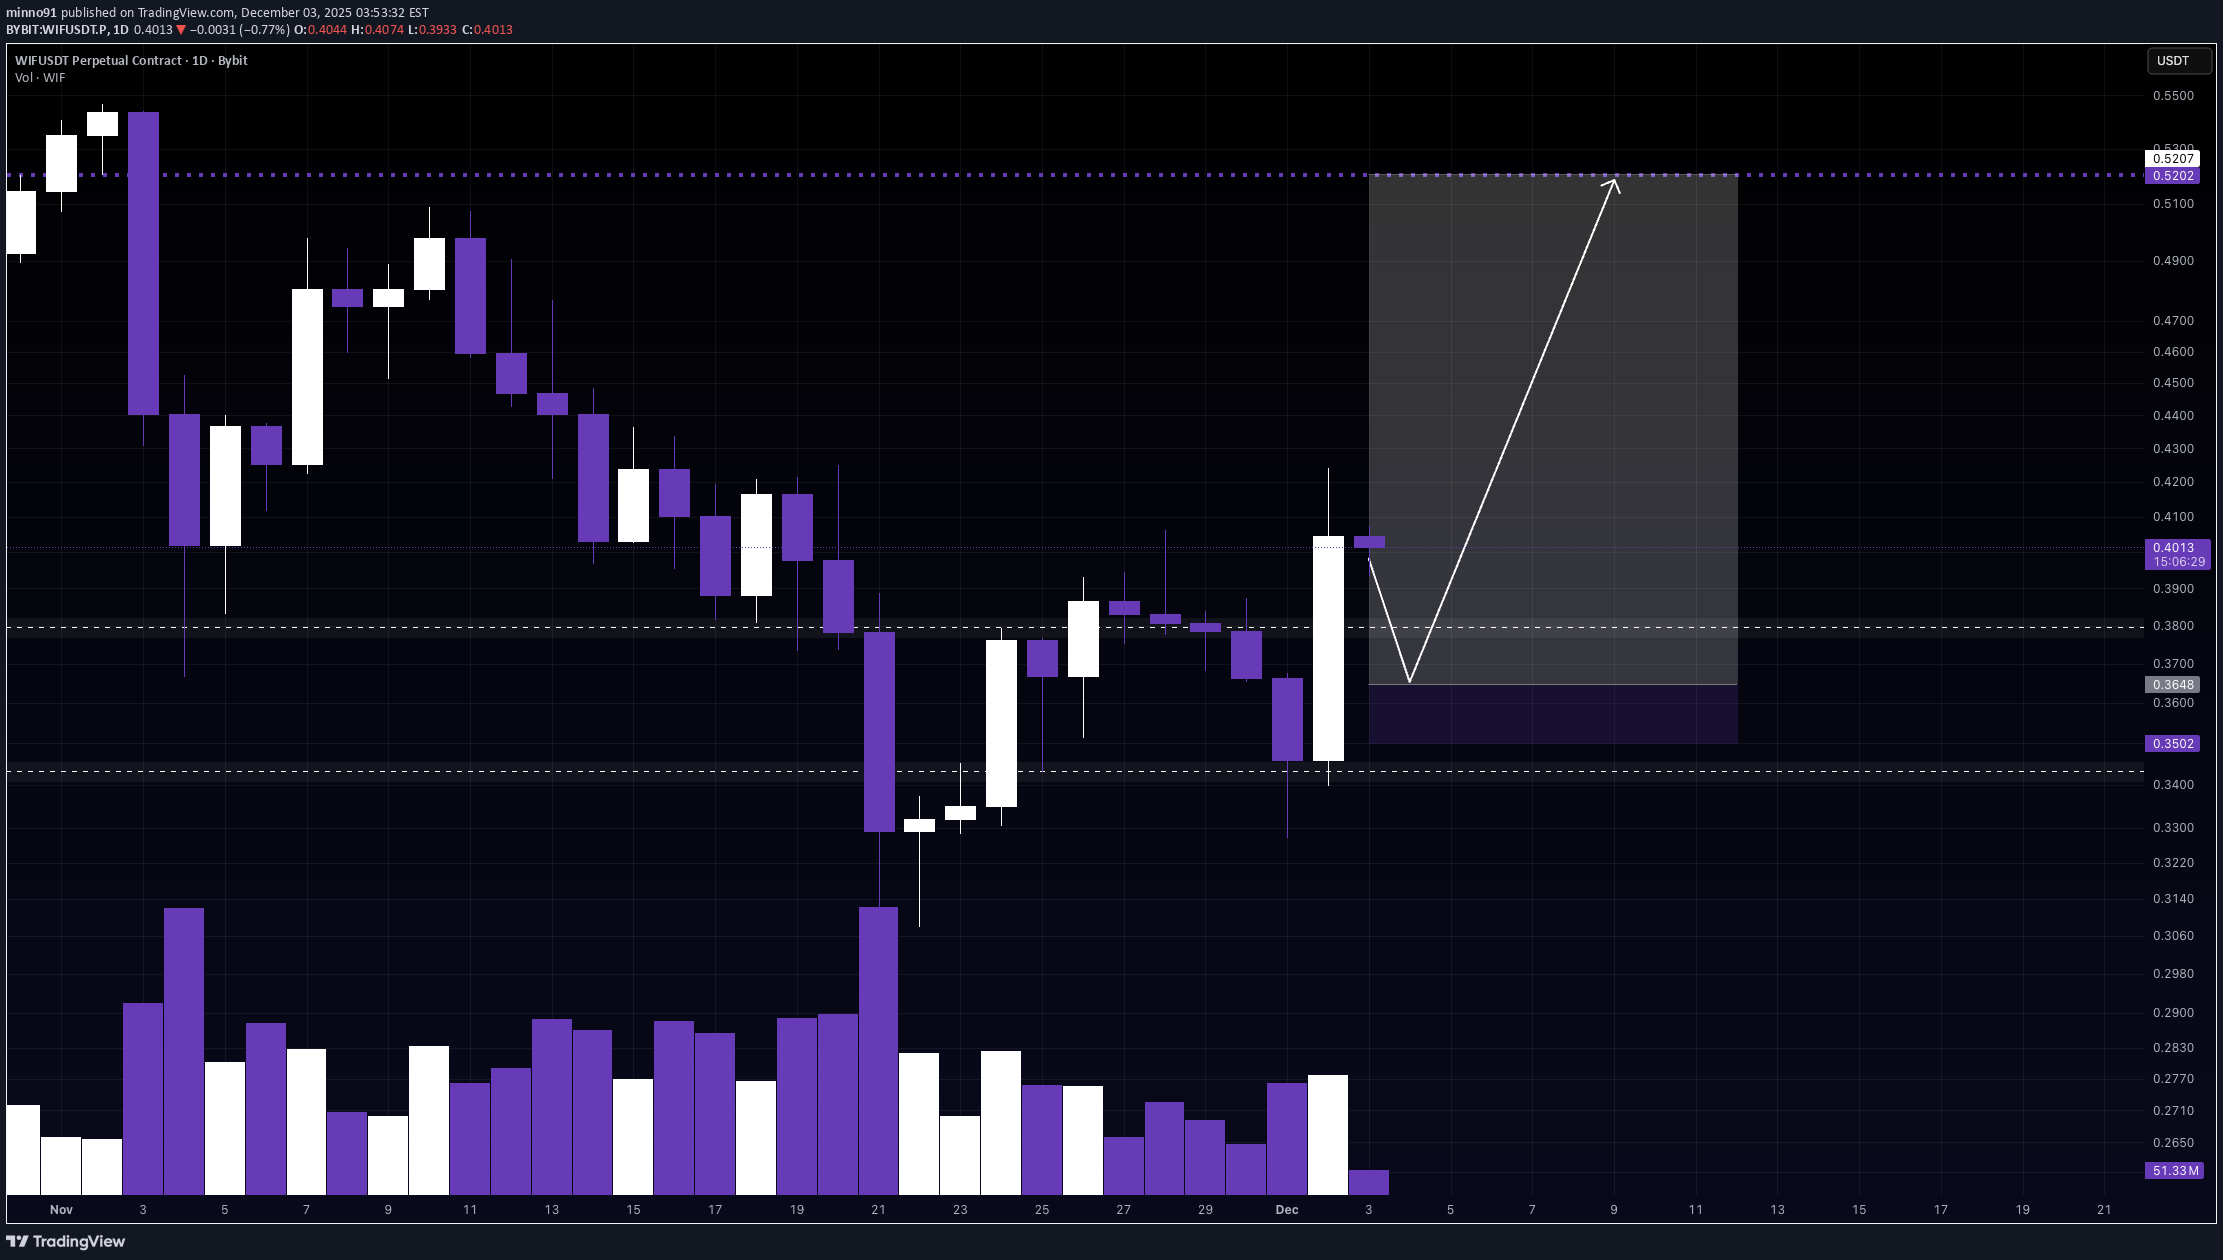
احتمال سقوط ارز WIF: آیا ریسک معامله با سود 7 برابری ارزشش را دارد؟

Alright, I’m hopping into this one a bit late — fashionably late, like every great crypto entry. BUT the good news? Because of that, we’re looking at a juicy R:R over 7:1. Yes, SEVEN. If this hits, I’m buying myself something nice. If it doesn’t… well, that’s what stop-losses are for. 😅 It’s definitely a riskier setup, but WIF is showing potential for another leg down in the coming days. With an R:R like this, I’m willing to risk it — responsibly, of course… kind of. Good luck, legends — may your trades print and your emotions stay unleveraged. 📉🔥🐕💚
Disclaimer
Any content and materials included in Sahmeto's website and official communication channels are a compilation of personal opinions and analyses and are not binding. They do not constitute any recommendation for buying, selling, entering or exiting the stock market and cryptocurrency market. Also, all news and analyses included in the website and channels are merely republished information from official and unofficial domestic and foreign sources, and it is obvious that users of the said content are responsible for following up and ensuring the authenticity and accuracy of the materials. Therefore, while disclaiming responsibility, it is declared that the responsibility for any decision-making, action, and potential profit and loss in the capital market and cryptocurrency market lies with the trader.