
BlessingTrade
@t_BlessingTrade

What symbols does the trader recommend buying?
Purchase History
پیام های تریدر
Filter
BCH: $700–$800 Before the Next Bear Market
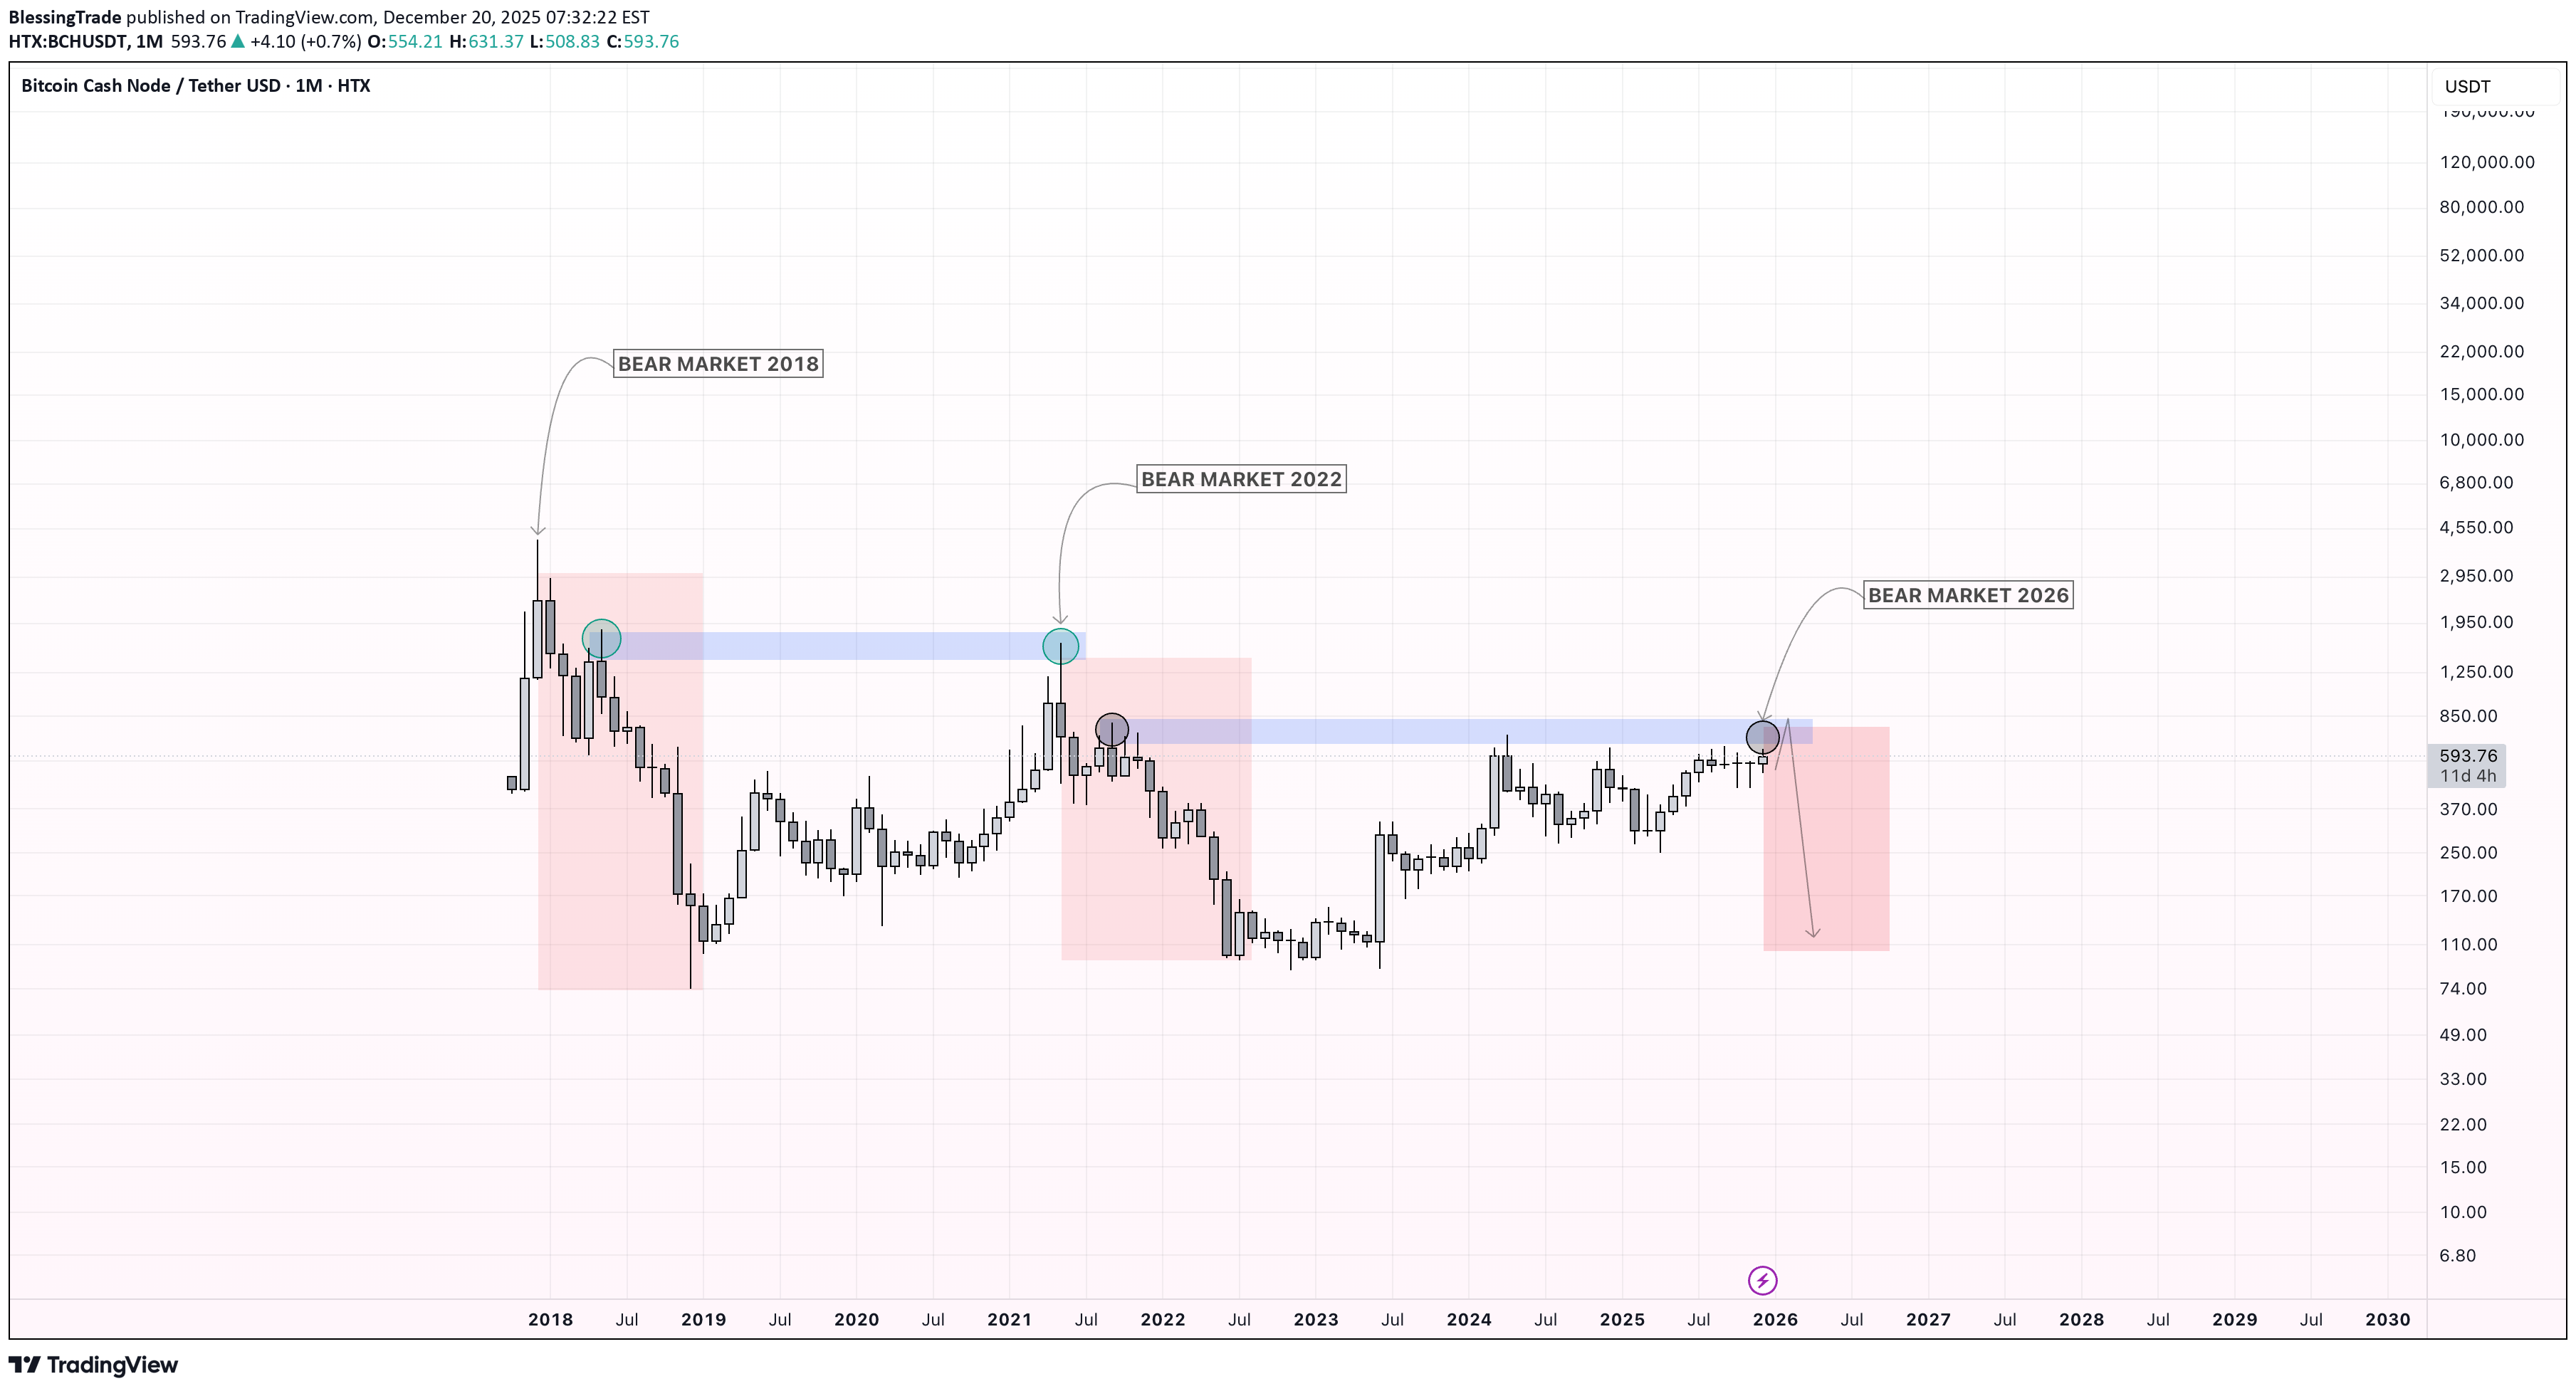
BCH Macro Resistance Before Bear Market Based on historical price structure, Bitcoin Cash (BCH) appears to be approaching a macro resistance zone around $700–$800 , which has previously marked the final upside before major bear markets. In 2018 and 2022, BCH followed a very similar pattern: A prolonged accumulation phase A strong push into a horizontal resistance zone A rejection from that zone, followed by a deep bear market decline The current structure closely mirrors those past cycles. Price is once again testing the same historical supply zone, where sellers previously stepped in aggressively. Key idea: I expect BCH to reach the $700–$800 range This level could act as the last distribution zone before the broader market transitions into a new bear market phase This is not a short-term trade idea, but a macro perspective based on repeating market behavior and long-term resistance reactions. ⚠️ As always, confirmation is needed, and this scenario is invalidated i f price accepts and holds above the resistance zone.
تکرار تاریخ: آیا بیت کوین قبل از سقوط بزرگ ۲۰۲۶ در دام تثبیت گیر میکند؟
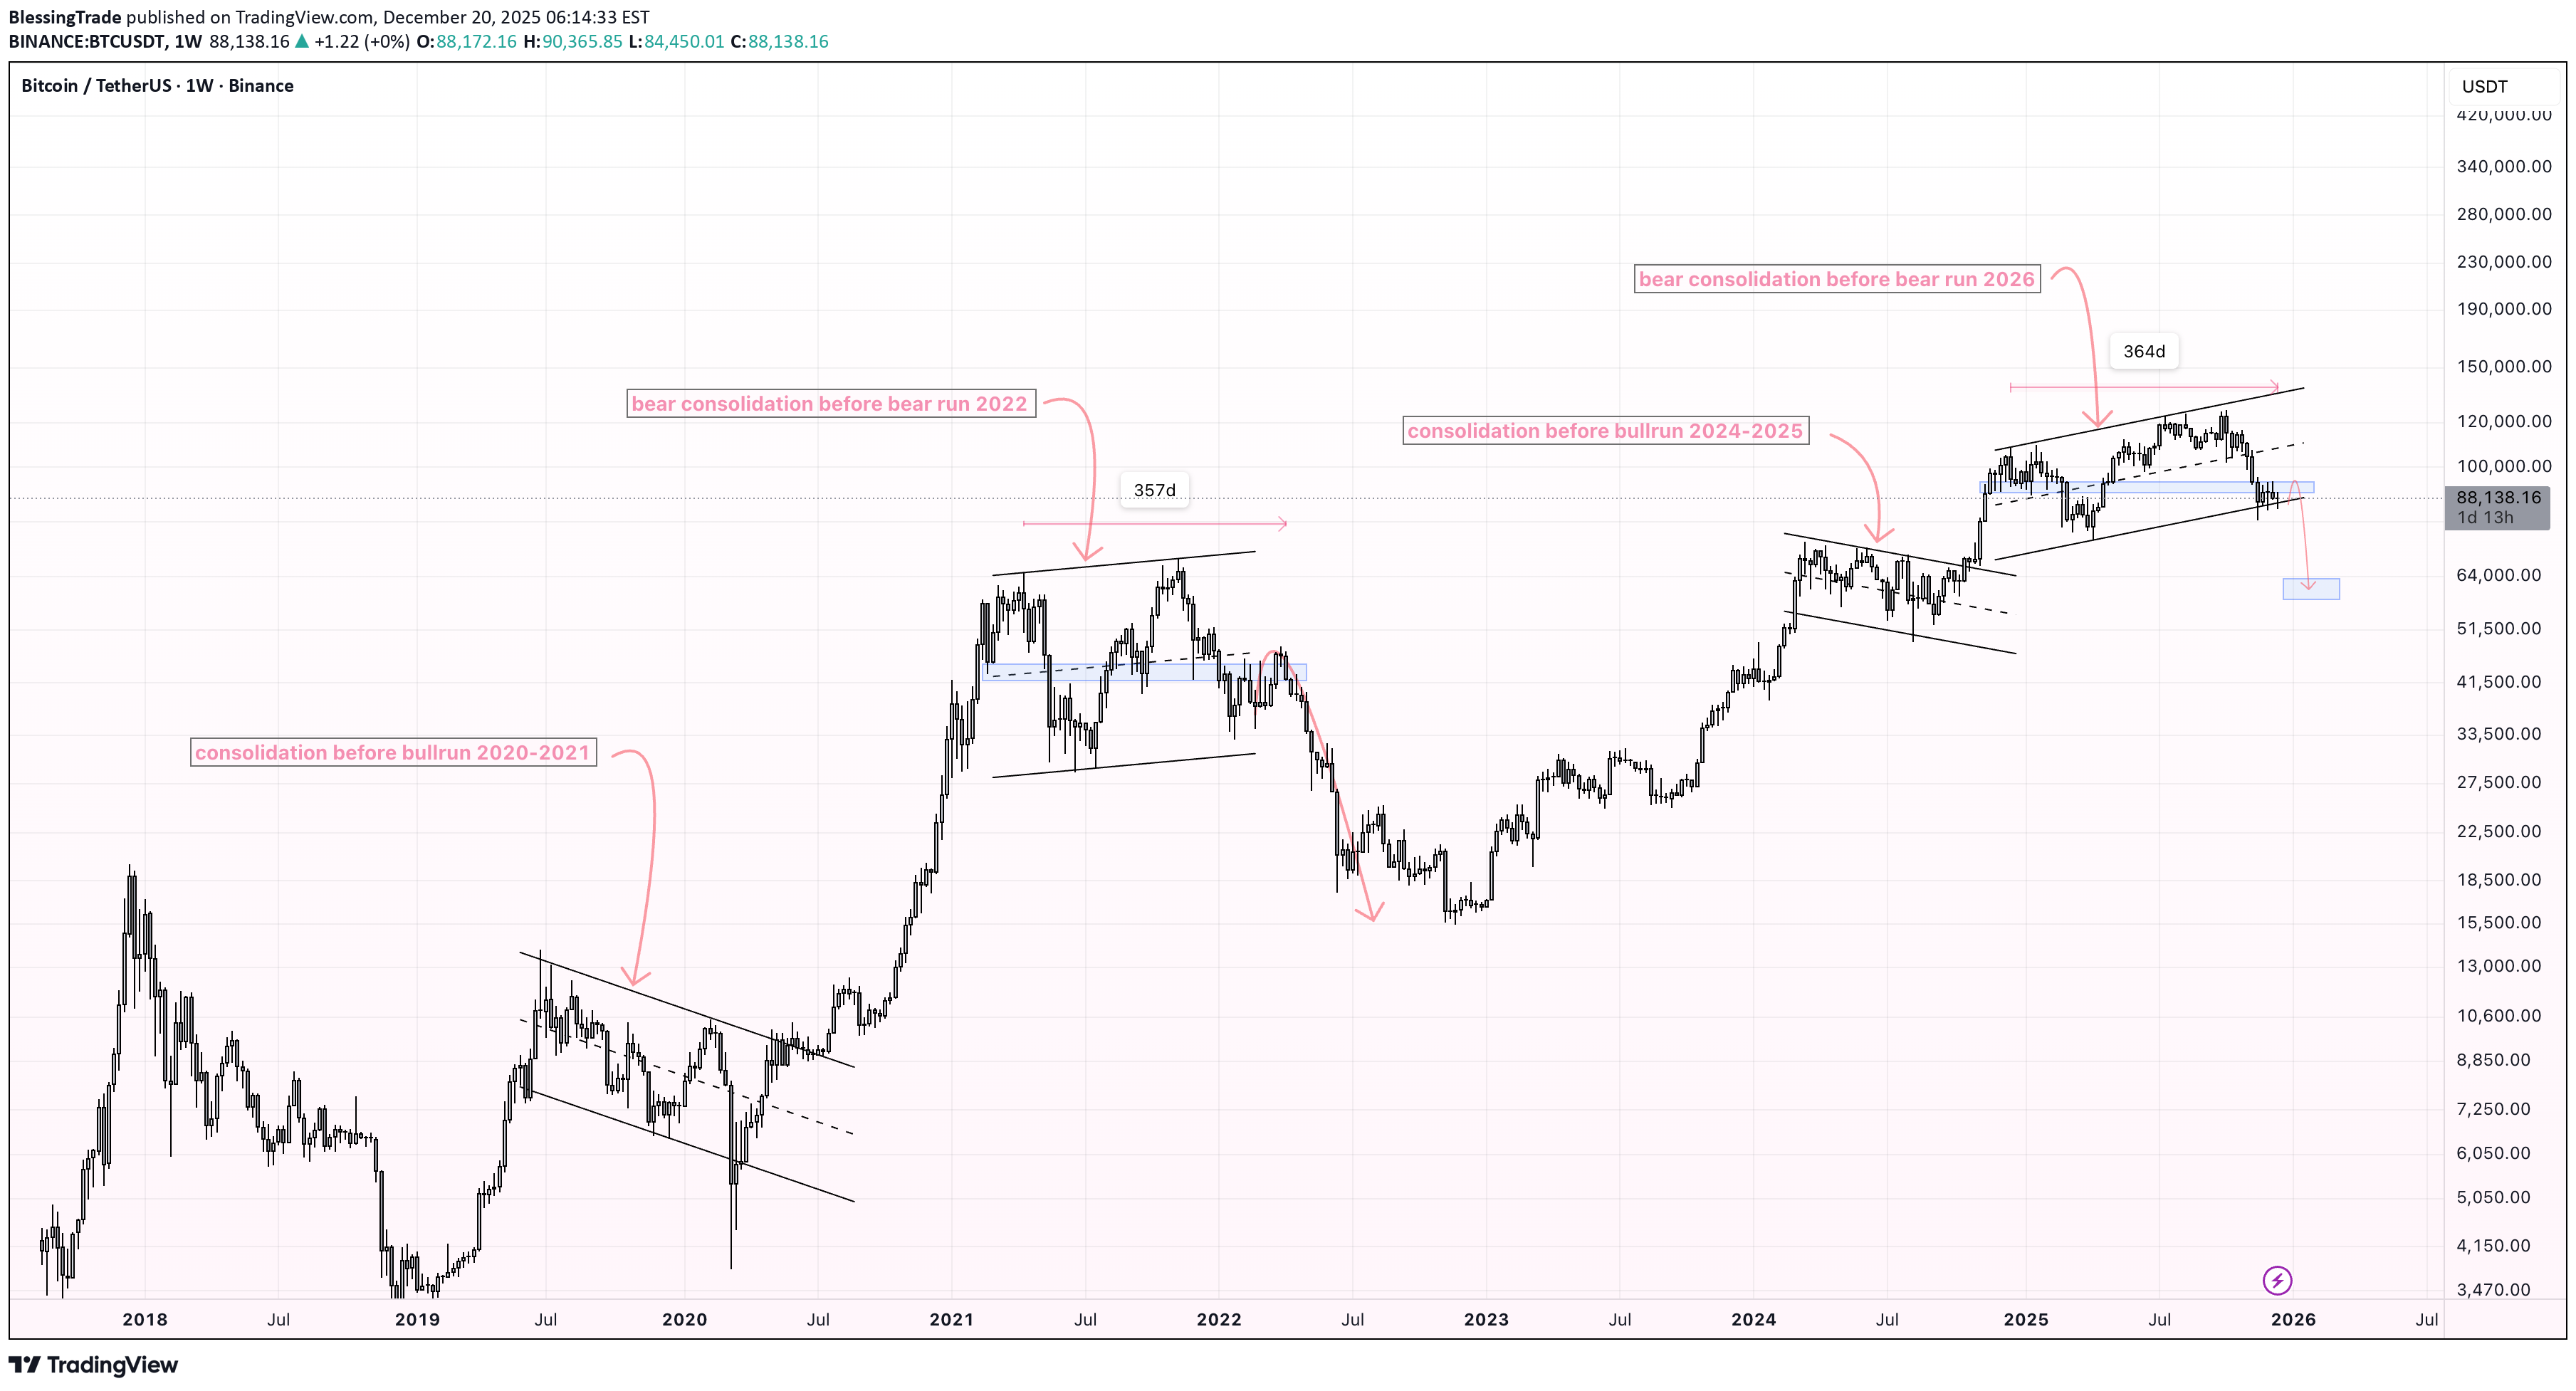
History Repeats: 2020–2022 vs 2024–2026 In 2020 , before the strong bull run of 2020–2021, Bitcoin formed a clear bull flag consolidation on the higher timeframe. After the bull market top in 2021 , price entered a distribution phase , forming a bearish structure, which eventually led to the bear market of 2022. The current market structure looks very similar. During 2024–2025, Bitcoin is again consolidating after a strong impulse, forming a rising structure that resembles previous pre-bear-market consolidations. If this fractal continues to play out, I expect: Continuation of consolidation in 2025 Transition into a bear market in 2026 My near-term downside target is the 60–65k USD range, which aligns with previous support and structural levels.
Bearish Flag Forming — Potential Continuation to the Downside
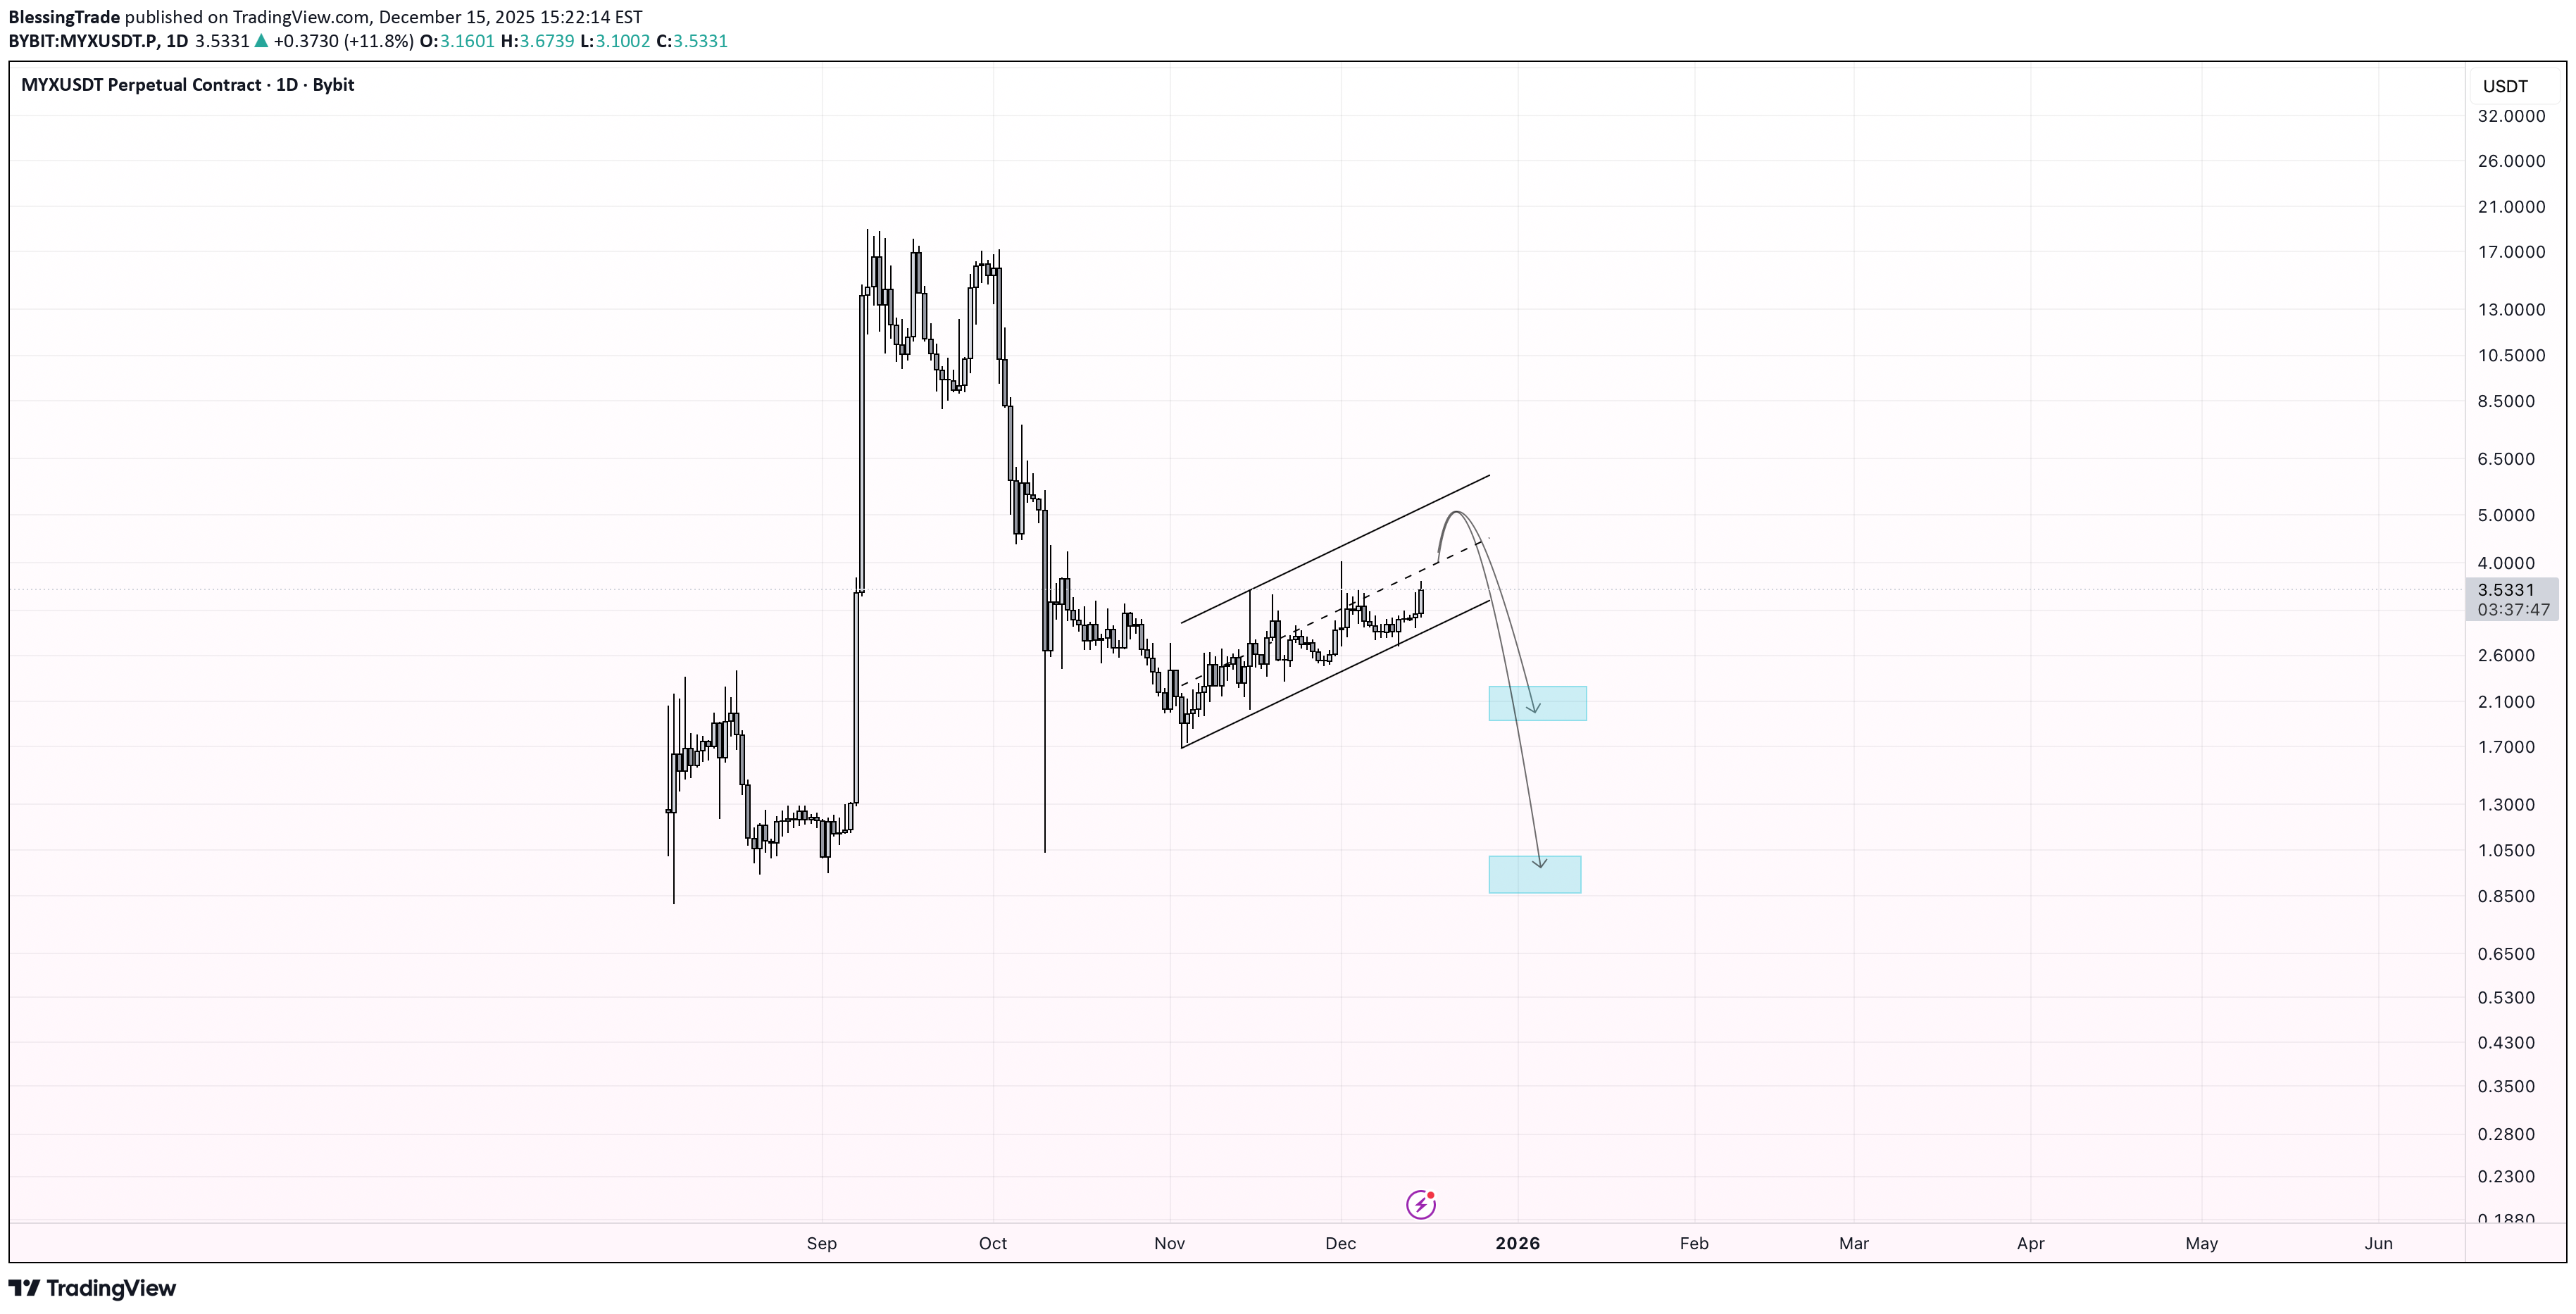
Price action suggests a bearish flag is forming after a sharp impulsive move down. The current rising channel looks corrective rather than impulsive, which is typical behavior before continuation to the downside. This asset shows classic pump & dump characteristics: a fast vertical pump, followed by heavy distribution and weak consolidation. Such structures statistically favor further decline once the flag breaks down. Bearish scenario: – Breakdown below the lower flag support confirms continuation – Downside targets: 🎯 $2.20 🎯 $1.00 As long as price remains inside the flag, volatility compression continues. A loss of support would likely trigger accelerated selling.beaarrr run!!!
WIFUSDT: Bearish Continuation — Key Support Under Threat
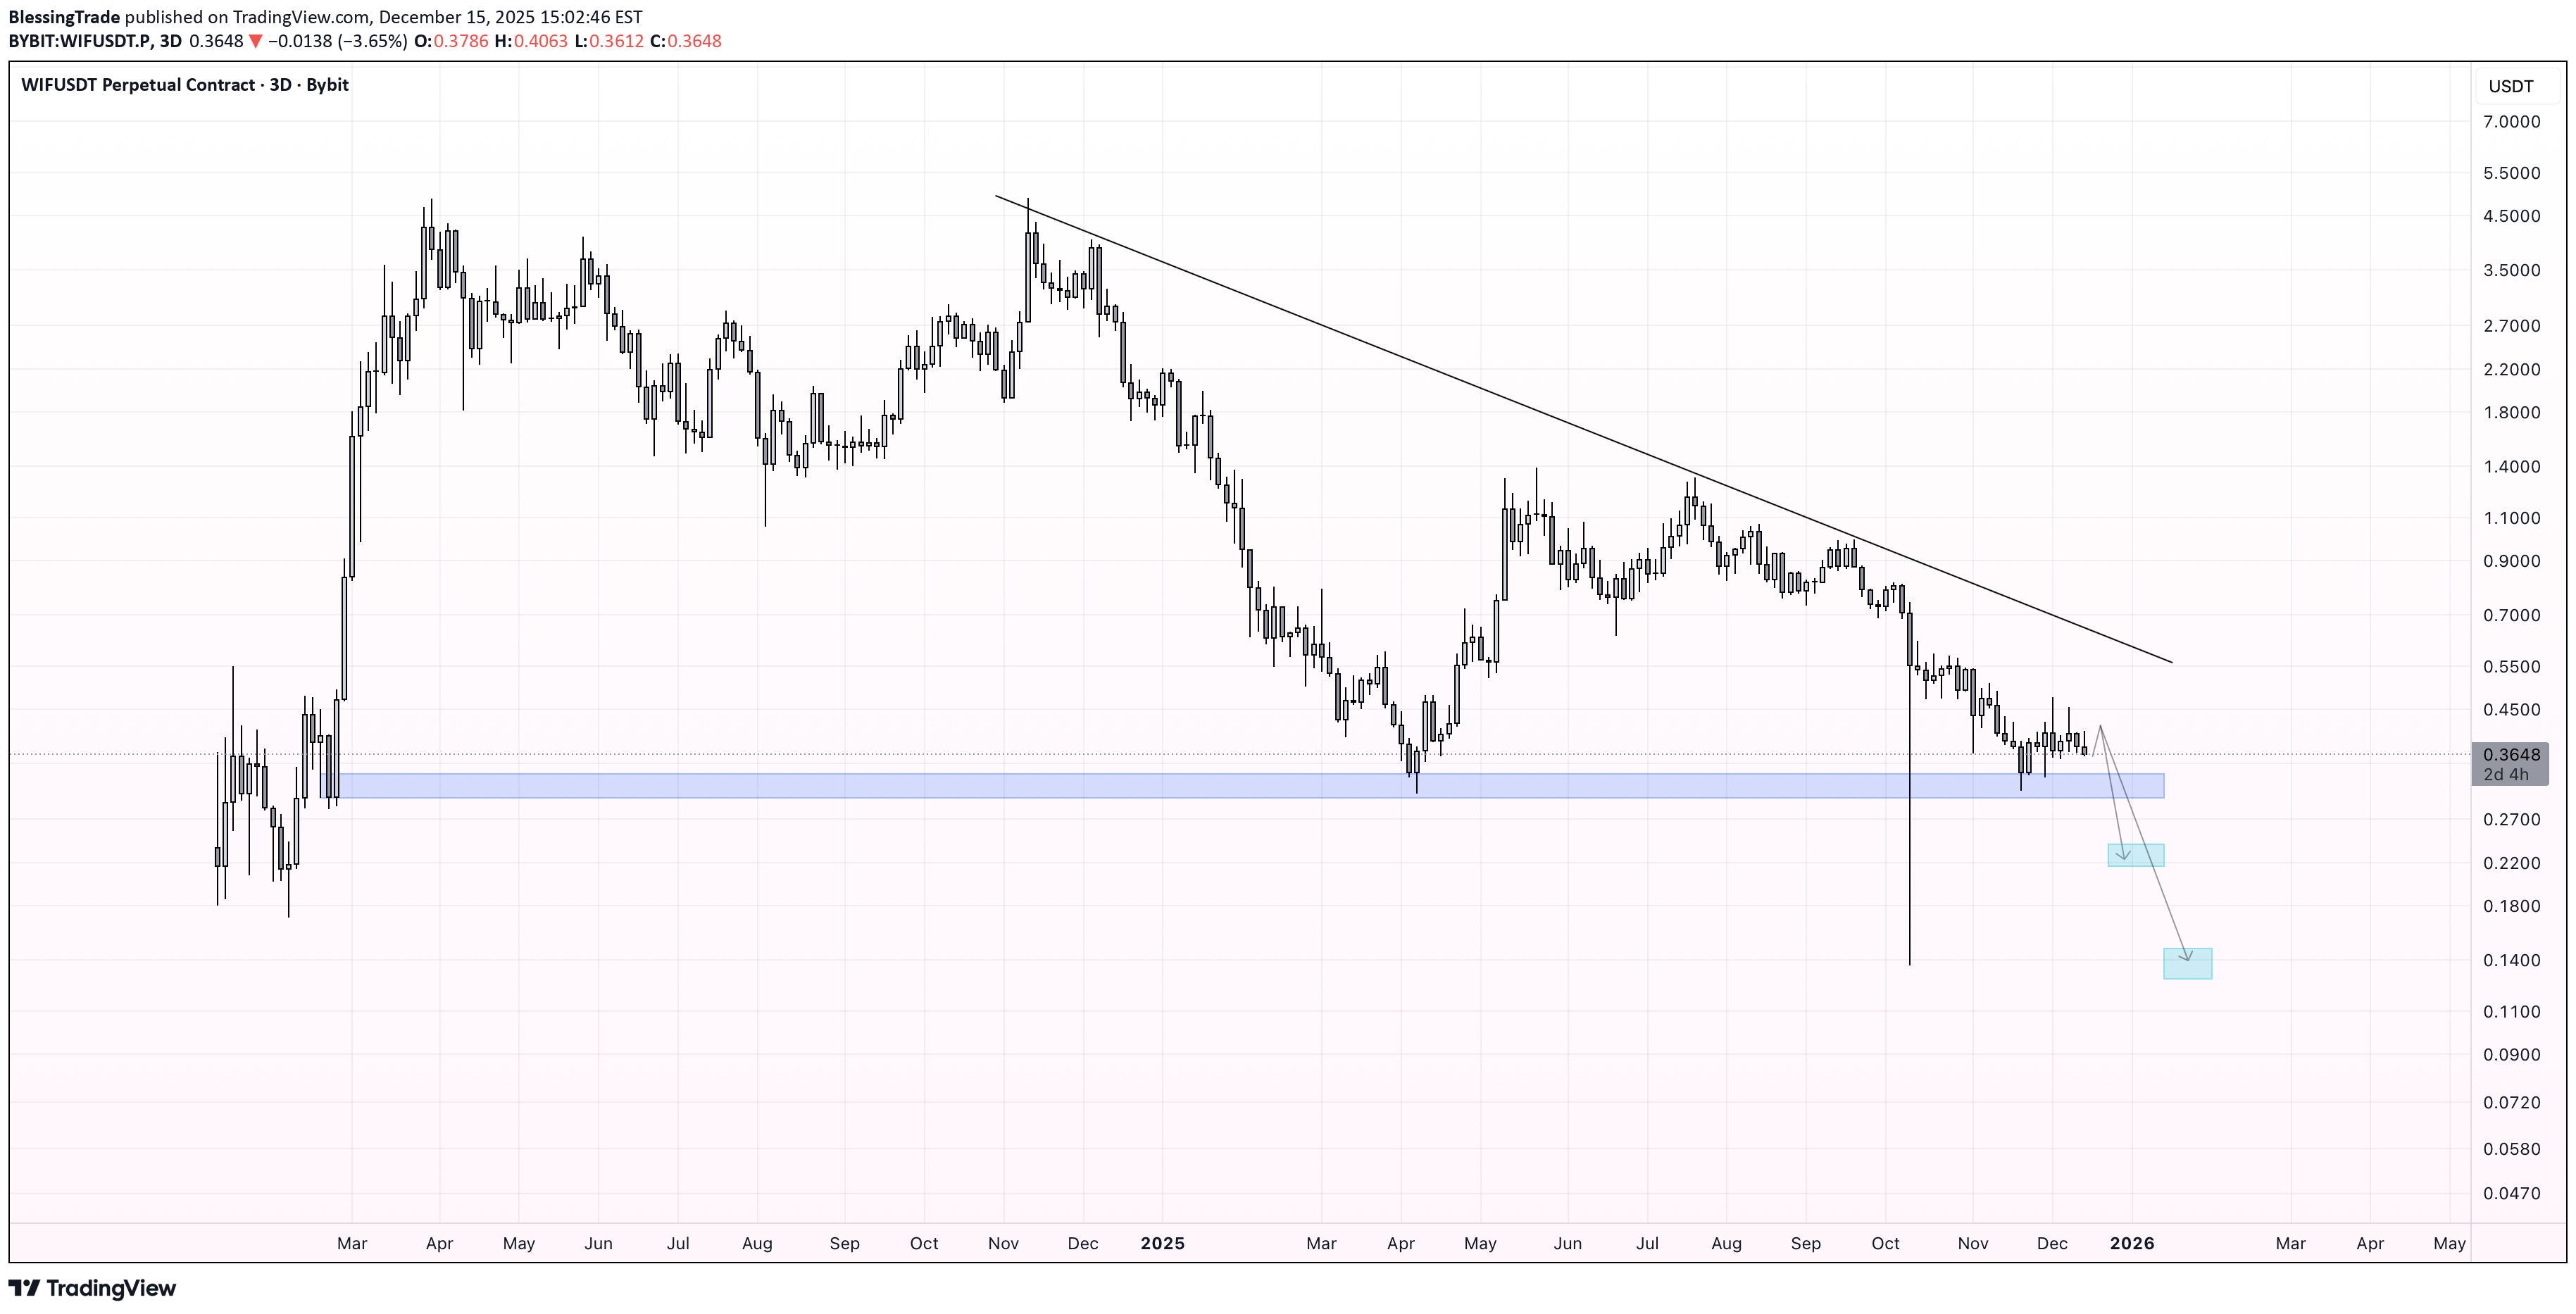
Price continues to move within a clear descending structure , respecting the long-term downtrend trendline . The marked blue zone represents a strong historical support, which has been holding price above a major downside area — essentially the last barrier before a deeper sell-off. At the moment, this support is being tested again , and momentum remains bearish. A clean breakdown below this level would likely open the door for a strong continuation to the downside. Bearish scenario: Confirmed support break → acceleration lower First target: 0.25 USD Second target: 0.15 USD If panic or high sell pressure enters the market, even lower levels are possible As long as price stays below the descending trendline, the bias remains bearish . The blue zone is the key level to watch — once it fails, the market may enter a “free fall” phase.beaarrr run!!!
False Breakout Above Triangle — Expecting Real Breakdown to 0.25
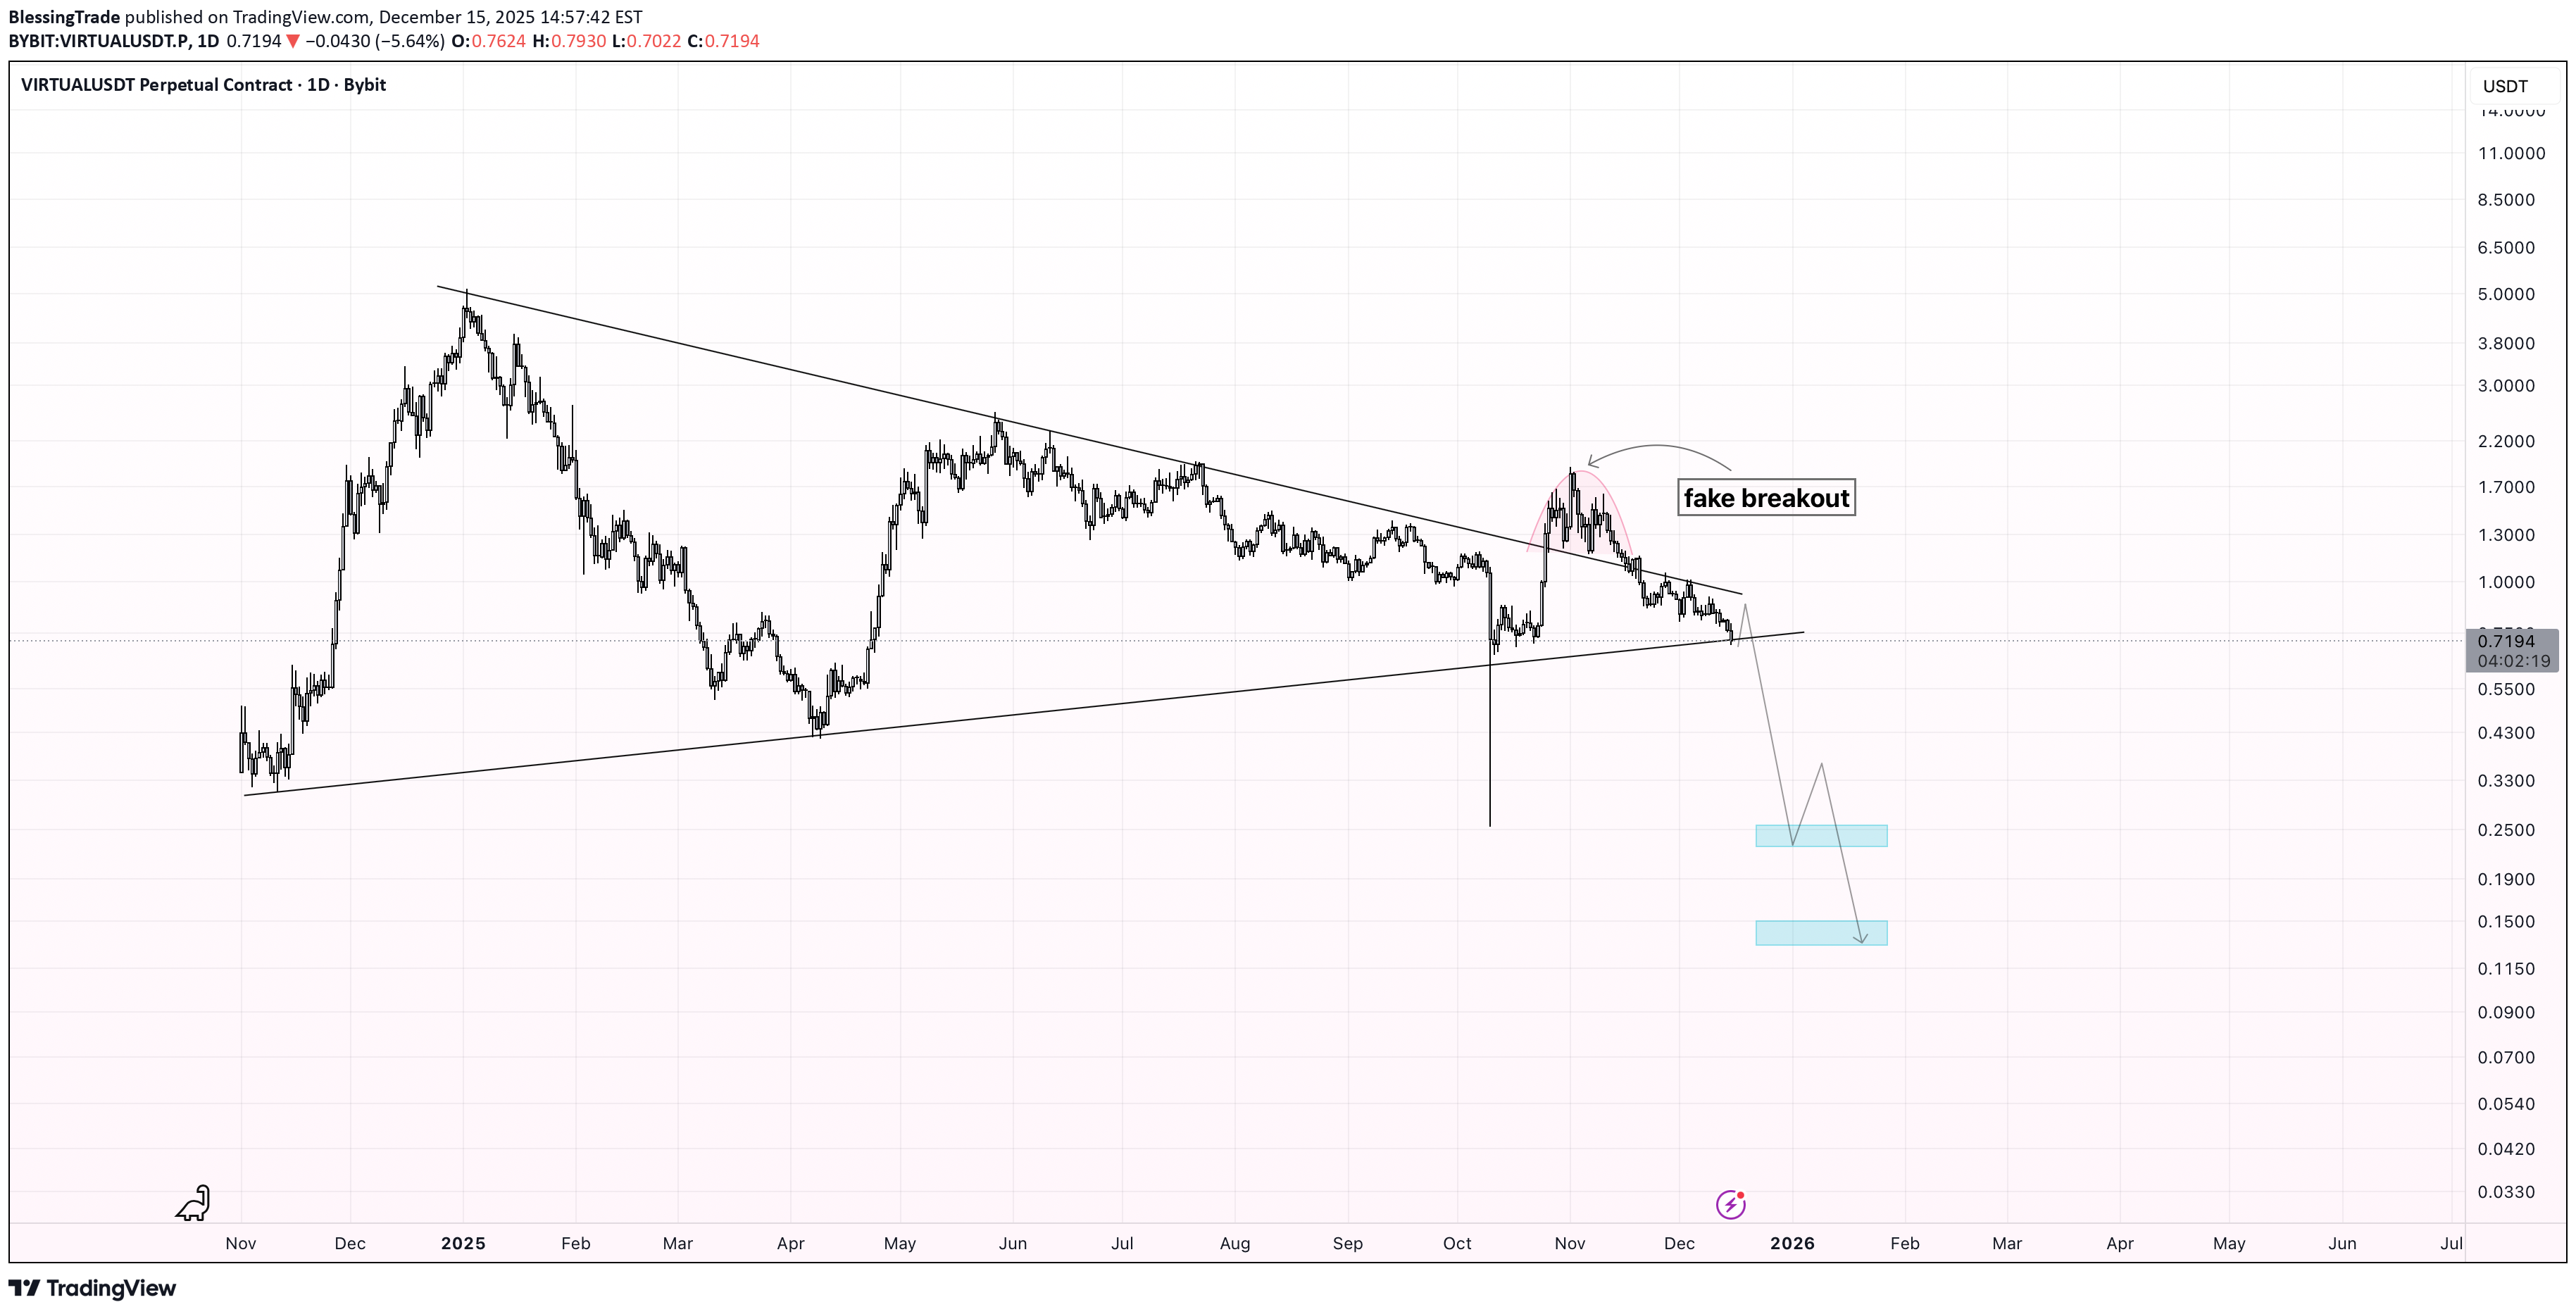
Price has been compressing inside a large symmetrical triangle for an extended period. Recently, we saw a false breakout to the upside , which was quickly rejected and followed by a return back inside the structure — a classic sign of bull trap. At the moment, price is holding near the lower boundary of the triangle. After a small corrective bounce, I expect the true move to start with a breakdown below the triangle support, confirming bearish continuation. If the breakdown is confirmed, the next downside targets are 0.25$ as the first support zone and 0.15$ as the extended target. These levels align with previous structure and potential demand areas. The bearish scenario remains valid while price stays below the upper trendline of the triangle. A clean breakdown with acceptance below support would confirm the setup.beaarrr run!!!
Bear Flag Formation — Downside Continuation Toward 91–88
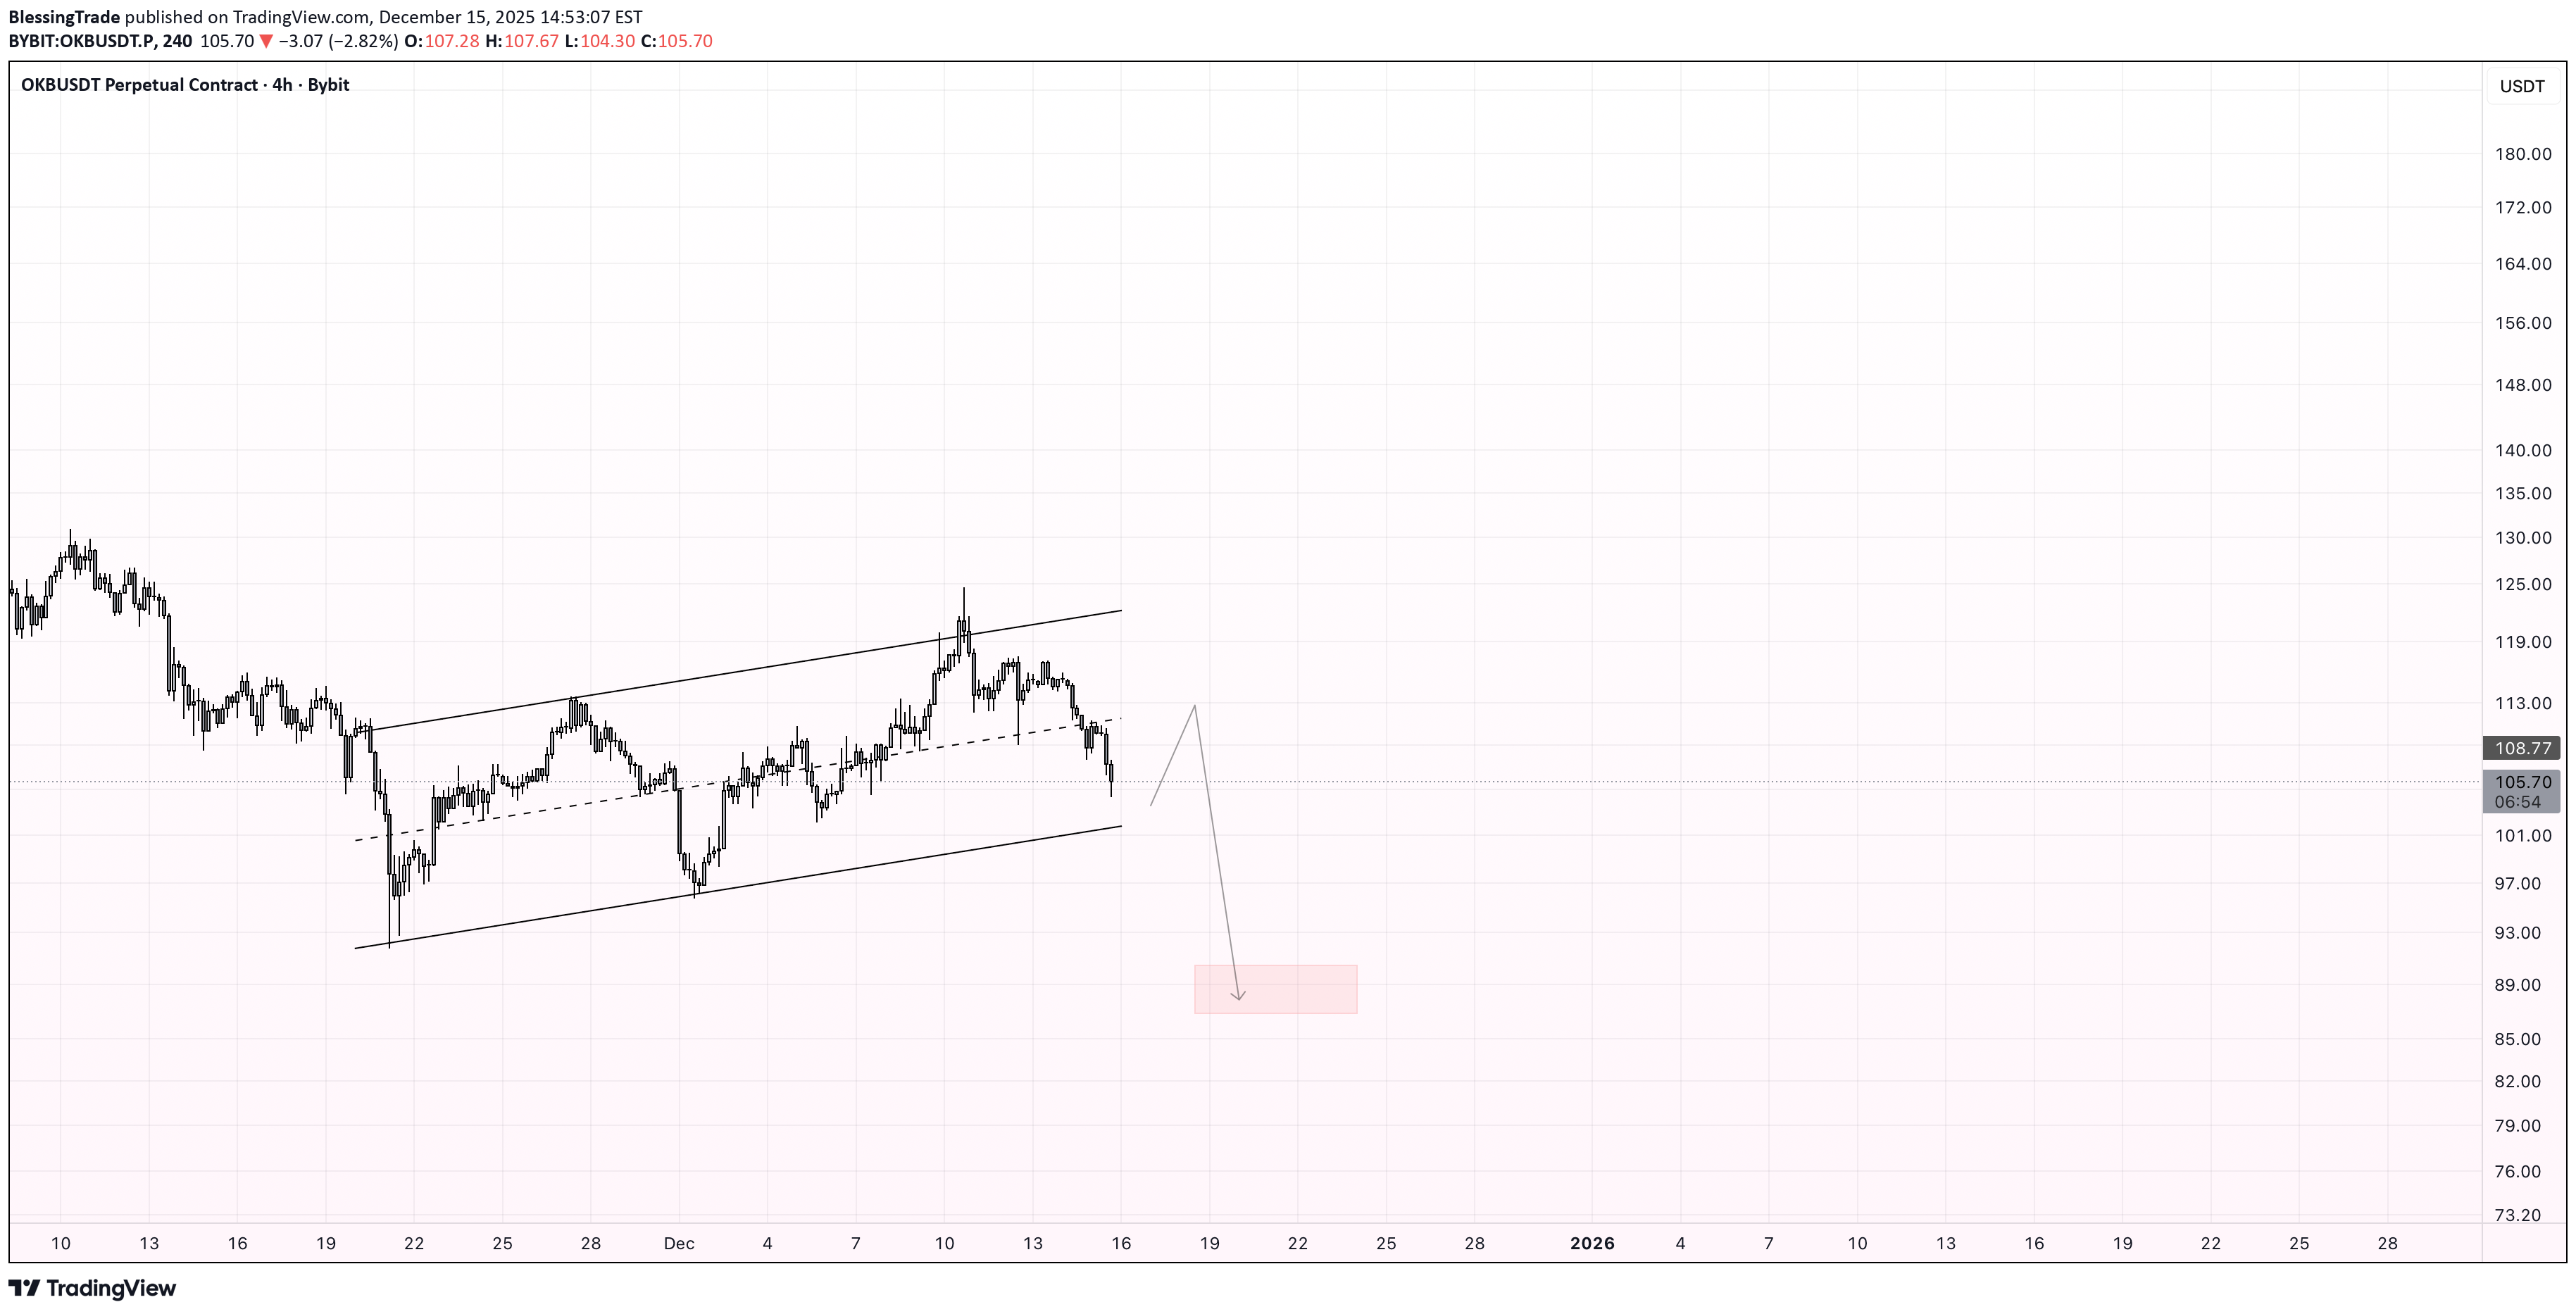
A clear bear flag has formed after a strong impulsive bearish move. Price is currently consolidating inside an ascending corrective channel, which typically represents a pause before trend continuation rather than a reversal. After this corrective bounce, I expect a breakdown below the lower boundary of the flag and continuation of the bearish trend. The measured move of the pattern suggests a downside target in the 91–88 zone, which also aligns with a potential demand/support area. The bearish scenario remains valid as long as price stays below the upper boundary of the flag. A decisive breakdown with momentum would confirm the setup.beaarrr run!!!
مثلث متغیر ADA: منتظر سقوط به زیر ۰.۲۵ دلار باشید!
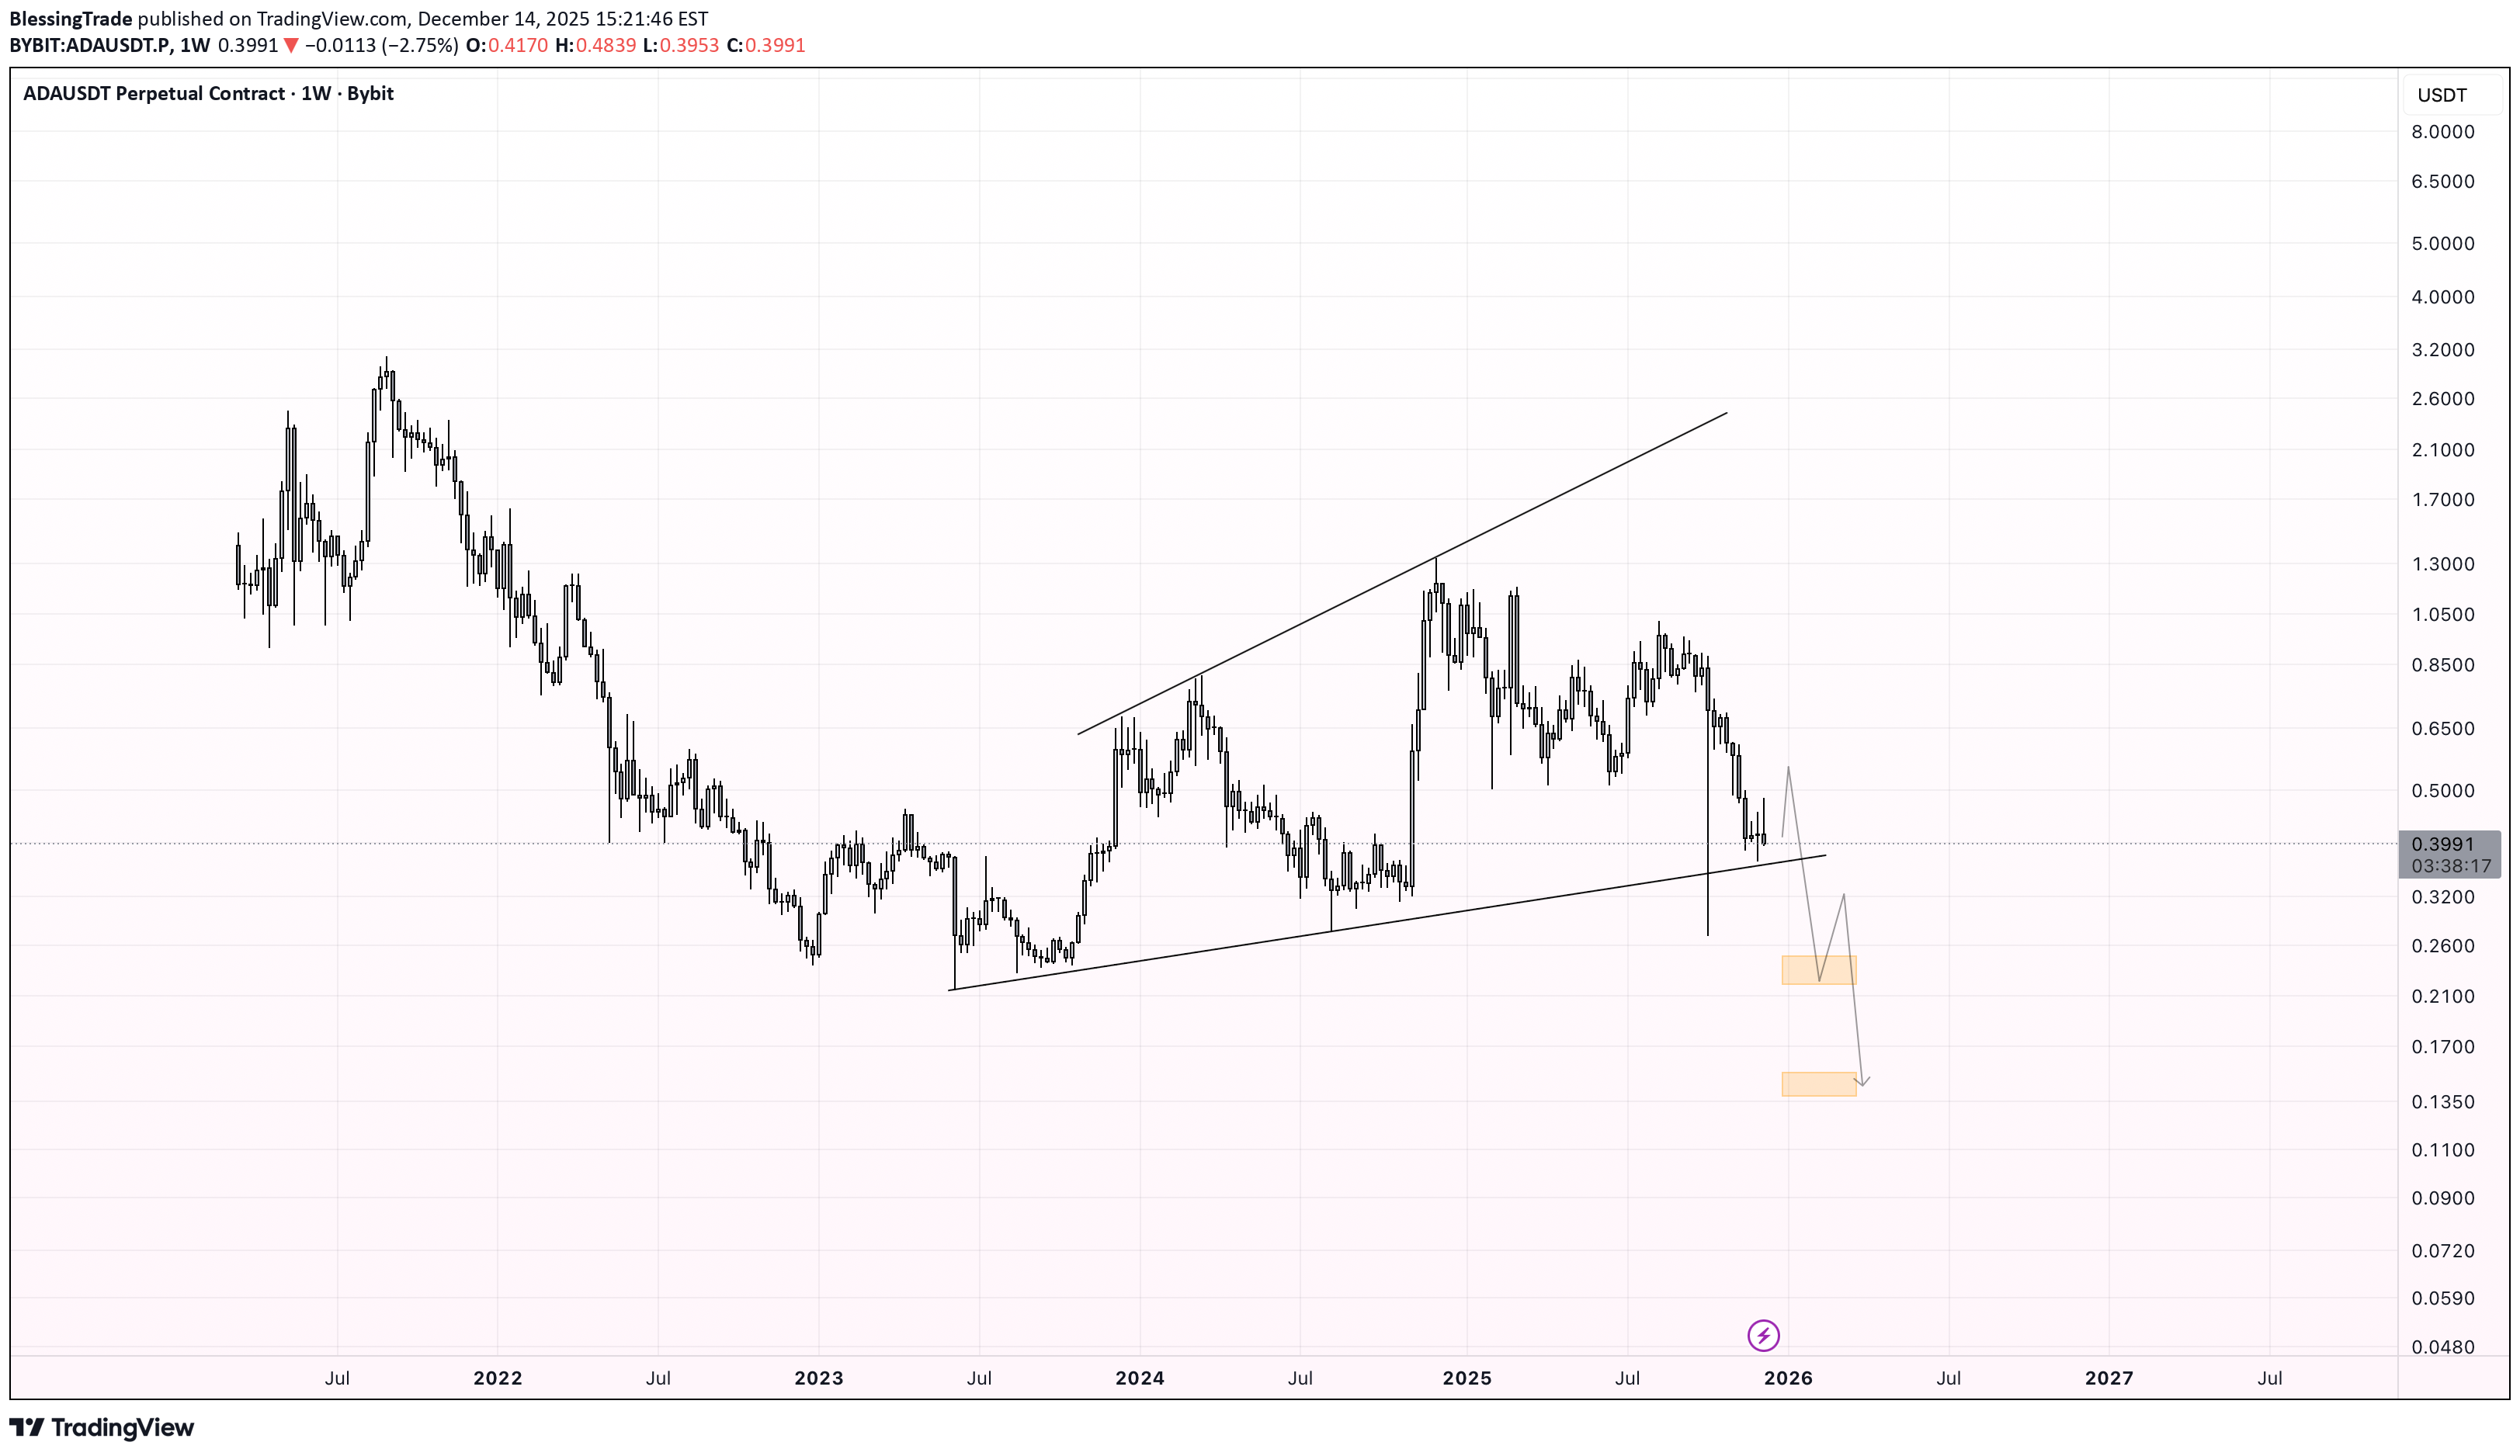
Price is trading within a broadening (expanding) triangle , with higher highs and lower lows indicating increasing volatility and distribution. The structure favors a bearish resolution , and I’m expecting a breakdown below the lower trendline to confirm continuation to the downside. Expectations: Breakdown from the expanding triangle → acceleration lower. Downside Targets: 🎯 $0.25 🎯 $0.15 As long as price stays below the upper boundary, the bearish scenario remains dominant.beaarrr run!!!
Rising Channel Breakdown → Waiting for Better Buy Prices on SUI
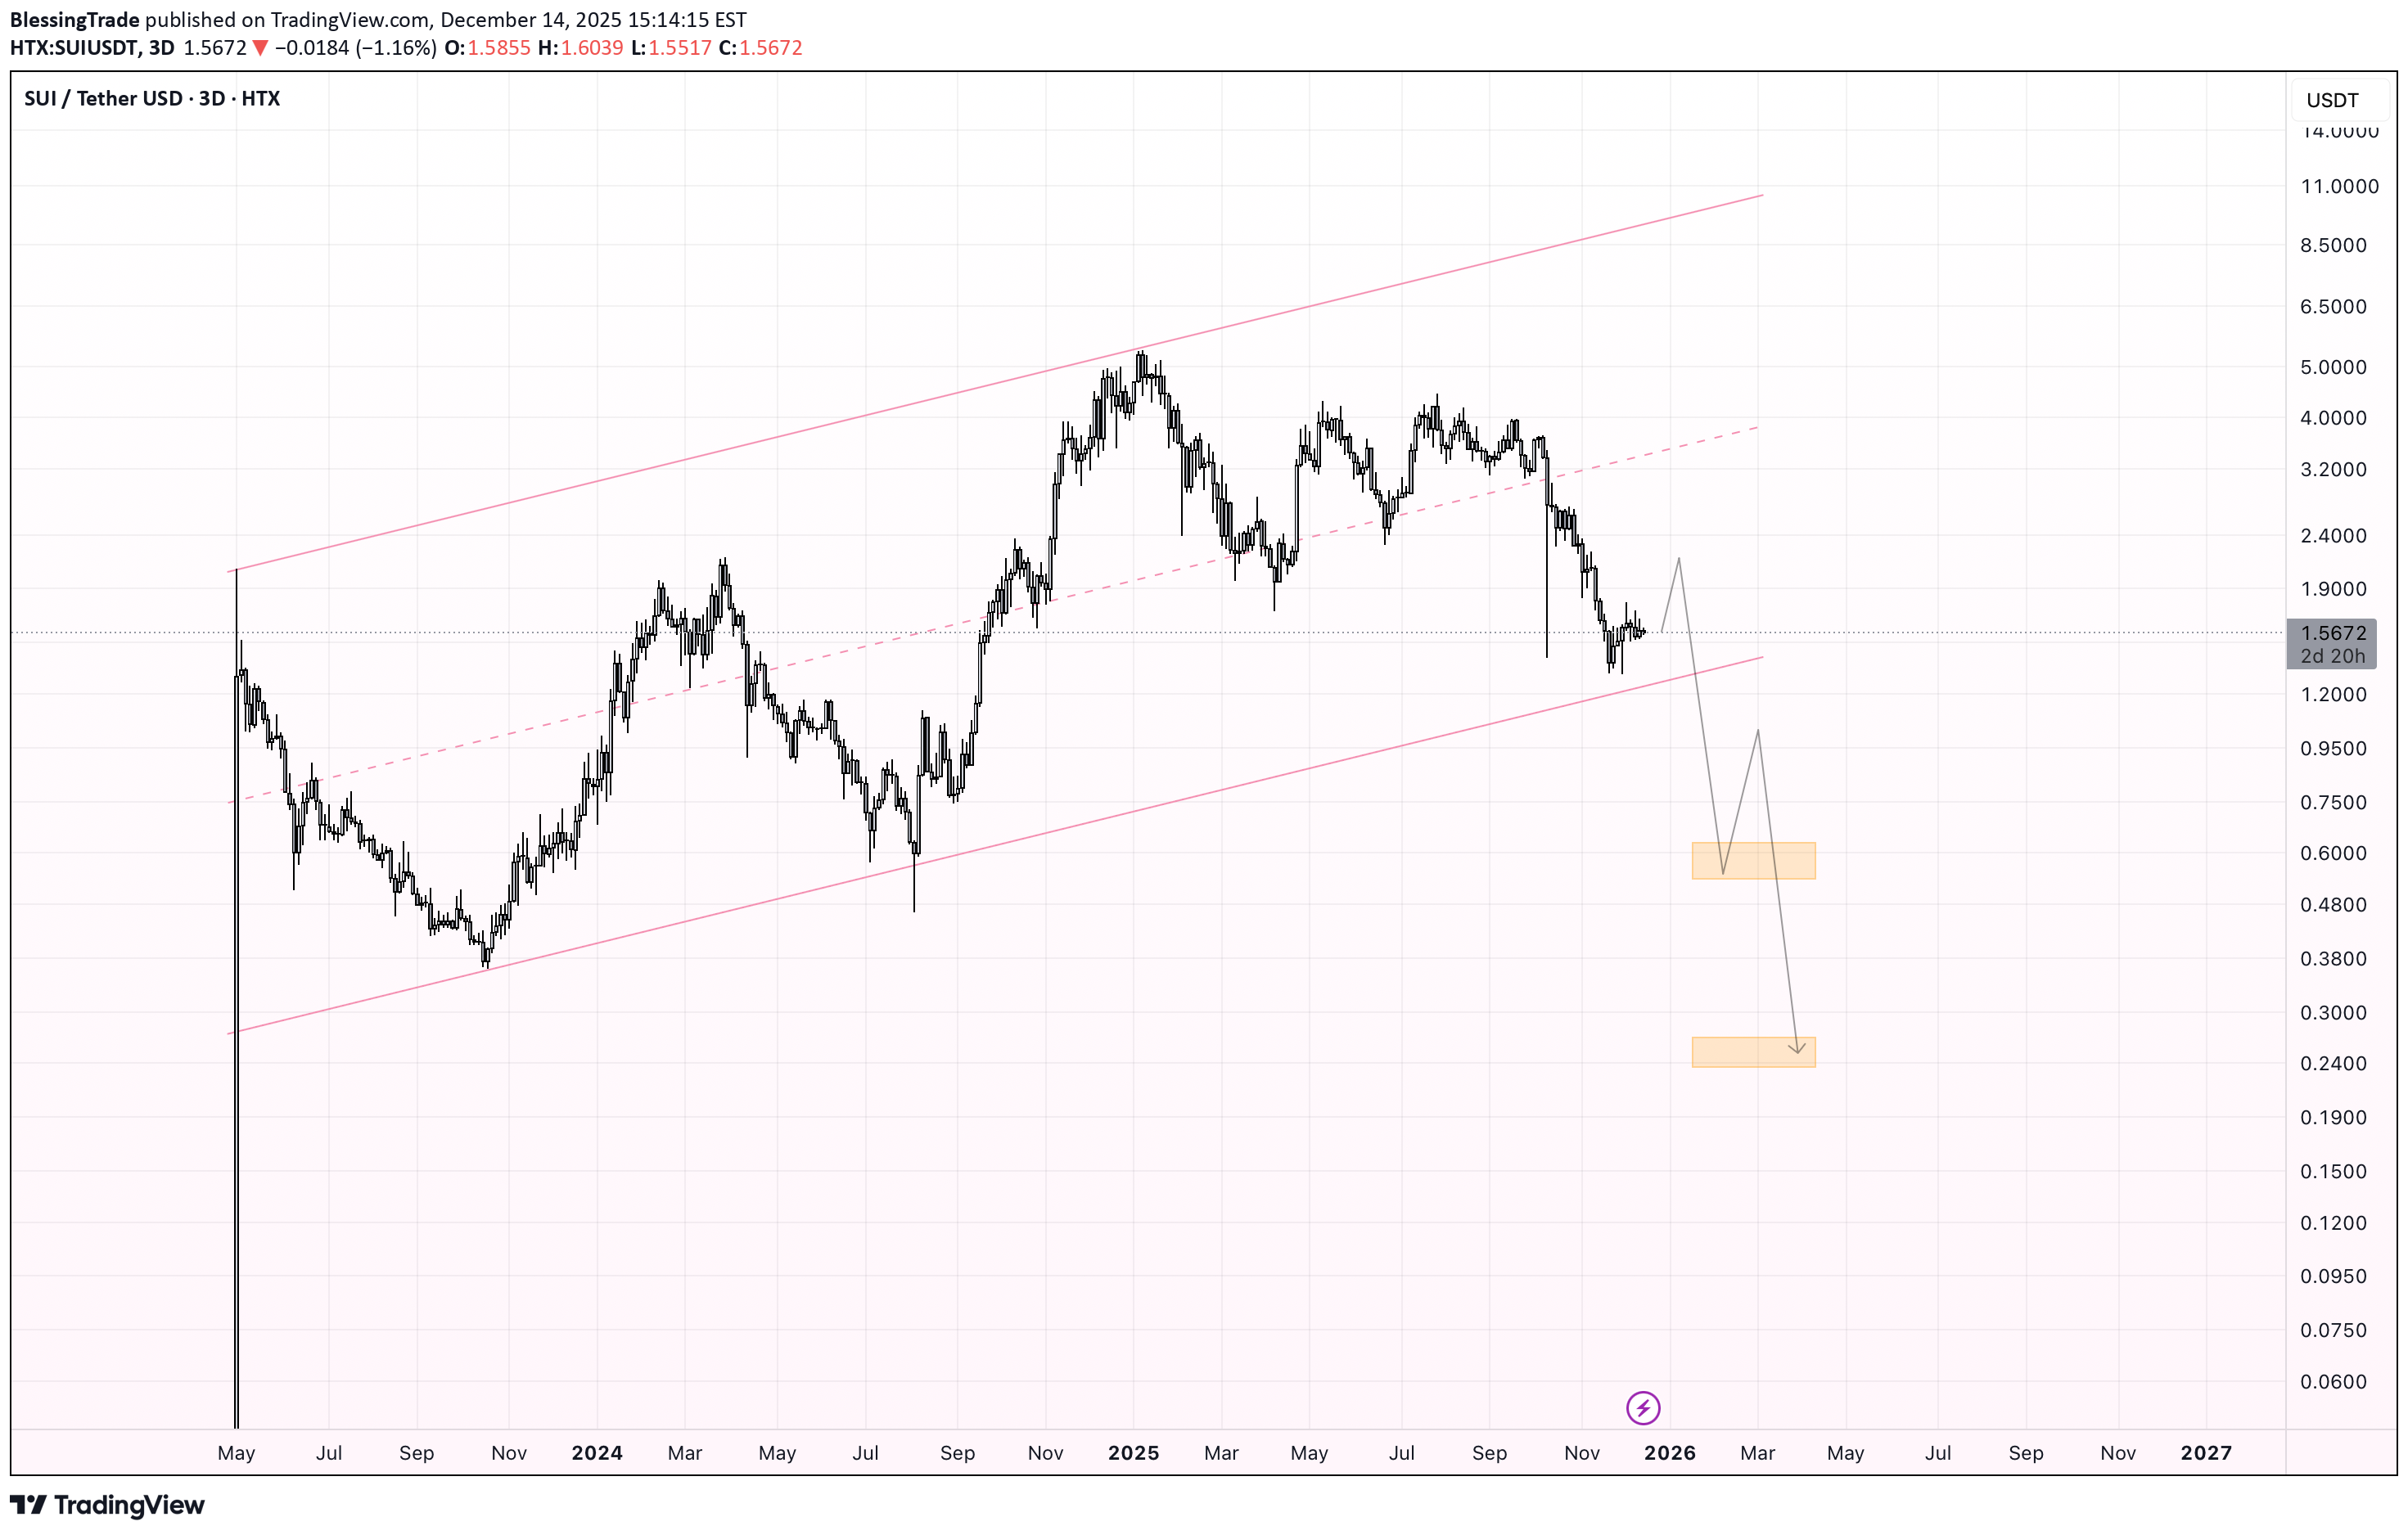
SUI has been moving inside a well-defined rising channel on the higher timeframe, forming higher highs and higher lows. However, price is now trading near the lower boundary of the channel , showing signs of weak momentum and potential breakdown. Historically, a loss of the rising channel support often leads to a deeper corrective move, especially after an extended uptrend. Current structure suggests that downside continuation is more likely before any sustainable bullish scenario. 📌 Key points: Long-term ascending channel Price approaching / losing channel support Increased risk of trend exhaustion and correction 🎯 Downside targets: Target 1: $0.60 Target 2: $0.25 🛑 Conclusion: At current levels, buying SUI is not attractive from a risk-reward perspective. A better strategy is to wait for deeper pullbacks and signs of stabilization near the mentioned targets before considering long positions. This is a patience trade — better prices are likely ahead.beaarrr run!!!
پرچم خرس محلی بیت کوین: سقوط به محدوده ۷۸ تا ۸۰ هزار دلار قطعی است؟
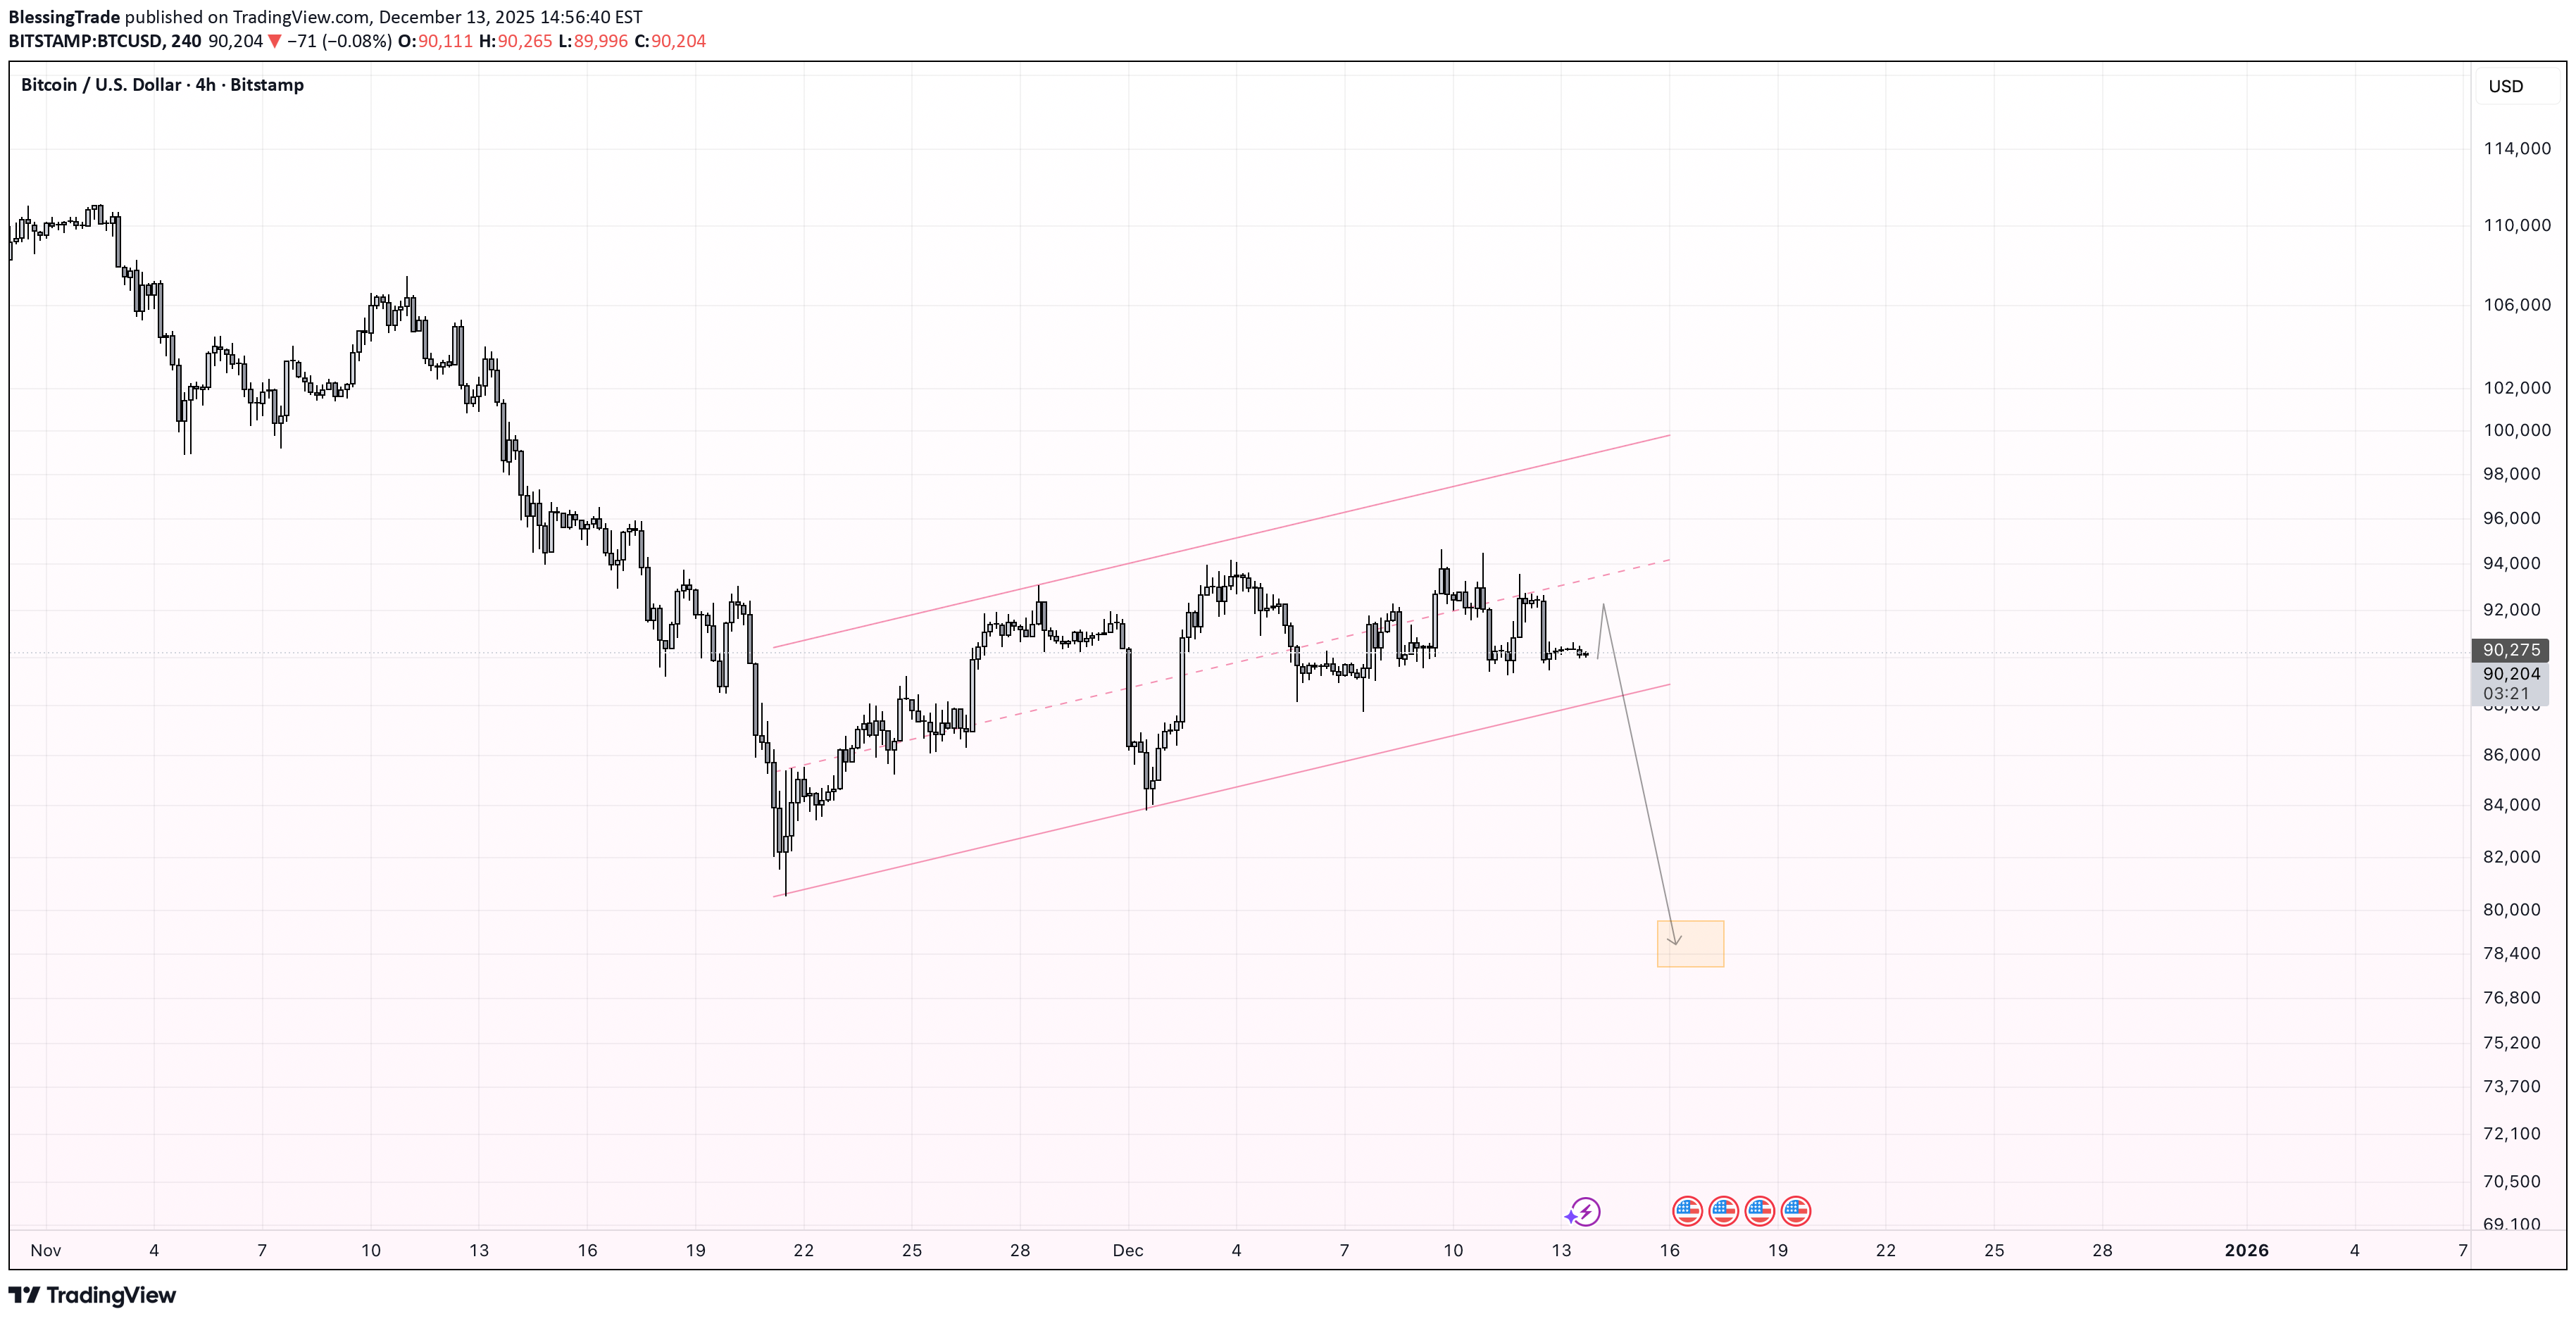
After a strong impulsive drop, price has formed a local bear flag — an ascending corrective channel within a broader bearish move. Price action inside the channel looks corrective, with no clear signs of strong demand. I expect a breakdown from the flag to the downside and continuation of the bearish move in the short term. Downside target: $78,000 – $80,000 As long as price remains below the upper boundary of the flag and fails to break out to the upside, the bear flag scenario remains valid.86k$ helloBOOOM!!! beaarrr run!!!
تحلیل NEAR: شکست ساختار بازار در محدوده نزولی و اهداف احتمالی قیمت
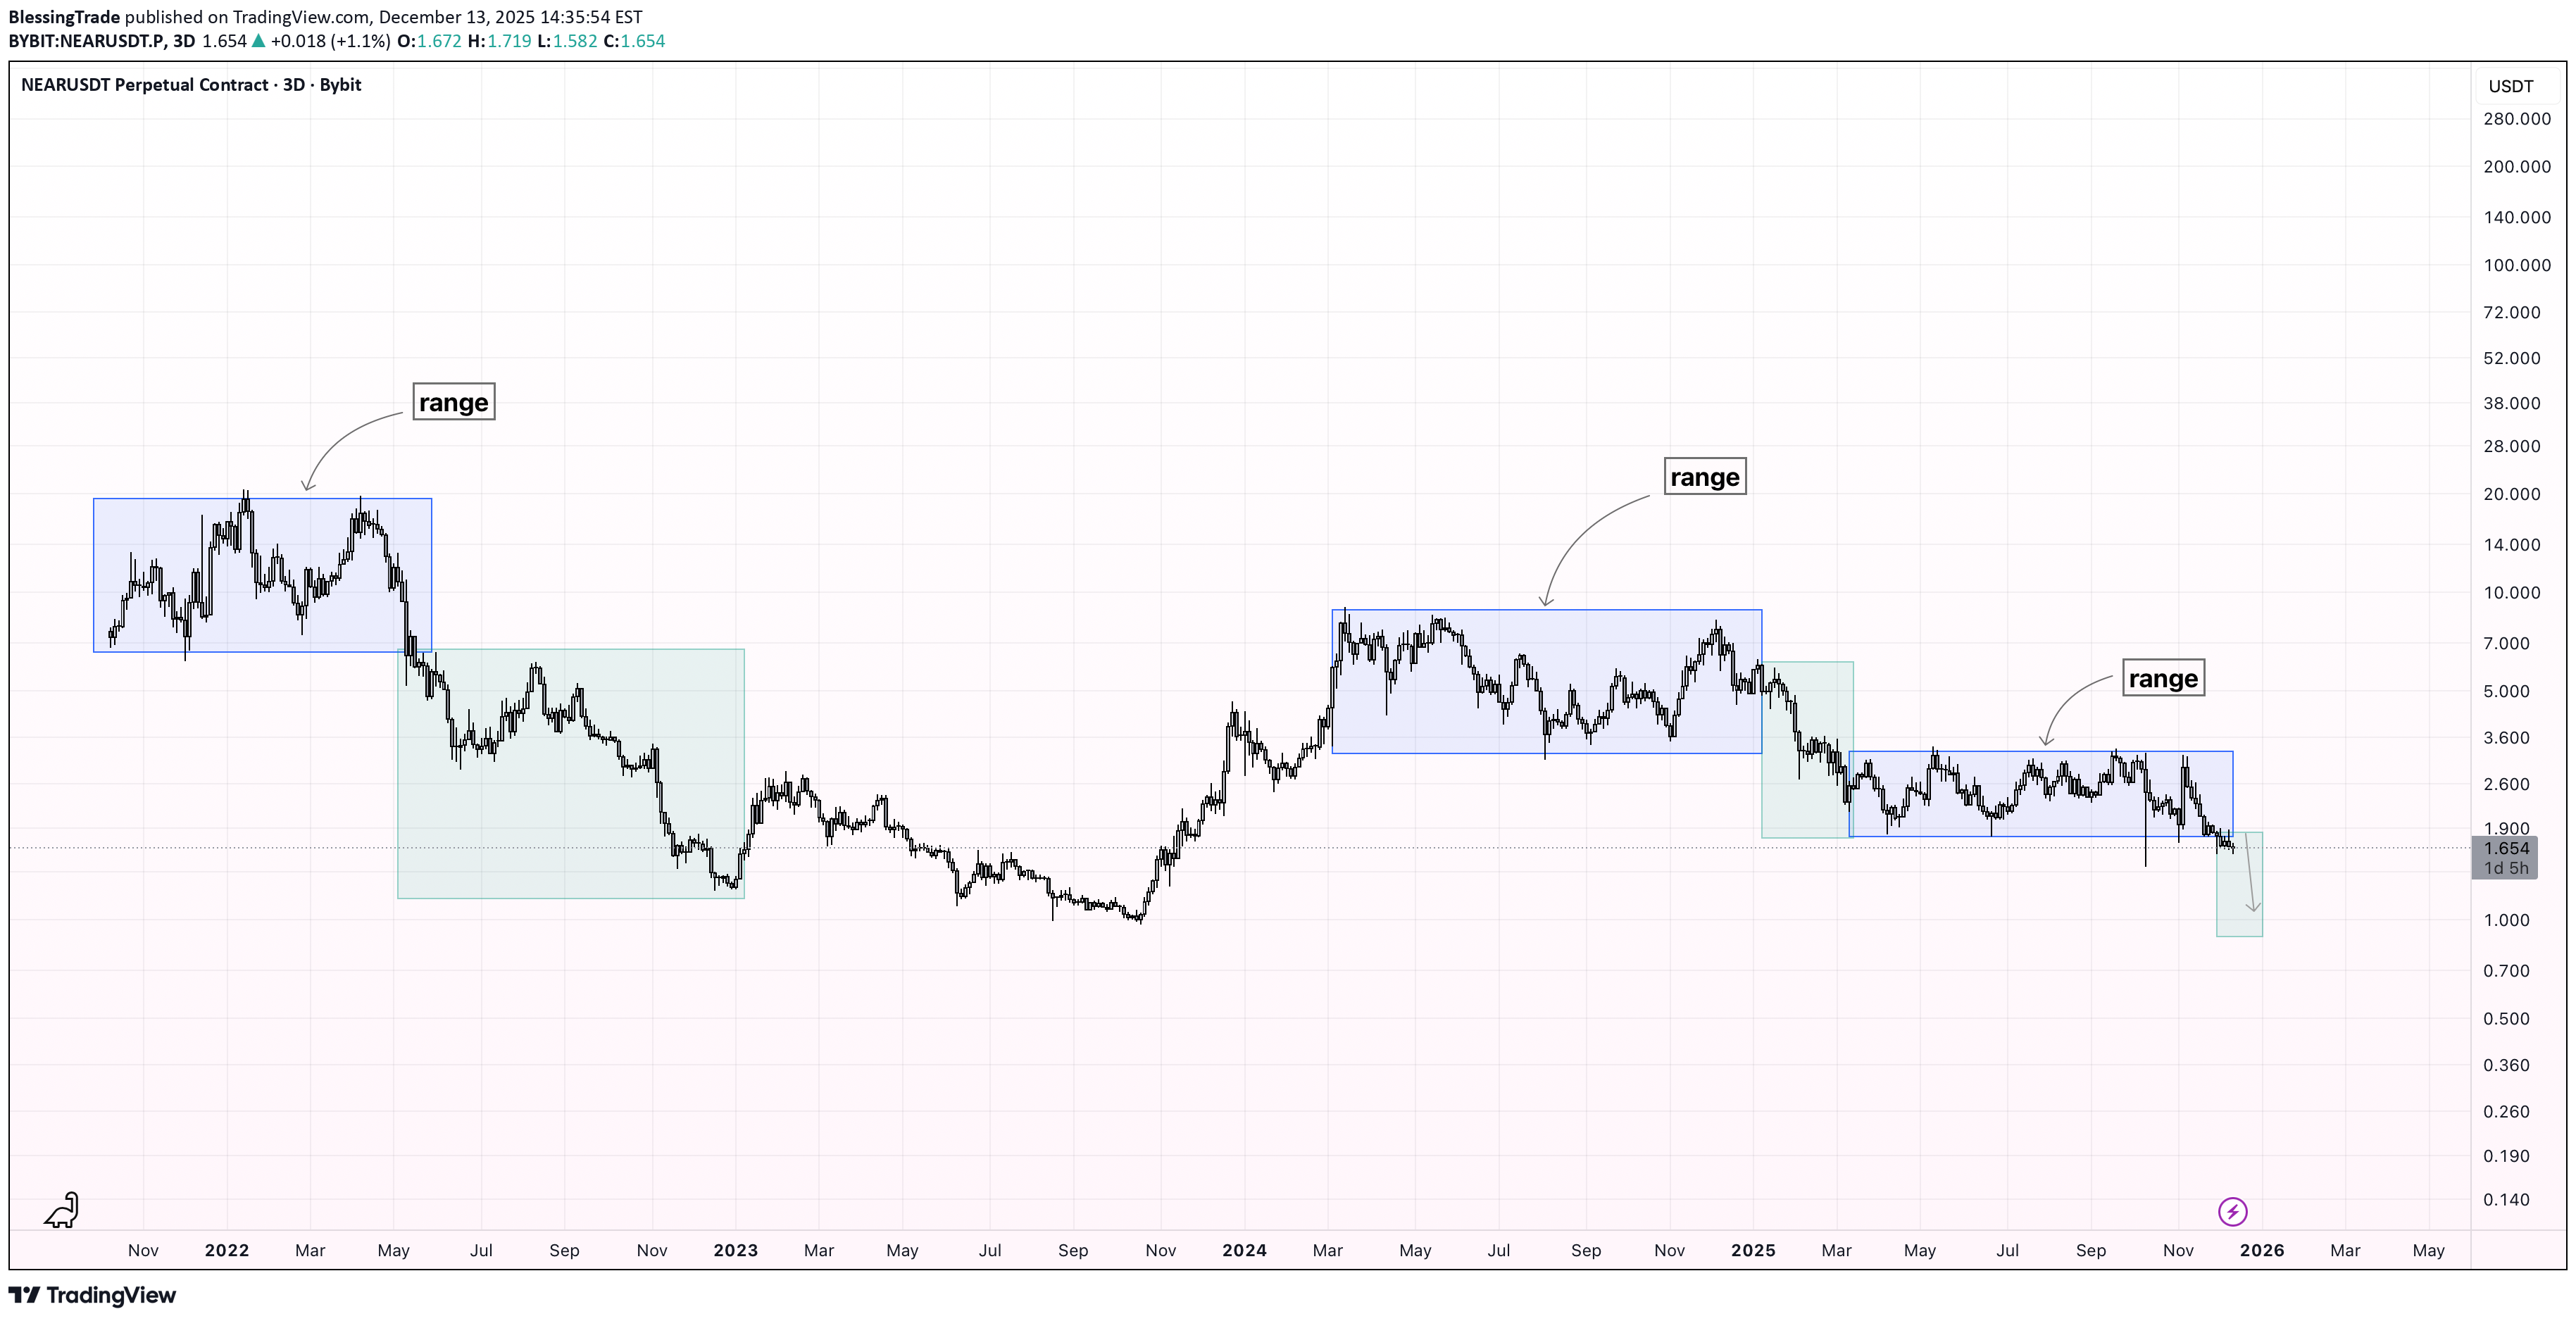
Price action is predominantly range-bound. Throughout the chart, price forms clear consolidation ranges, followed by directional moves after range breakouts. Currently, the latest range has been broken to the downside, confirming bearish continuation. Structure remains weak below former range support, which is now acting as resistance. Expectation: continuation of the downside move toward the following levels: $1.25 $1.00 $0.90 As long as price stays below the broken range, bearish bias remains valid.beaarrr run!!! DOWN!!!!
Disclaimer
Any content and materials included in Sahmeto's website and official communication channels are a compilation of personal opinions and analyses and are not binding. They do not constitute any recommendation for buying, selling, entering or exiting the stock market and cryptocurrency market. Also, all news and analyses included in the website and channels are merely republished information from official and unofficial domestic and foreign sources, and it is obvious that users of the said content are responsible for following up and ensuring the authenticity and accuracy of the materials. Therefore, while disclaiming responsibility, it is declared that the responsibility for any decision-making, action, and potential profit and loss in the capital market and cryptocurrency market lies with the trader.