
LINK
Chainlink
| تریدر | نوع سیگنال | حد سود/ضرر | زمان انتشار | مشاهده پیام |
|---|---|---|---|---|
 LingridRank: 854 | فروش | حد سود: تعیین نشده حد ضرر: تعیین نشده | 17 hour ago | |
 paullefebre92Rank: 19676 | خرید | حد سود: تعیین نشده حد ضرر: تعیین نشده | 12/18/2025 | |
 Richtv_officialRank: 29646 | خرید | حد سود: تعیین نشده حد ضرر: تعیین نشده | 12/4/2025 | |
 SwallowAcademyRank: 30684 | خرید | حد سود: تعیین نشده حد ضرر: تعیین نشده | 12/16/2025 | |
 WaveRiders2Rank: 30639 | خرید | حد سود: تعیین نشده حد ضرر: تعیین نشده | 12/4/2025 |
Price Chart of Chainlink
سود 3 Months :
خلاصه سیگنالهای Chainlink
سیگنالهای Chainlink
Filter
Sort messages by
Trader Type
Time Frame
Lingrid
Lingrid | LINKUSDT Trend Continuation After Pullback Phase
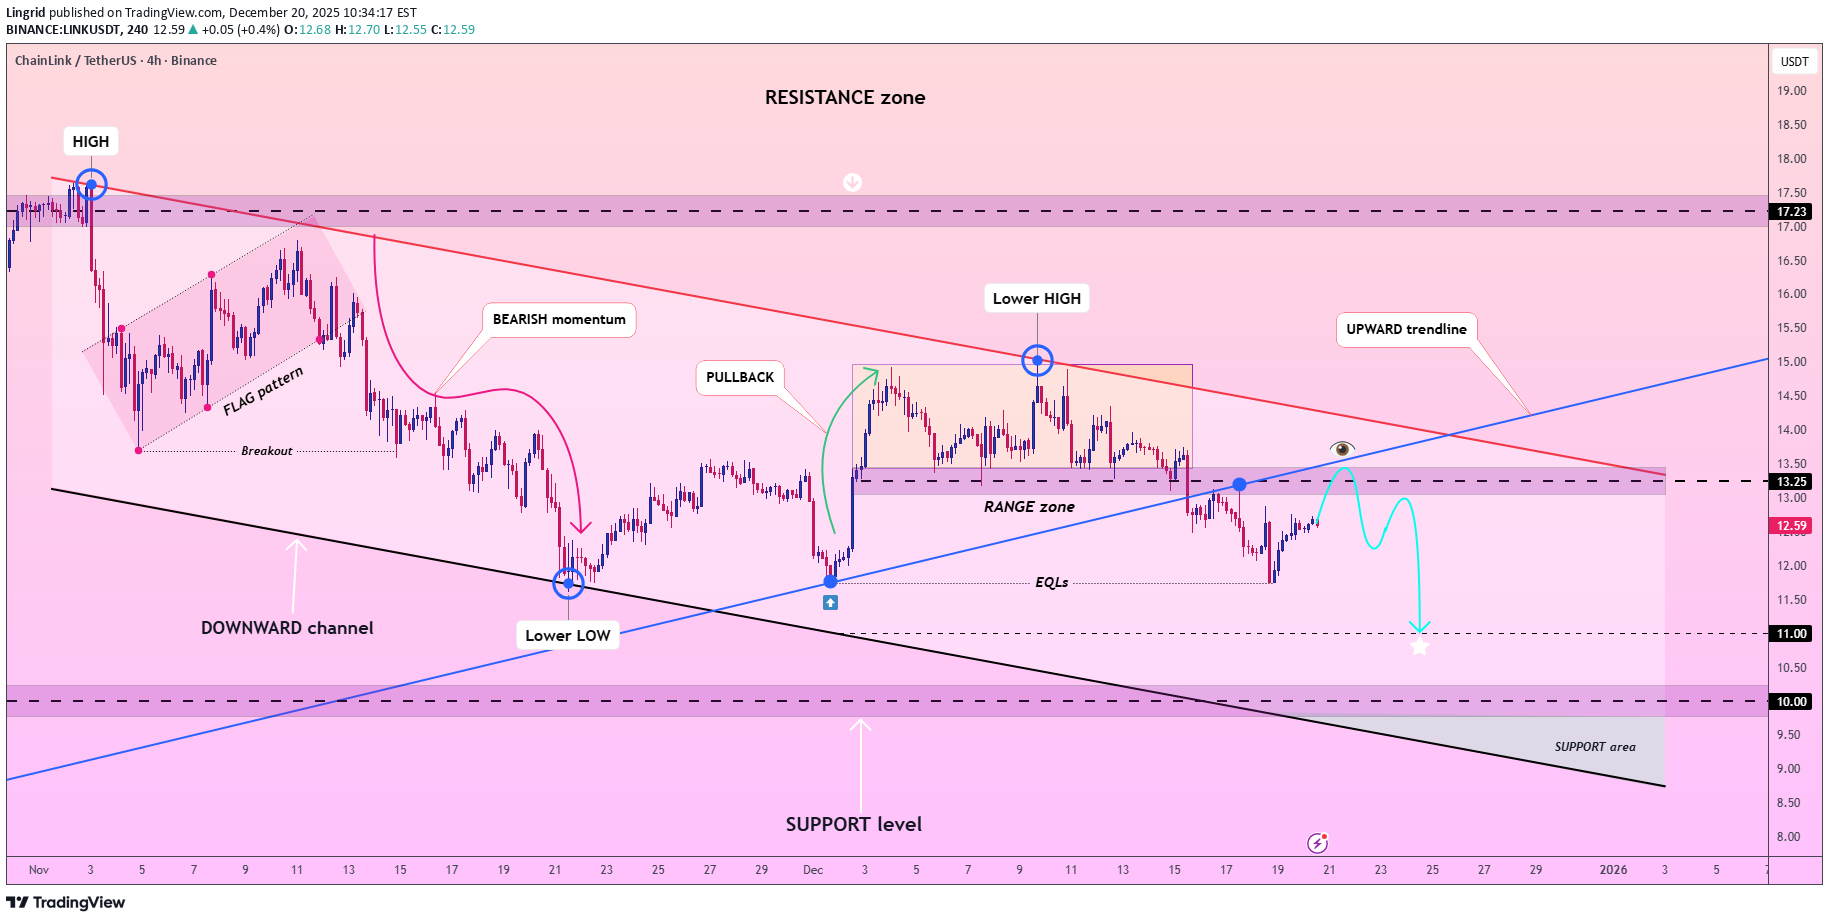
LINKUSDT remains locked beneath a declining resistance line, with recent rebounds failing to shift the broader bearish framework. Price has reacted weakly from the prior support flip zone, turning it into overhead supply where sellers continue to absorb upside attempts. The structure still reflects distribution rather than accumulation, keeping downside risk active. If it stays capped below the 13.5 supply band, the market may roll over again toward the 11.0 support area, where previous liquidity rests. That zone could act as a temporary pause, but continued rejection above favors extension rather than reversal. ➡️ Primary scenario: rejection below 13.5 → continuation toward 11.0. ⚠️ Risk scenario: a firm close above 13.5 could neutralize the bearish setup and open room toward 14.5. If this idea resonates with you or you have your own opinion, traders, hit the comments. I’m excited to read your thoughts!

LINK Defends Demand. Structure Shifts Into Controlled Recovery
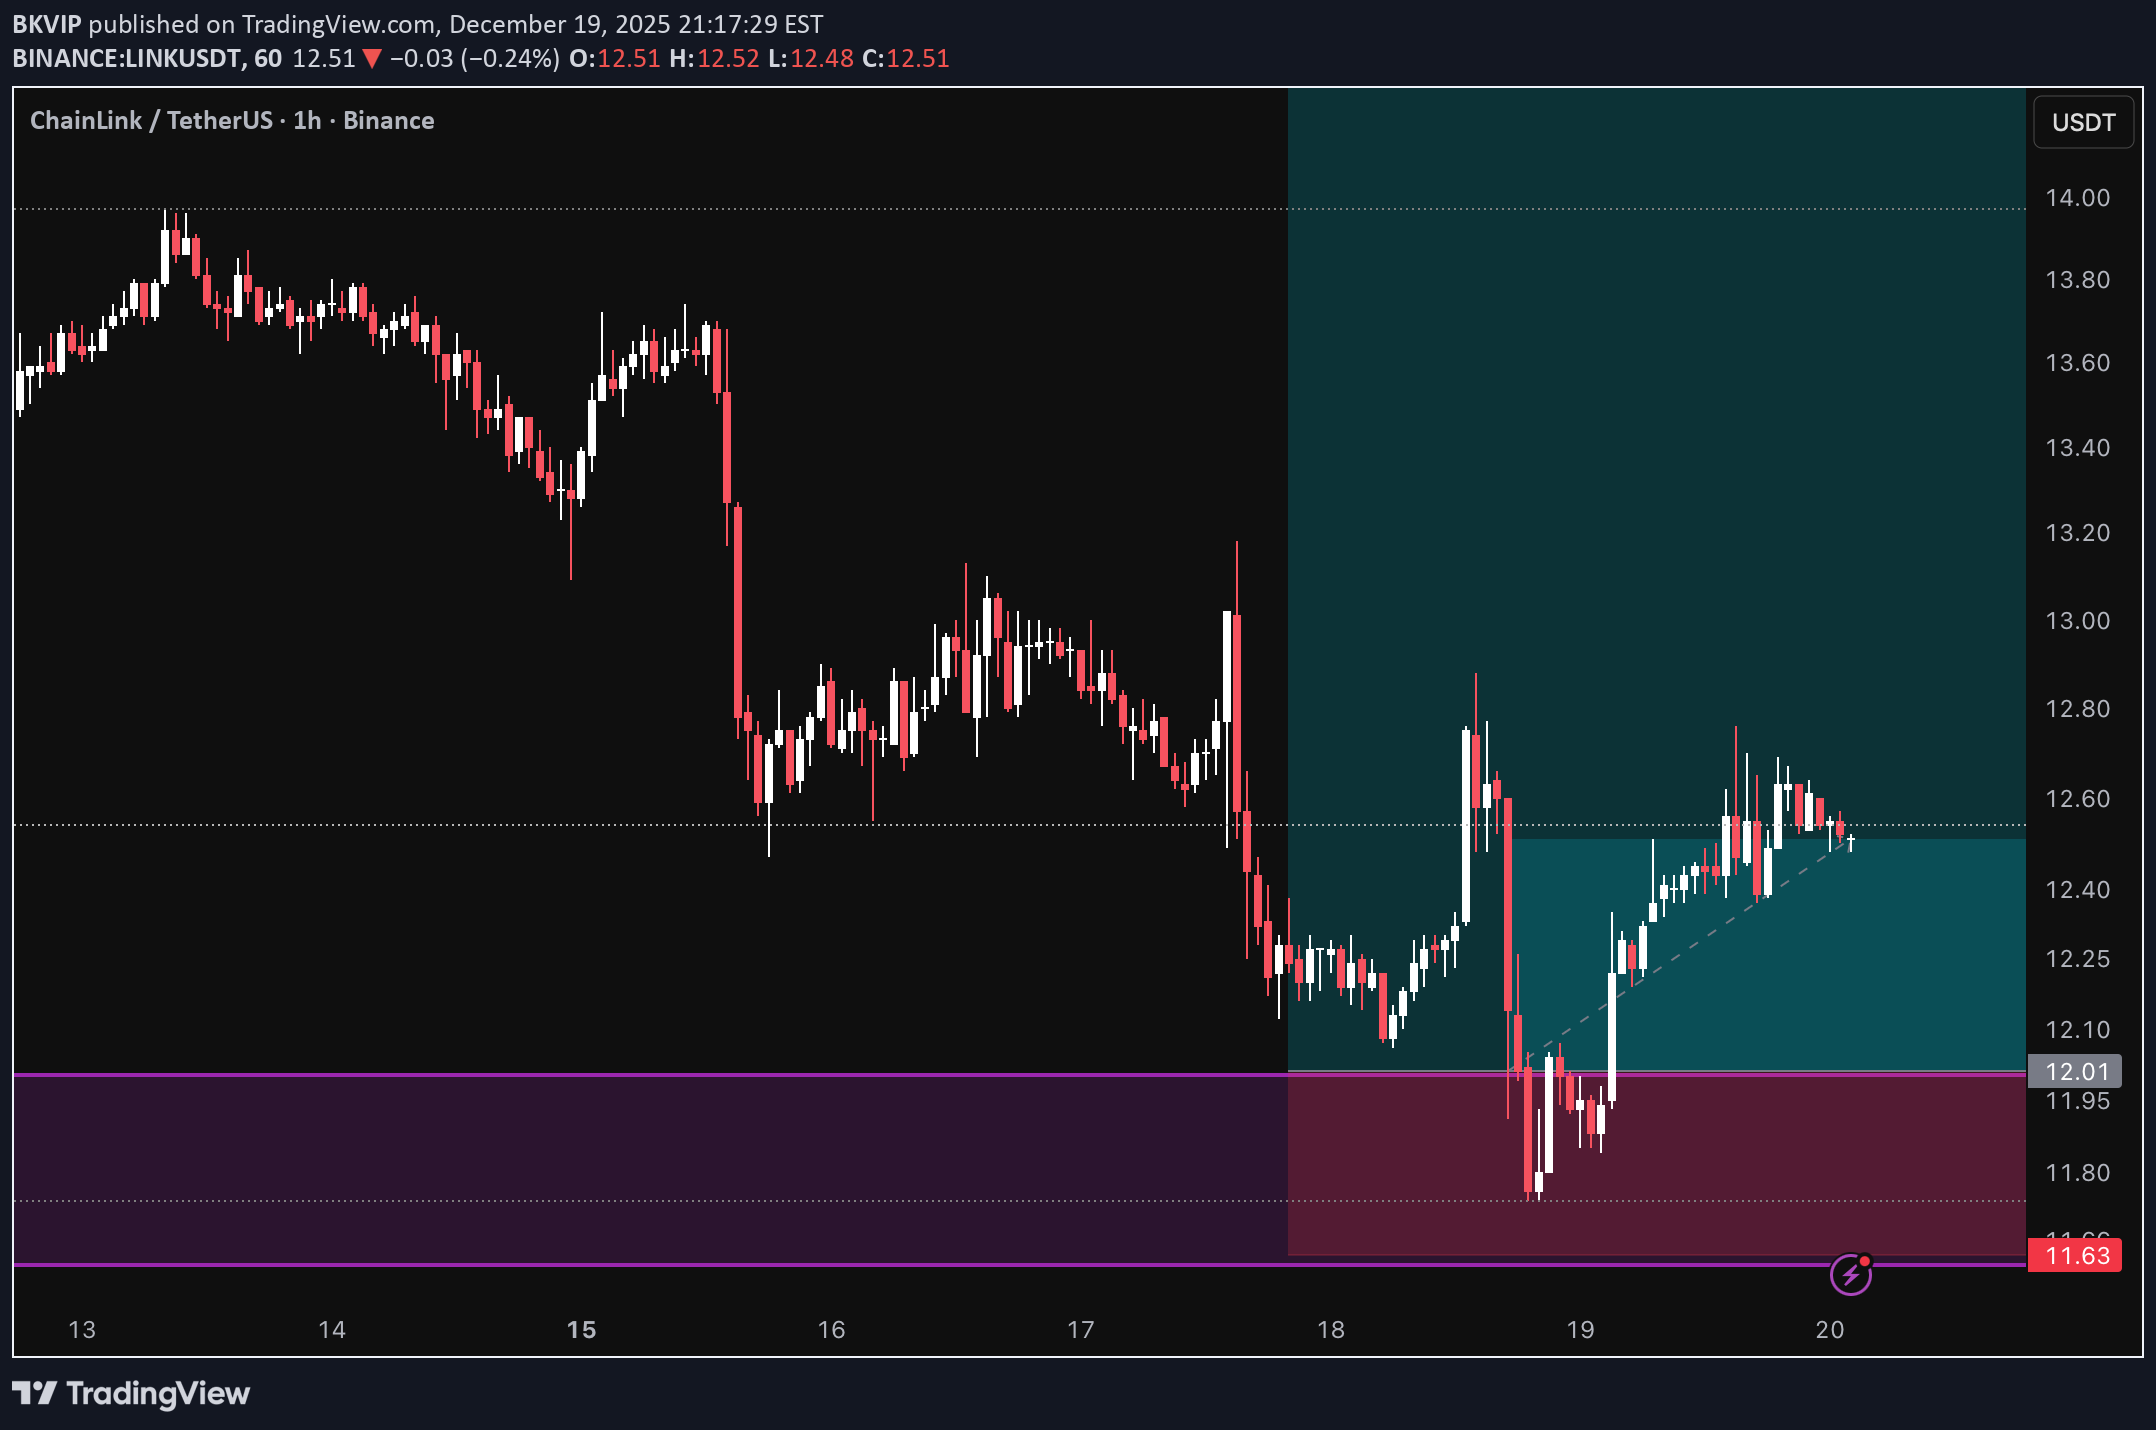
LINK experienced a sharp sell-off into a well-defined demand area, where price was aggressively absorbed. The reaction from this zone was immediate, signaling that sellers exhausted momentum once liquidity was taken below structure. Following the rebound, price transitioned into a controlled recovery with higher lows forming on the lower timeframe. This behavior suggests a shift from impulsive downside into stabilization, with buyers gradually reclaiming control rather than chasing price. As long as price continues to respect the reclaimed structure above demand, the context favors consolidation and potential continuation. The focus remains on reaction quality and confirmation, not anticipation. This setup highlights how liquidity sweeps into demand often precede structured recoveries. Structure first. Price follows.

Cryptojobs
$LINK - price update:
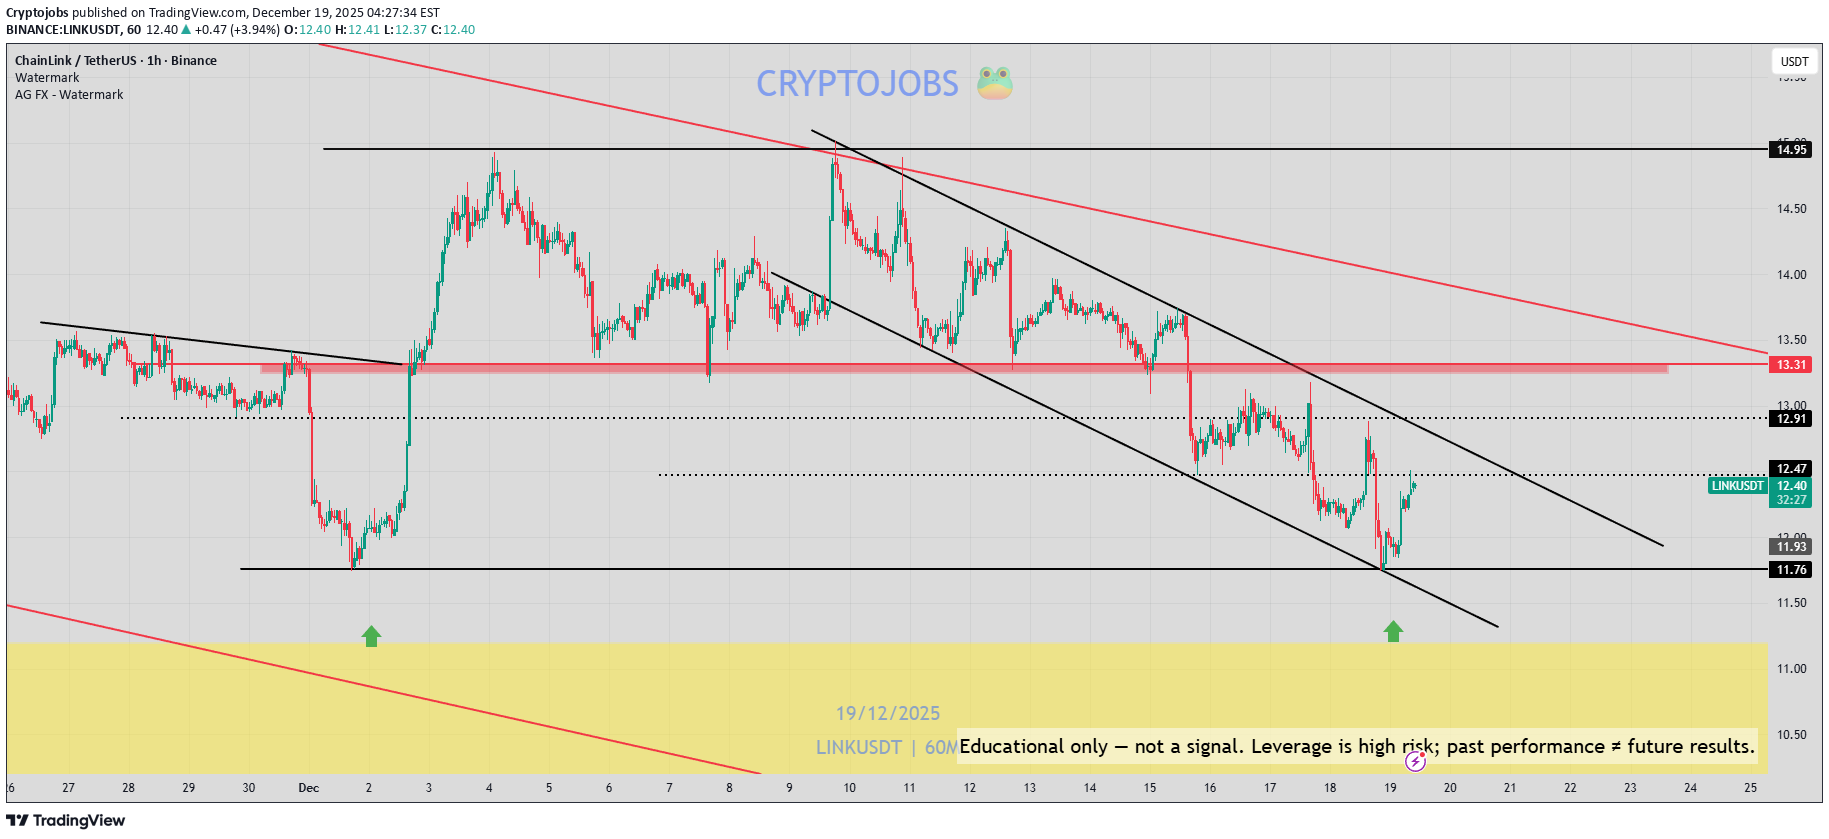
LINK - price update: Weekly demand zone is holding well. Current price remains bearish (weekly & daily), but a triple bottom is possible at $ 11.80 .. The reality: Support is holding for now, but momentum remains pretty bearish inside the downtrend channel... 📉 Key levels: 🎯 $ 11.00 🎯 $ 10.20 🎯 $ 11.70 🎯 $ 13.30 🎯 $ 14.70
paullefebre92
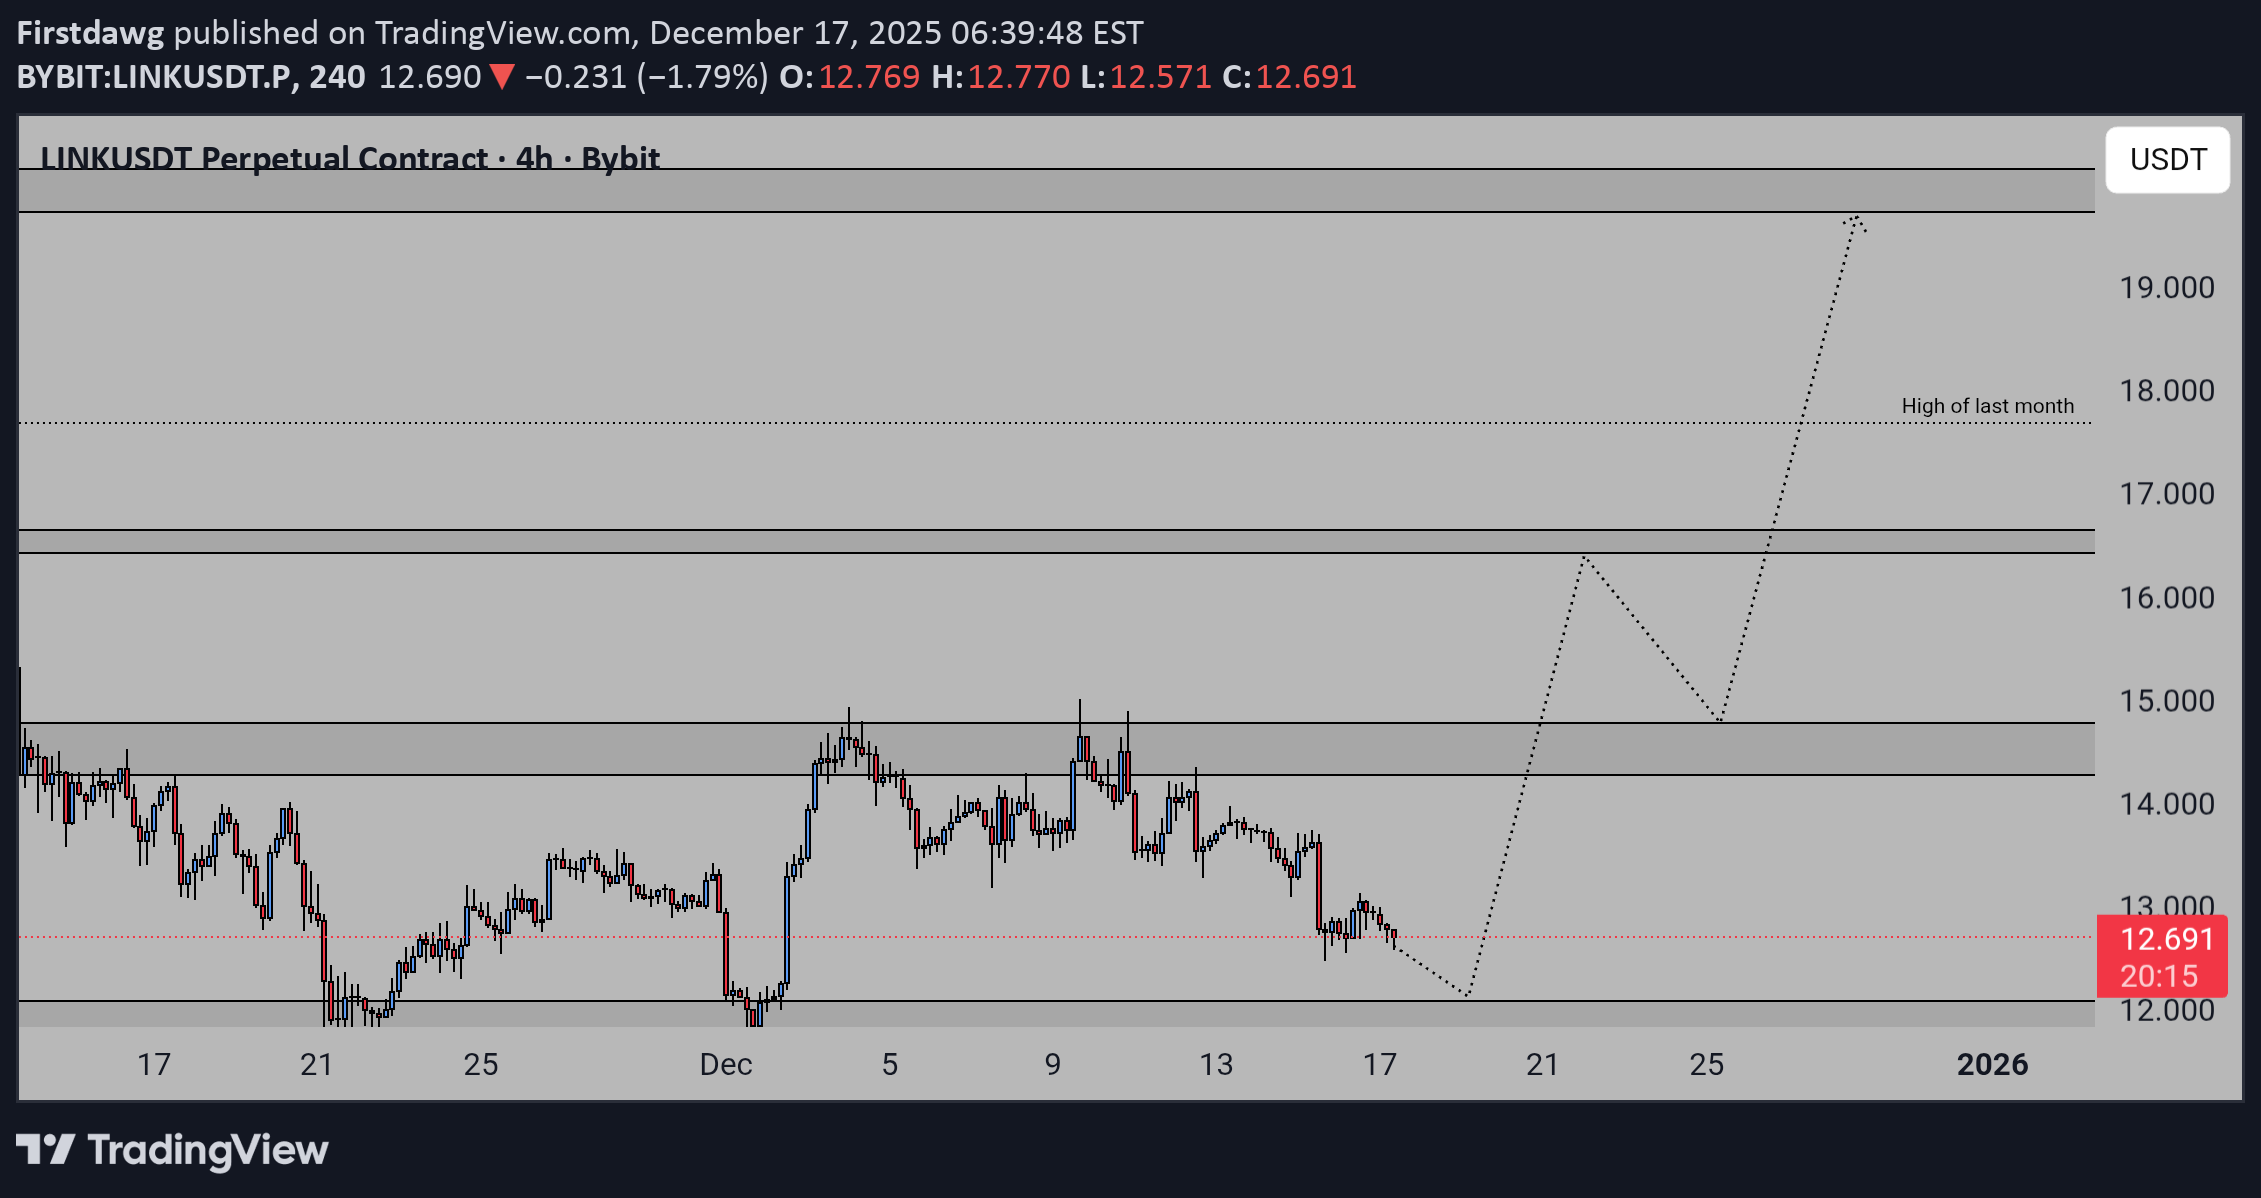
حرکت بعدی لینک/تتر (LINK/USDT): شانس خرید بزرگ با اهداف تا ۲۱ دلار!
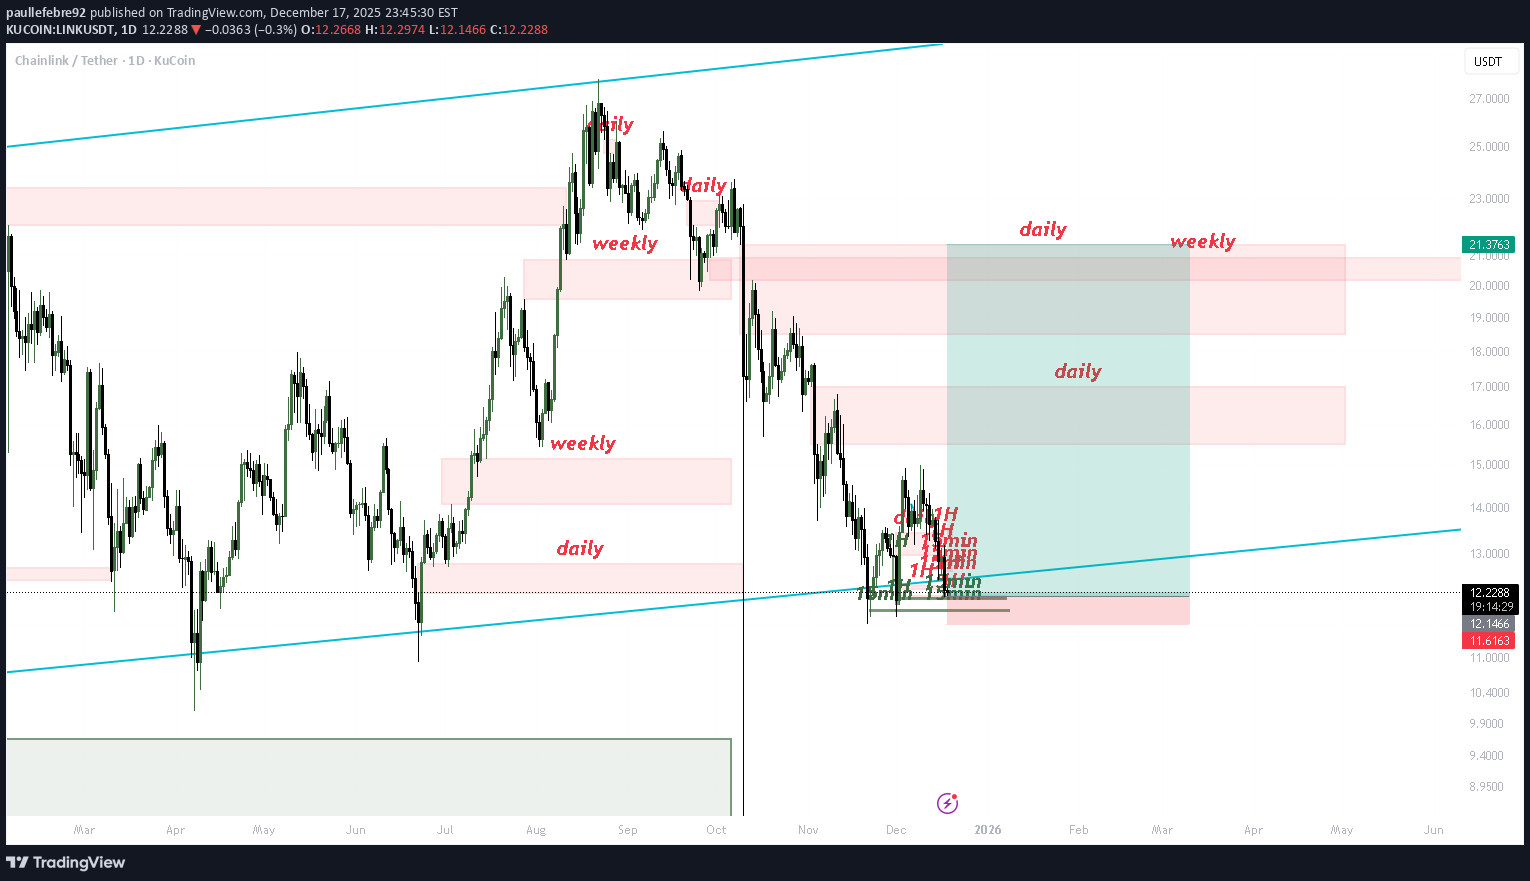
📌 Summary in English The chart displays LINK/USDT on the 1D timeframe with multiple supply and demand zones. The price is retesting a daily demand area and ascending trendline support. A long setup is projected with a stop-loss below the 11.16$ level and targets placed at daily/weekly supply zones up to approximately 21.3$. The setup suggests a favorable risk-to-reward ratio based on a potential bounce from the current support. LINKUSDT

MrWhale
Chainlink (LINK) Daily Setup – Retesting Key Support
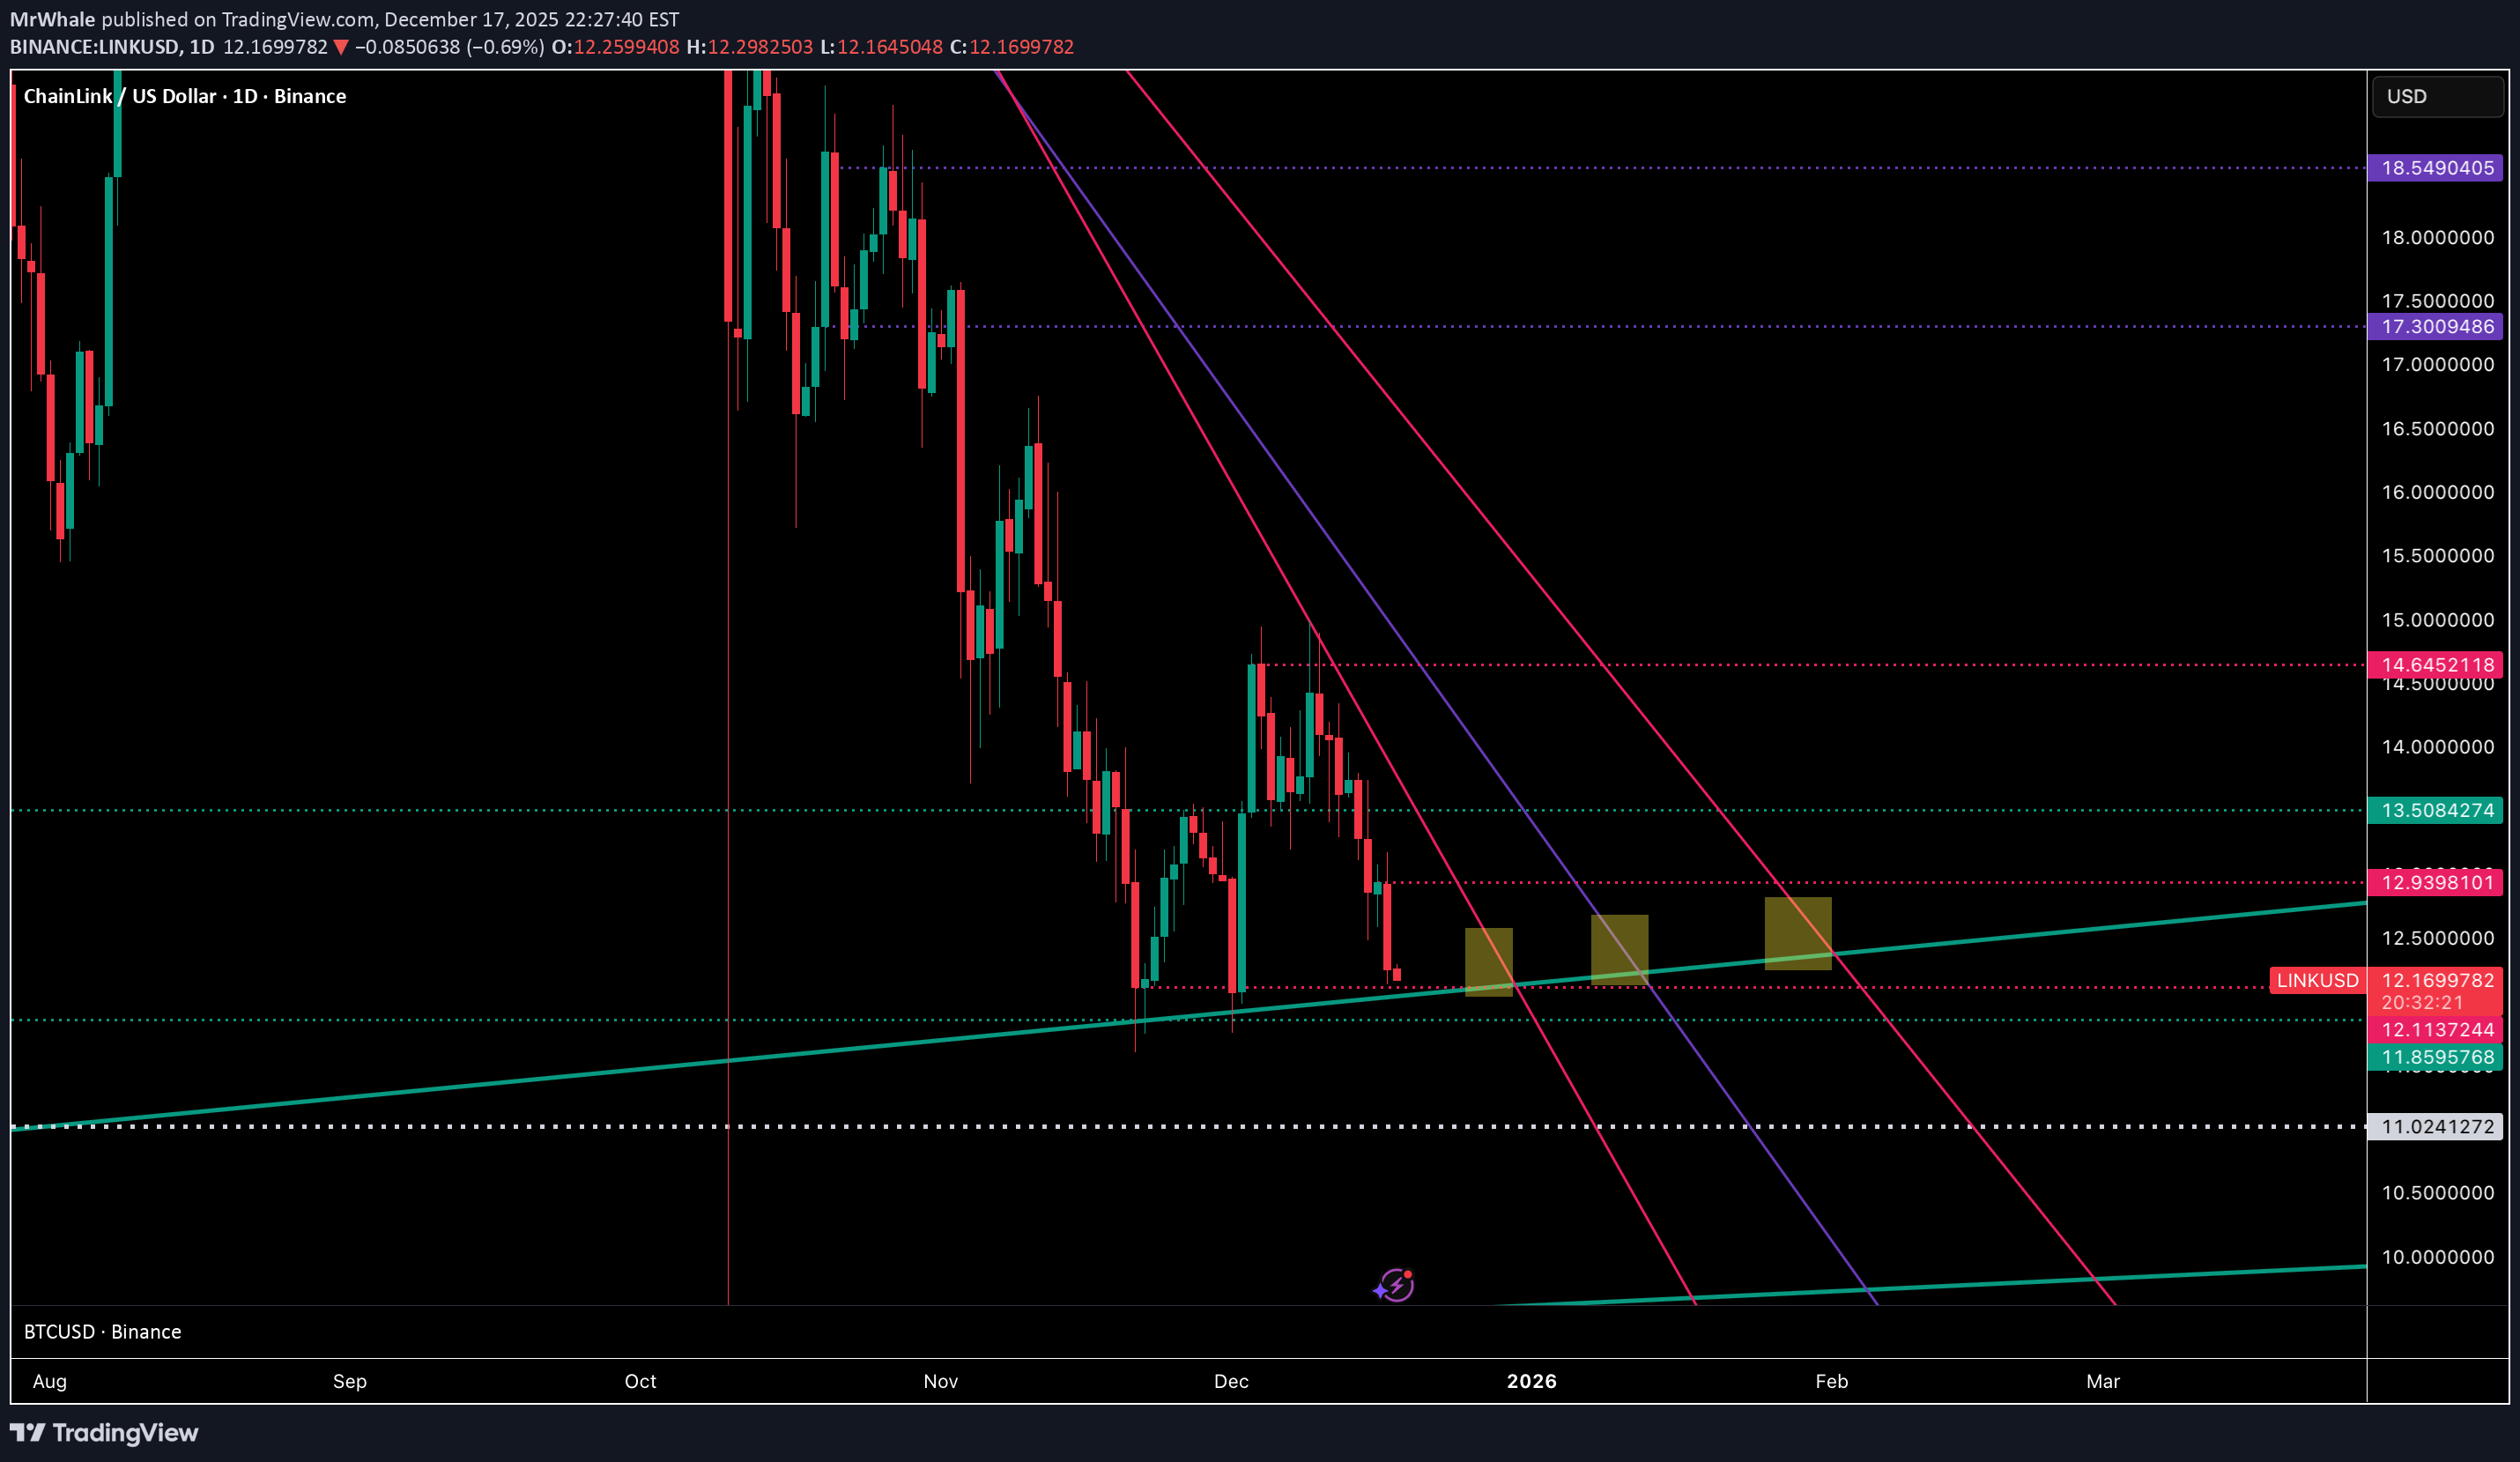
**Chainlink (LINK) Daily Setup – Retesting Key Support** Chainlink is currently retesting its 3-month support zone on the daily timeframe as price approaches a local apex, potentially resolving late December or early January. **Bullish Outlook** - Hoping for a successful hold and bounce from this 3-month level. - A strong defense here could lead to upside resolution as the apex tightens. **Bearish Risks** - Watching closely for daily candle closes below the 3-month support. - The more consecutive daily closes below, the higher the probability of breakdown. - Invalidation of the support could open significant downside, targeting as low as **$10**. - Additional monthly support sits around **$11**, which could come into play on a deeper pullback if the current 3-month region is lost. **Key Levels to Monitor** - Immediate support: 3-month daily zone - Downside targets: $10 (major low), $11 (monthly support) Staying vigilant for confirmation of hold vs. breakdown in the coming sessions.

HoneySpotTrading
LINKUSDT-Supply Pressure Dominates Bearish Continuation in Focus
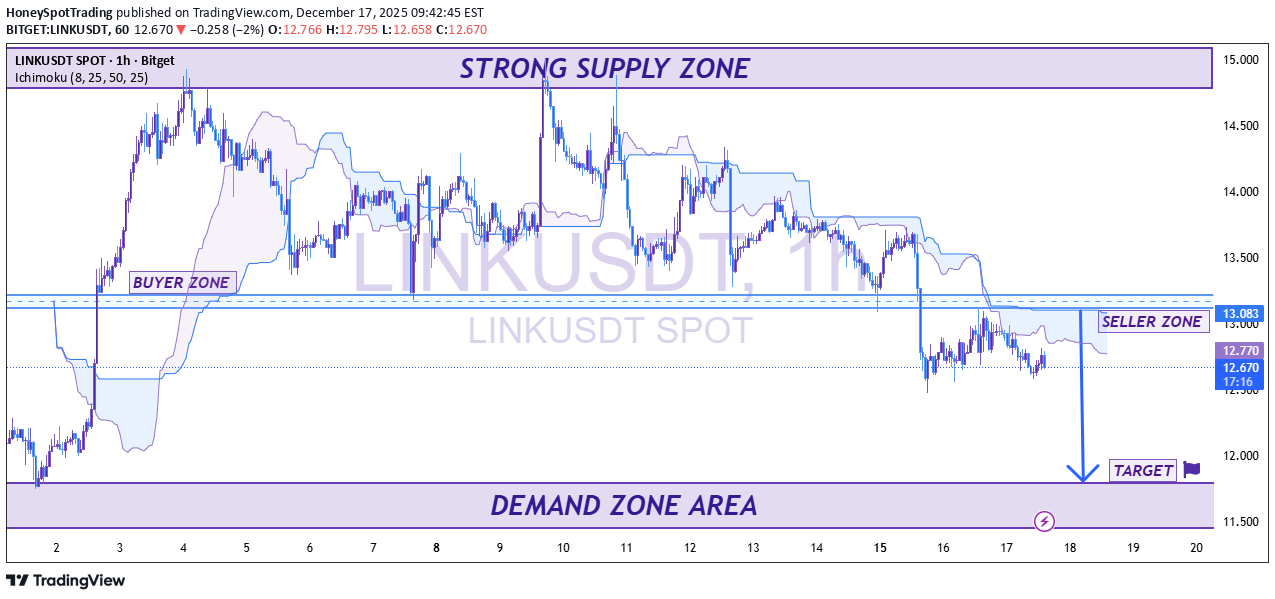
LINKUSDT on the 1-hour timeframe remains under strong bearish pressure after repeated rejections from a clearly defined strong supply zone near the upper range. Price has transitioned into a sequence of lower highs and lower lows, confirming bearish market structure. The previous buyer zone has failed to hold, turning into a seller zone, which is now acting as resistance around the 13.00–13.10 area. Price is also trading below the Ichimoku cloud, reinforcing downside momentum and indicating sellers remain in control. As long as LINK stays below this seller zone, the probability favors a continuation move toward the major demand zone near the 12.00 area, which is marked as the primary downside target. A strong reaction from this demand zone will be critical to assess whether buyers step back in or if further downside opens up. 🔍 Key Levels to Watch: Resistance / Seller Zone: 13.00 – 13.10 Current Bias: Bearish below resistance Downside Target: 12.00 (Demand Zone Area) ⚠️ A sustained reclaim above the seller zone could invalidate the bearish outlook, but until then, rallies may be viewed as selling opportunities. What’s your view — will LINK respect the demand zone or break lower? Share your thoughts in the comments. — HoneySpotTrading
Buy Bias
If price fails to break below that Support then she should be expecting a push from that Support to the upside. That's my POV

BallaJi
LINK to 3 dollars -- Last exit before the elevator down.
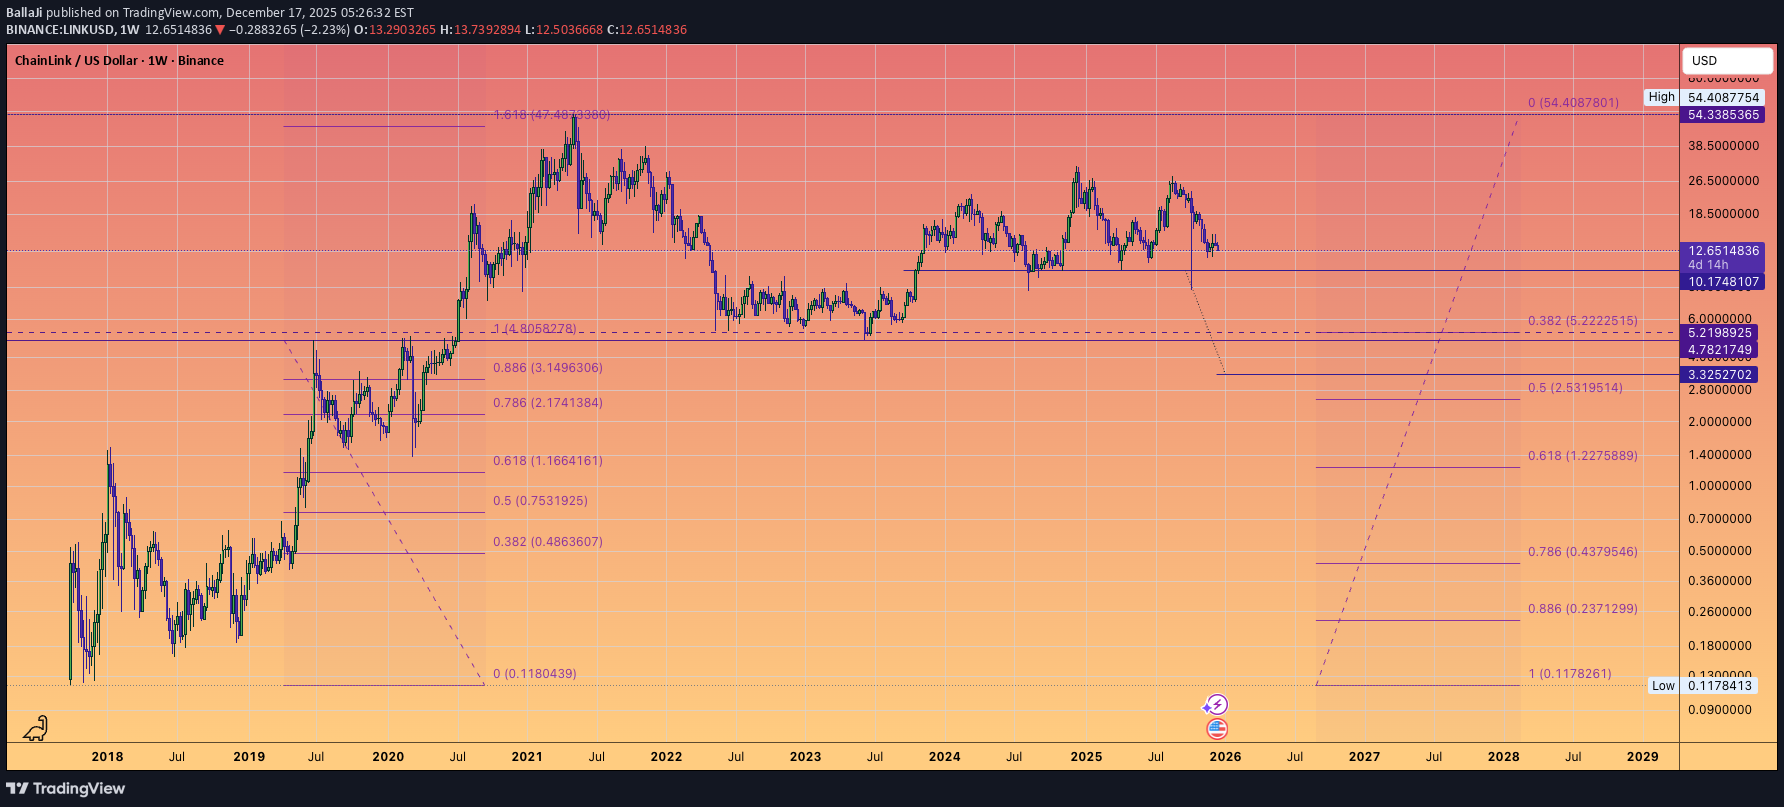
Chainlink is flashing a head and shoulders. It is looking to break the previous bear market lows. And there are fib retracement confluence projections that align with single digit prices.

KABHI_TA_TRADING
تحلیل تکنیکال LINK/USDT: پرچم خرسی فعال شد! هدف بعدی کجاست؟
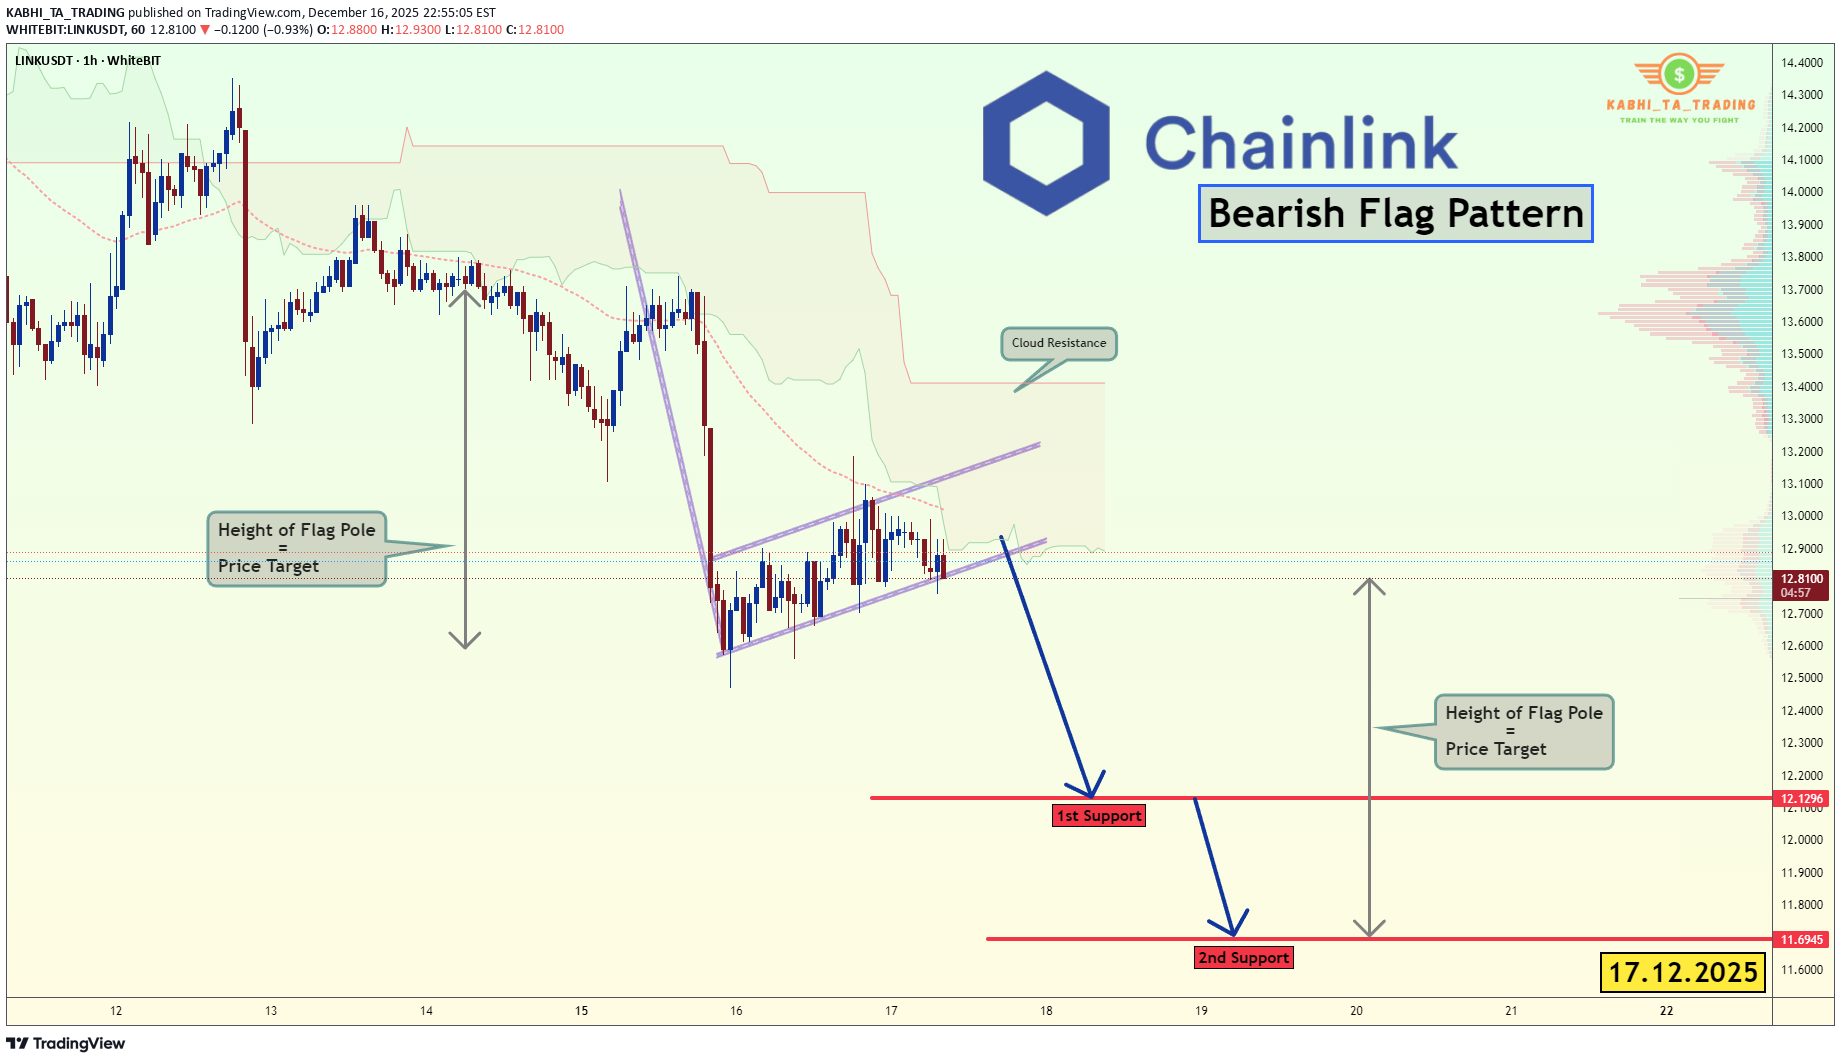
📝 Description🔹 Setup LINKUSDT LINK/USDT formed a classic Bearish Flag pattern after a strong impulsive drop (flagpole). Price is now consolidating inside a rising channel, but remains below Ichimoku Cloud resistance and key EMAs — signaling weak bullish momentum. As long as price stays below the flag resistance, bearish continuation remains the higher probability. 📌 Trading Plan Primary Bias: 🔴 Bearish continuation Watch for flag breakdown confirmation below minor support Momentum confirmation = strong bearish candle close 🔴 1st Support: 12.12 🔴 2nd Support (Flag Target): 11.69 Measured Move: Flagpole height projection aligns with lower target #LINKUSDT #Chainlink #CryptoTrading #BearishFlag #PriceAction #TechnicalAnalysis #CryptoMarket #TradingView #Altcoins #Kabhi_TA_Trading ⚠️ Disclaimer This analysis is for educational purposes only. Crypto markets are highly volatile — always use proper risk management and stop-loss. ❤️ Support the Work 👍 Like if this setup makes sense 💬 Comment your LINK view (bullish or bearish? ) 🔁 Share to help more traders learn Your support keeps these breakdowns coming 🙌
SwallowAcademy
Chainlink (LINK): Expecting Good Recovery | Bounce From Support
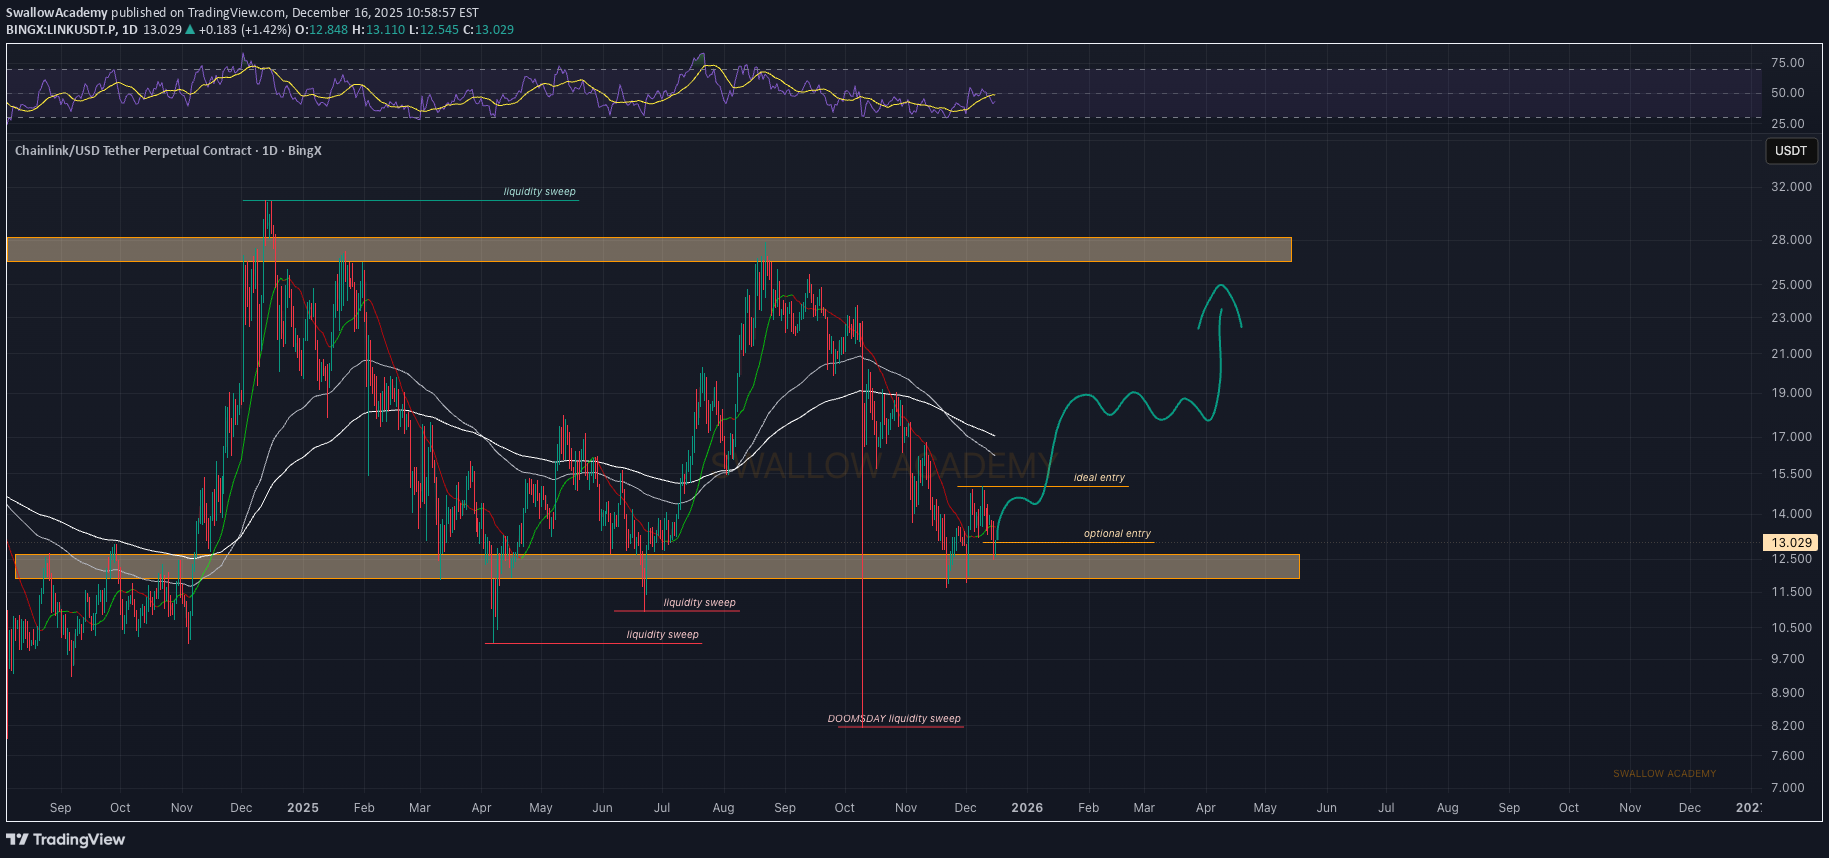
LINK is still stuck inside that sideways range and price is sitting right on the support zone again. Looking at the last times we had liquidity sweeps into this area, price gave a decent bounce, so that’s the main thing I’m watching here. Ideal entry for me is once buyers break and hold above the ~$15 area. Optional entry is from current price if you’re fine taking it early, but the clean confirmation is that break — then we aim for the upper zone as the main target. Swallow Academy
Disclaimer
Any content and materials included in Sahmeto's website and official communication channels are a compilation of personal opinions and analyses and are not binding. They do not constitute any recommendation for buying, selling, entering or exiting the stock market and cryptocurrency market. Also, all news and analyses included in the website and channels are merely republished information from official and unofficial domestic and foreign sources, and it is obvious that users of the said content are responsible for following up and ensuring the authenticity and accuracy of the materials. Therefore, while disclaiming responsibility, it is declared that the responsibility for any decision-making, action, and potential profit and loss in the capital market and cryptocurrency market lies with the trader.