
HoneySpotTrading
@t_HoneySpotTrading

What symbols does the trader recommend buying?
Purchase History
پیام های تریدر
Filter
HoneySpotTrading
ETHEREUM (ETHUSD)- Buyers Defend Zone Under Key Resistance
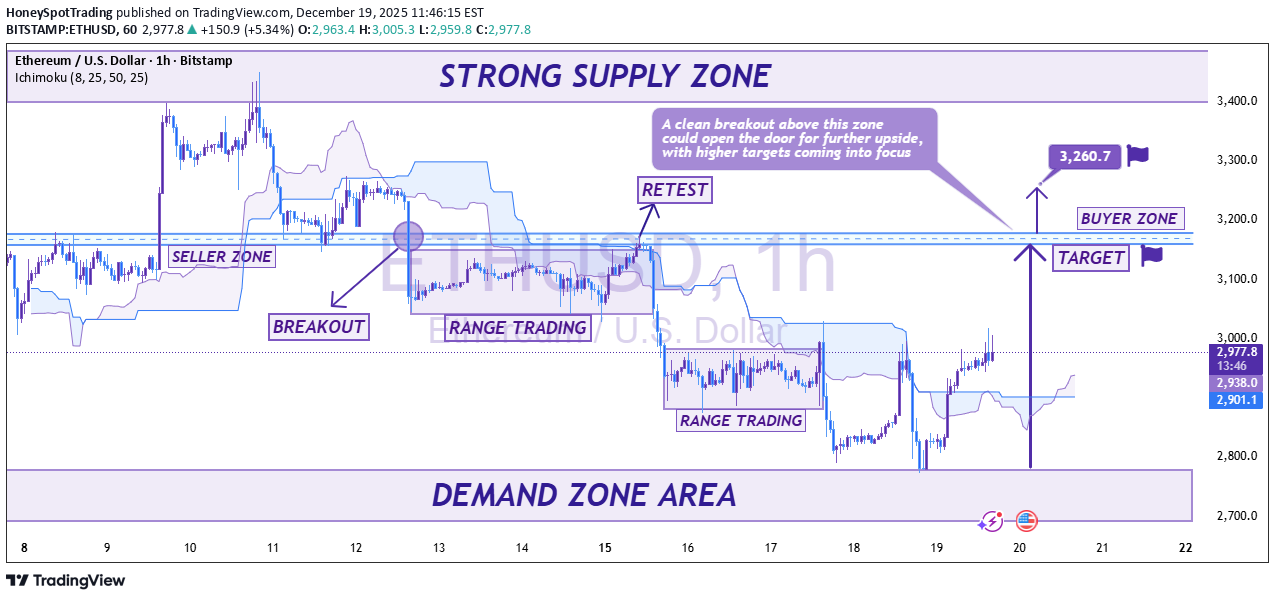
Ethereum on the 1-hour timeframe is showing a well-defined market structure with a strong supply zone overhead. After an extended range-trading phase, price managed to break out and is now performing a clean retest, which suggests growing buyer interest at current levels. Price is currently holding above the marked buyer zone, keeping the bullish scenario valid. A decisive breakout above the supply zone could open the door for further upside, with higher targets coming into focus, particularly toward the 3,260 area. Key points: Multiple range-trading phases before structure expansion Breakout and retest acting as bullish confirmation Demand / buyer zone providing strong support Key decision area just below the major supply zone As long as price remains above the buyer zone, the bias stays cautiously bullish. A strong push above resistance may trigger the next impulsive move higher. This is my technical outlook — what’s your view on ETH from here? Share your thoughts in the comments. — HoneySpotTrading
HoneySpotTrading
BTCUSD – Breakout from Buyer Zone, Upside Continuation in Focus
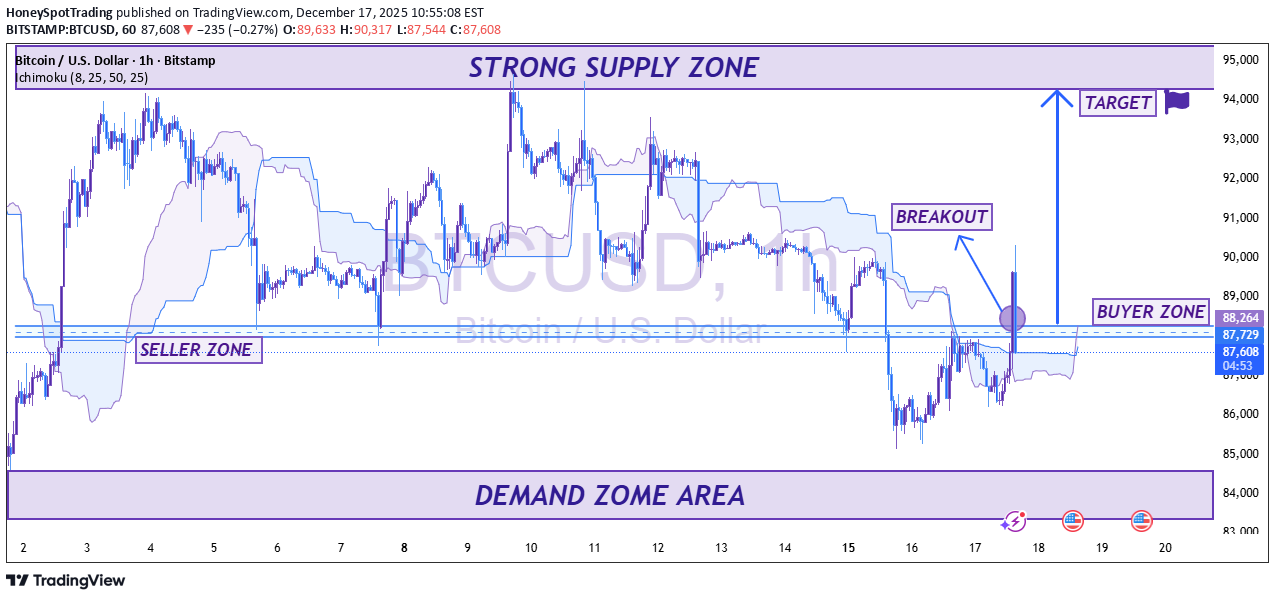
Bitcoin (BTCUSD) on the 1-hour timeframe is showing signs of bullish recovery after a strong reaction from the demand zone area. Price successfully defended the lower range and has now reclaimed the buyer zone, which is acting as a key support level. The chart highlights a potential breakout structure above the previous consolidation and Ichimoku cloud resistance. A confirmed hold above the buyer zone strengthens the bullish bias and opens the door for a continuation move toward the upper strong supply zone, marked as the primary upside target near 94,000–95,000. The prior seller zone has been invalidated, indicating a shift in short-term market control from sellers to buyers. As long as price remains above the buyer zone, pullbacks may be viewed as buy-the-dip opportunities within the broader bullish setup. 🔍 Key Levels to Watch: Buyer Zone / Support: 88,200 – 88,500 Breakout Confirmation: Sustained hold above buyer zone Upside Target: 94,000 – 95,000 (Strong Supply Zone) ⚠️ A failure back below the buyer zone could delay the bullish scenario and lead to further consolidation. That’s my analysis. What’s your outlook — continuation higher or rejection from supply? Drop your thoughts in the comments. — HoneySpotTrading
HoneySpotTrading
LINKUSDT-Supply Pressure Dominates Bearish Continuation in Focus
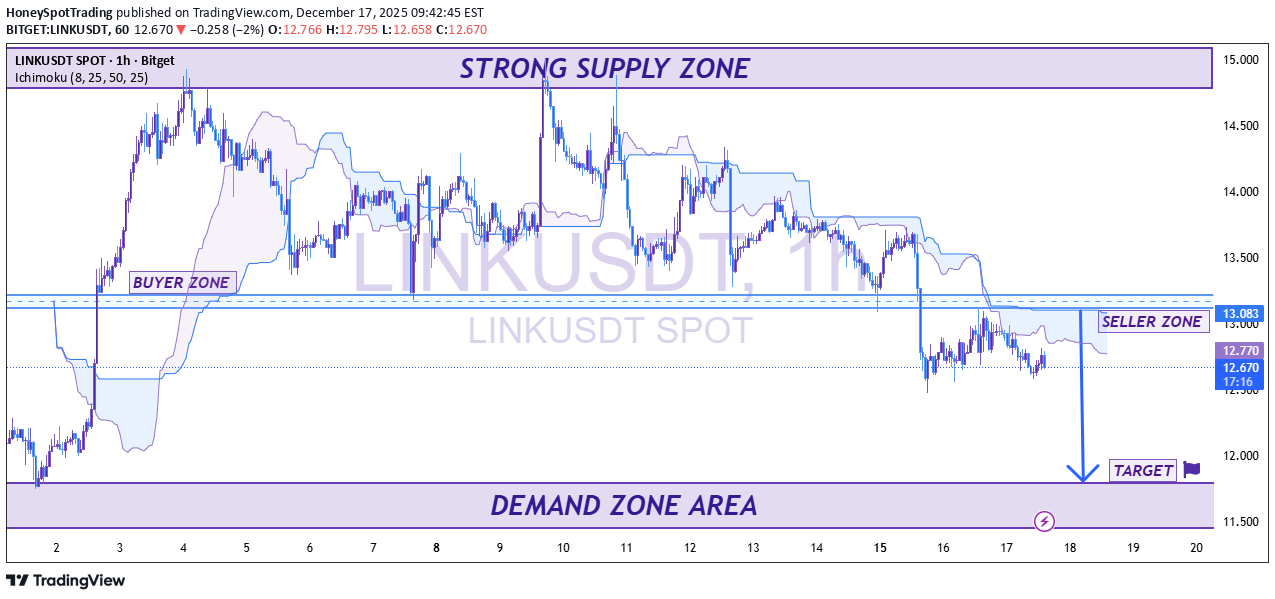
LINKUSDT on the 1-hour timeframe remains under strong bearish pressure after repeated rejections from a clearly defined strong supply zone near the upper range. Price has transitioned into a sequence of lower highs and lower lows, confirming bearish market structure. The previous buyer zone has failed to hold, turning into a seller zone, which is now acting as resistance around the 13.00–13.10 area. Price is also trading below the Ichimoku cloud, reinforcing downside momentum and indicating sellers remain in control. As long as LINK stays below this seller zone, the probability favors a continuation move toward the major demand zone near the 12.00 area, which is marked as the primary downside target. A strong reaction from this demand zone will be critical to assess whether buyers step back in or if further downside opens up. 🔍 Key Levels to Watch: Resistance / Seller Zone: 13.00 – 13.10 Current Bias: Bearish below resistance Downside Target: 12.00 (Demand Zone Area) ⚠️ A sustained reclaim above the seller zone could invalidate the bearish outlook, but until then, rallies may be viewed as selling opportunities. What’s your view — will LINK respect the demand zone or break lower? Share your thoughts in the comments. — HoneySpotTrading
HoneySpotTrading
Xauusd Bullish Structure Intact with Key Retracement Zone
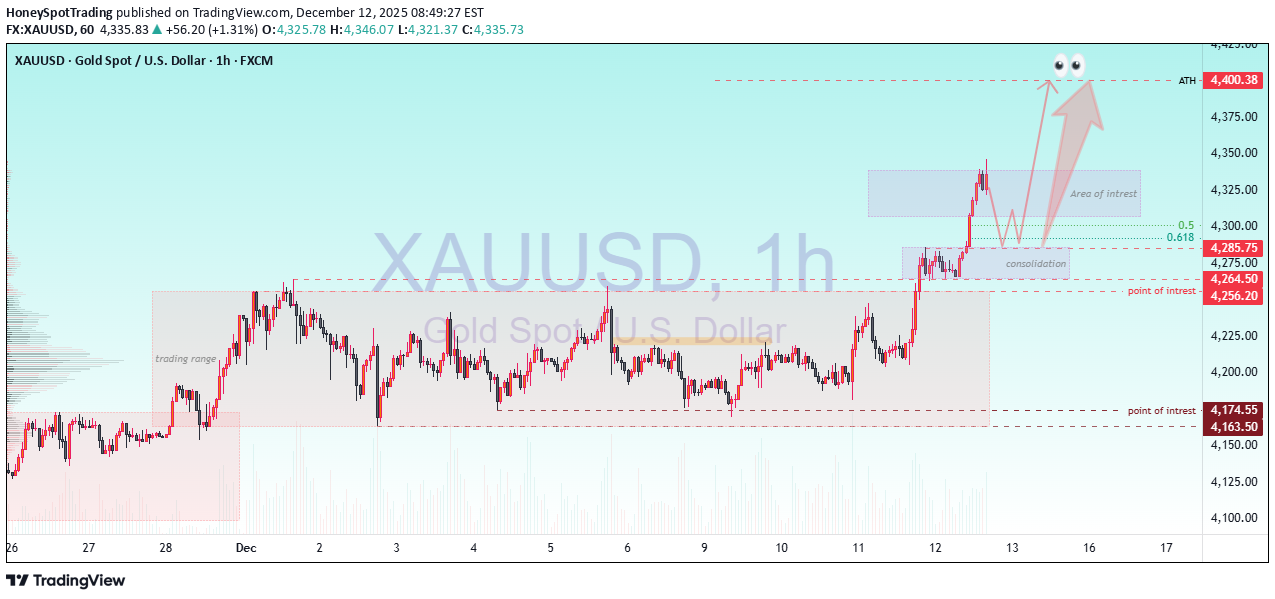
📌 XAUUSD – Bullish Structure Intact with Key Retracement Zone in Play (1H Analysis) 📝 Professional Description: Gold on the 1-hour timeframe shows a clear breakout from a multi-day trading range, shifting market structure from compression to bullish expansion. After breaking above the range high around 4260, price created a short-term consolidation block, which now acts as a demand zone. The recent impulsive rally toward the 4325–4340 area has met initial resistance, causing a corrective pullback. This retracement aligns closely with the 0.50–0.618 Fibonacci levels, marking a high-probability retest zone where buyers may re-enter. The chart highlights: Trading Range (Dec 1–11): Prolonged accumulation that fueled the breakout. Breakout + Retest Structure: Price successfully retested the consolidation zone around 4275–4285. Area of Interest (AOI): The 4305–4320 region, where fresh supply entered. Upper Target: The chart projects a continuation toward ATH region ~4400, contingent on a clean bullish reaction from the retracement zone. 📈 Bias Summary: As long as price holds above 4260–4270 key support (point of interest), the bullish trend remains valid. A strong rejection here can open the path toward new highs, while failure to hold could deepen retracement toward 4175 POI.
HoneySpotTrading
احتمال برگشت اتریوم از سقف قیمتی: هشدار ریزش به محدوده ۲۷۰۰ دلار!
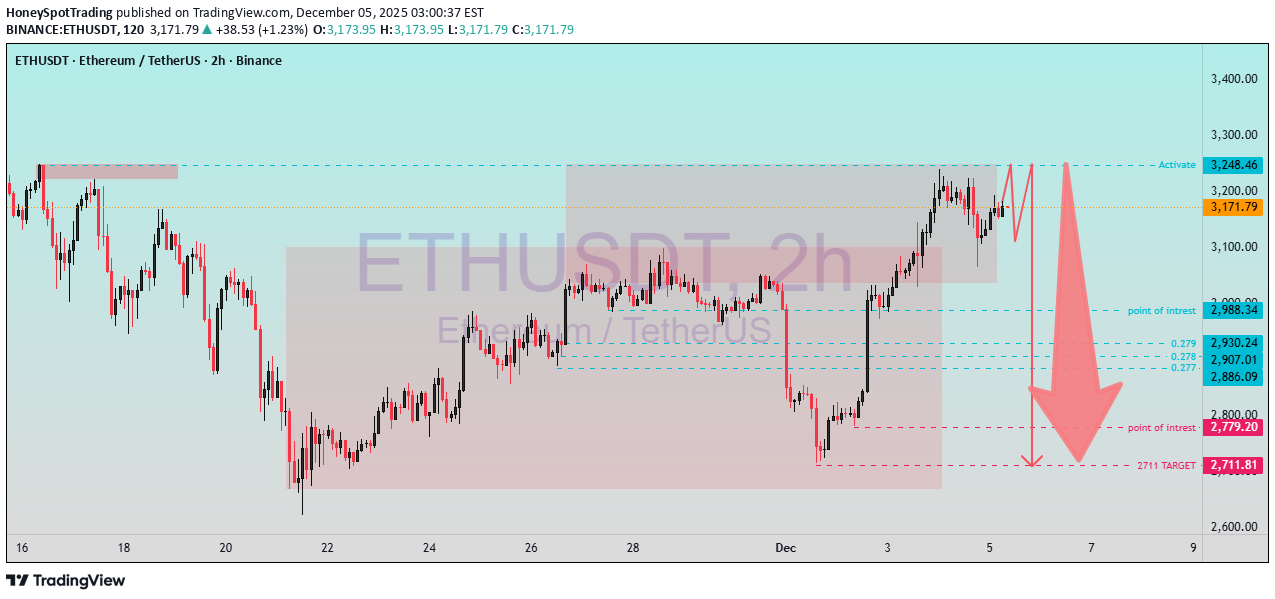
📌 ETHUSDT – Weakness in the Premium Zone & Potential Reversal Scenario 📝 Professional Analysis The ETHUSDT chart shows that after a strong upward move, price has entered a clearly defined premium supply zone (≈ 3,200–3,250 USD). This area has previously acted as a strong rejection zone and is now showing similar reaction signals again. The current structure indicates a possible liquidity grab / sweep at the top, followed by range-type movement — a typical sign of an upcoming reversal. 🔍 Key Points of the Analysis 1️⃣ Major Supply & Activation Zone (3,200–3,248 USD) This zone is acting as a strong resistance. Liquidity was taken above this level multiple times without a sustained breakout. As long as ETH stays below 3,248, the probability of a pullback remains high. 2️⃣ Signs of Weakness in the High Region Multiple wicks and ranging behavior indicate buyer exhaustion. Market structure is close to breaking downward if the last local low gets violated. 3️⃣ Potential Short Continuation A break in short-term structure could trigger a strong impulsive drop. The chart markings clearly suggest a sequence: Break → Impulse → Retracement → Drop into targets 🎯 Key Levels (POIs & Targets) POI #1: 2,988 POI #2: 2,930–2,907 (FVG + demand cluster) POI #3: 2,886 Critical Zone: 2,779 (main target area) 🎯 Final Target: 2,711 USD – This level aligns with an important inefficient price fill + demand mitigation. 📉 Summary ETH is showing clear signs of exhaustion within the premium resistance zone. If market structure breaks, a clean short scenario opens up with target zones at 2,988 → 2,779 → 2,711 USD.
HoneySpotTrading
تحلیل تکنیکال اتریوم (ETH/USD): آیا گوه صعودی پایان کار است؟ پیشبینی سقوط تا ۲۶۵۰ دلار
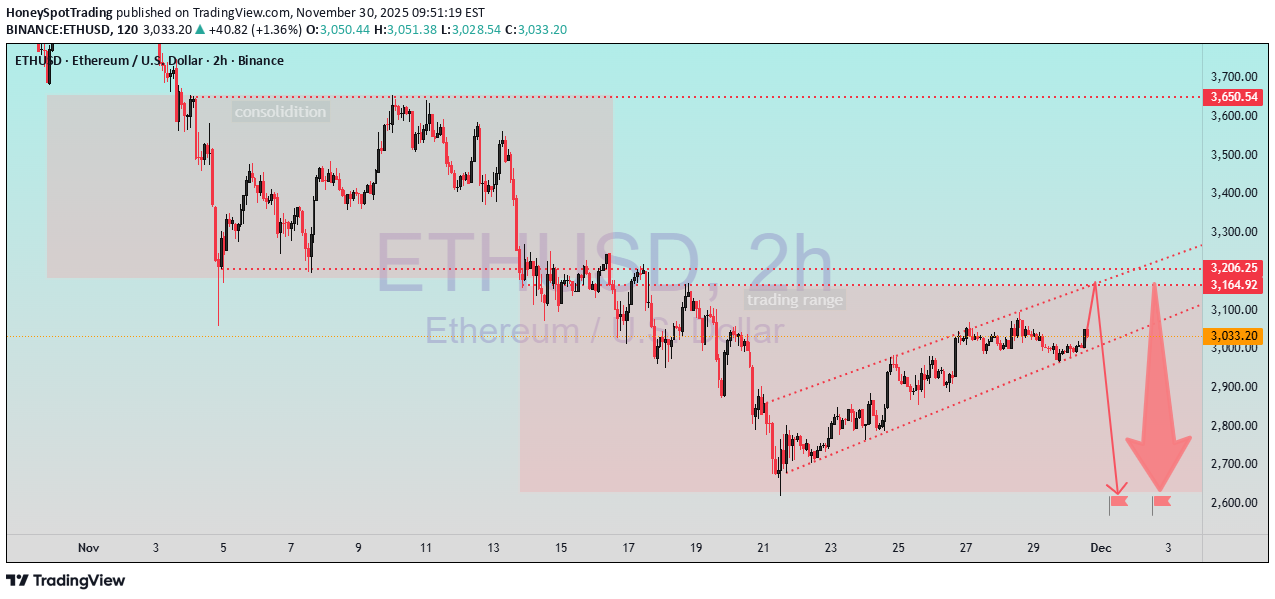
📌 ETH/USD – 2H Technical Analysis Structure Breakdown & Bearish Reversal Scenario ETH is trading inside a rising wedge structure after a prolonged down-move, showing weakening bullish momentum. Price is approaching a major resistance zone between $3,165 – $3,206, which previously acted as the upper boundary of the trading range. 📊 Key Technical Points 1️⃣ Previous Consolidation Zone (Left Side) Price spent several days inside a wide horizontal consolidation box. Multiple equal highs/lows indicate liquidity build-up. A sharp breakdown confirmed the end of that range. 2️⃣ Current Trading Range (Middle Section) Price attempted to re-enter the old range but failed. This rejection created a supply zone, now acting as strong resistance. 3️⃣ Rising Wedge Formation (Right Side) ETH is climbing in a narrowing ascending channel. Weak higher highs = buyer exhaustion. Rising wedge often breaks to the downside. 4️⃣ Resistance Levels $3,165 – $3,206 zone: heavy supply; strong rejection expected. Multiple dotted red lines show previous reaction levels. 📉 Bearish Projection The chart’s red arrows show a likely scenario: Final liquidity grab above wedge → fake breakout risk. Sharp sell-off expected toward: First target: ~$2,750 Second target: ~$2,650 (marked liquidity zone) This aligns with: Trendline break Range rejection Liquidity sweep pattern 📌 Conclusion ETH currently looks more bearish than bullish at this level. If price taps the resistance zone and rejects, a strong downward move toward the lower liquidity blocks is likely.
HoneySpotTrading
بیت کوین روی لبه تیغ: سطوح حیاتی پیش رو برای صعود یا سقوط (تحلیل ۲ ساعته)
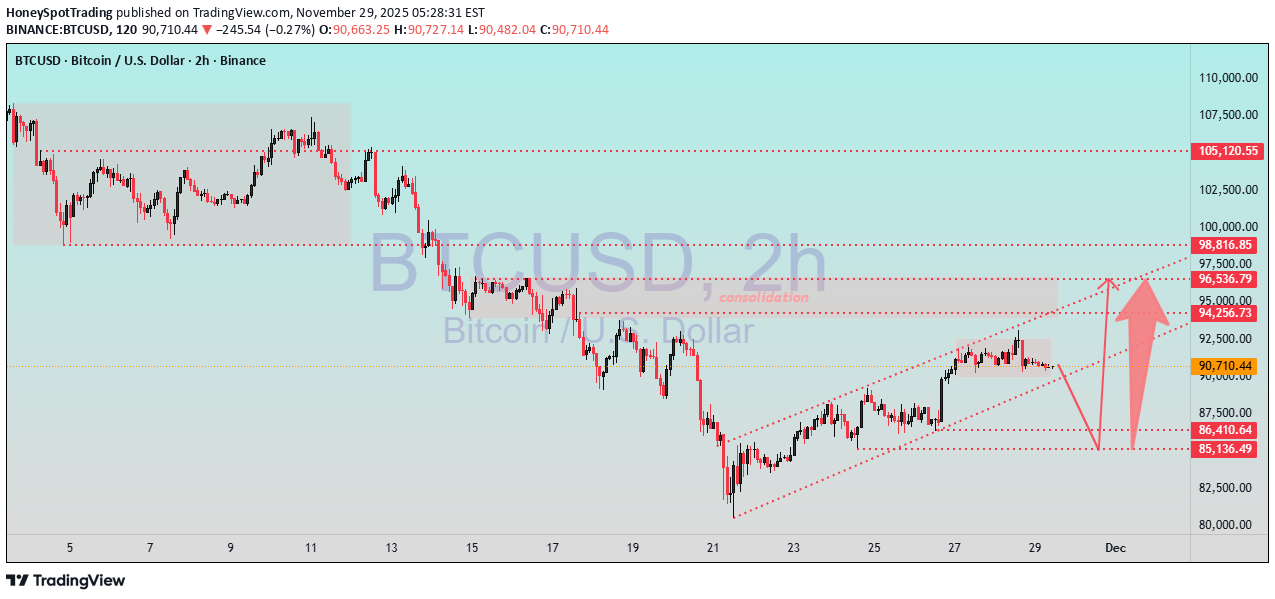
📌 BTCUSD 2H – Consolidation Before Breakout: Critical Levels Ahead 📈 Professional Description (2-Hour Timeframe) Bitcoin is currently trading inside a tight consolidation range after a strong recovery from the $83k–$86k demand zone. Price action is moving within a rising channel, showing short-term bullish momentum but still facing overhead resistance. 🔍 Key Technical Observations 1️⃣ Rising Channel Structure Price is respecting the ascending channel, forming higher highs and higher lows. This indicates a controlled bullish push, but still vulnerable to corrective pullbacks within the channel. 2️⃣ Consolidation Zone (Current Area) BTC is ranging between $90,000–$92,000, suggesting liquidity build-up before a breakout. This area will determine where the next strong move begins. 3️⃣ Upside Targets if Breakout Occurs If price breaks above the consolidation and holds the channel top, the next resistance levels are: $94,256 (Minor supply) $96,536 $98,816 $105,120 (Major HTF supply) These zones are ideal for profit-taking or watching for reversal signals. 4️⃣ Bearish Scenario If BTC rejects from the range and breaks below the channel midline, a corrective drop is expected toward: $87,500 $86,410 (Key support) $85,136 (Demand sweep zone) This would allow bulls to reload before an upward continuation. 📌 Market Expectation Bitcoin is building strength but still needs a clean break above $92k–$94k to confirm bullish continuation. Failure to break this zone may trigger a deeper pullback toward the lower channel support. Both directional arrows shown in the chart are valid paths depending on breakout or rejection structure.
HoneySpotTrading
بیت کوین در نقطه عطف: آیا حمایت کلیدی نگه میدارد و راهی به سوی 100 هزار دلار باز میشود؟
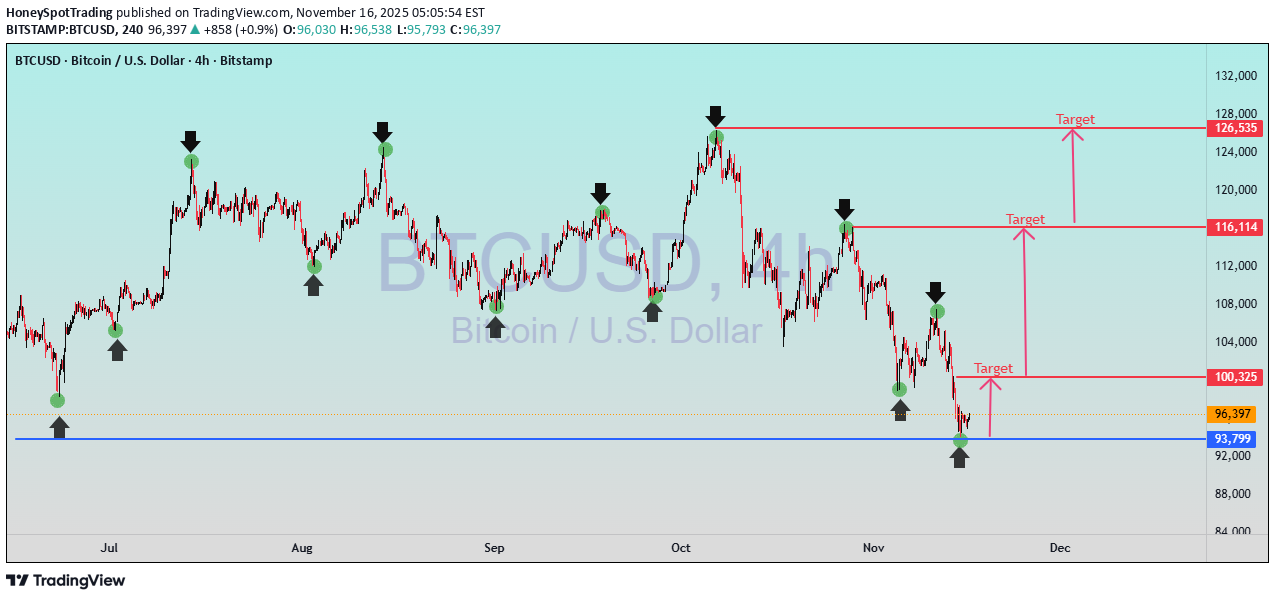
BTC/USD — Major Support Re-Tested, Market Preparing for Strong Reaction BTC/USD has returned to a critical multi-month support zone around 93,800–96,500, a level repeatedly respected since July. Each time price touched this zone, the market produced strong bullish reactions — highlighted clearly by multiple swing-lows marked on your chart. Currently, Bitcoin is forming another potential reversal structure, showing buyers stepping in at the same historical demand level. If buyers hold this zone, the upside path becomes clean with three major targets: Target 1: 100,325 — first key resistance & liquidity pocket Target 2: 116,114 — strong historical supply zone Target 3: 126,535 — major bullish target if momentum strengthens However, a clean 4H close below 93,800 would invalidate this bullish structure and open room for deeper downside. Market Expectation: Bitcoin is at a decision point. As long as 93,800–96,500 holds, bulls can regain control and push toward 100K+ levels. Watch for breakout strength, volume confirmation, and rejection signals near resistance zones. Follow for clean daily analysis 🔥 — HoneySpotTrading
HoneySpotTrading
احتمال سقوط طلا (XAUUSD): سیگنال تغییر روند نزولی از منطقه عرضه!
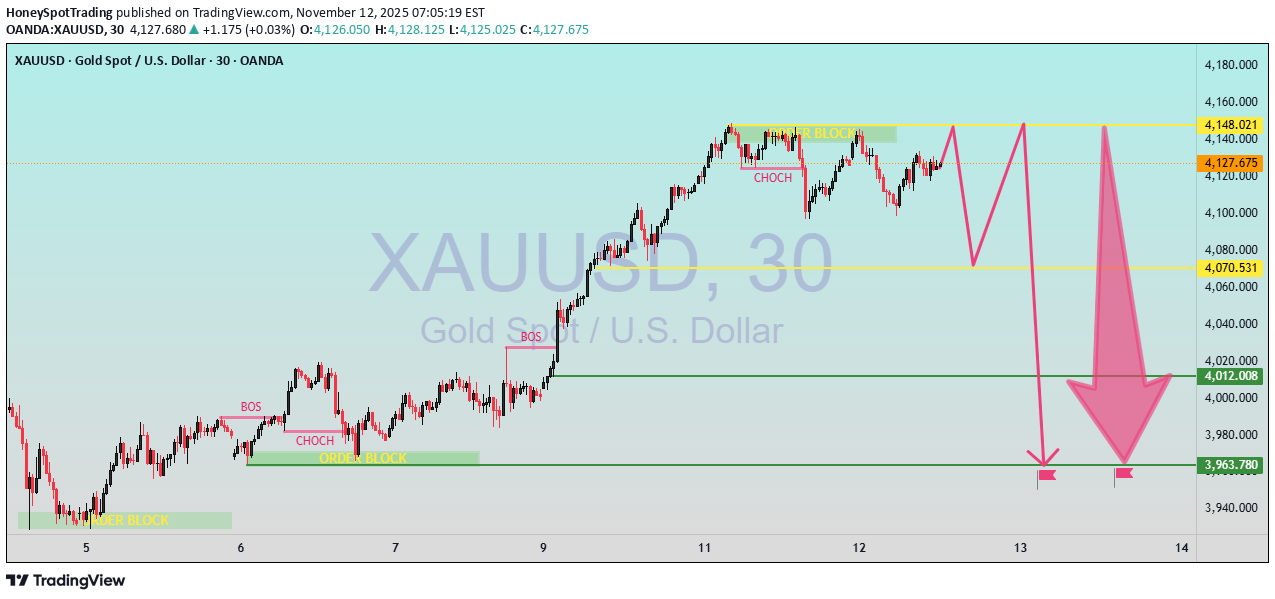
XAUUSD – Potential Bearish Reversal from Supply Zone 📉 On the 30-minute Gold (XAUUSD) chart, price recently reacted from the upper order block near $4,148 – $4,140, showing a clear Change of Character (CHoCH) — an early sign of a potential bearish reversal. The current structure suggests that after a minor pullback or liquidity grab around the $4,140 zone, gold could continue to decline. The next key levels to watch are: Support 1: $4,070 — minor liquidity area where short-term buyers may appear. Support 2: $4,012 — significant structural support aligning with previous Break of Structure (BOS) zone. Support 3 / Final Target: $3,963 — a strong demand zone and possible final target for bearish movement. If price fails to reclaim and sustain above $4,148, bearish pressure is likely to persist, confirming a shift in market structure from bullish to bearish. 📊 Expectations: A potential short-term retracement toward $4,140, followed by continuation to the downside targeting $4,012 → $3,963.
HoneySpotTrading
طلا در آستانه صعود: ساختار صعودی در حمایت و هدفهای بزرگ پیش رو!
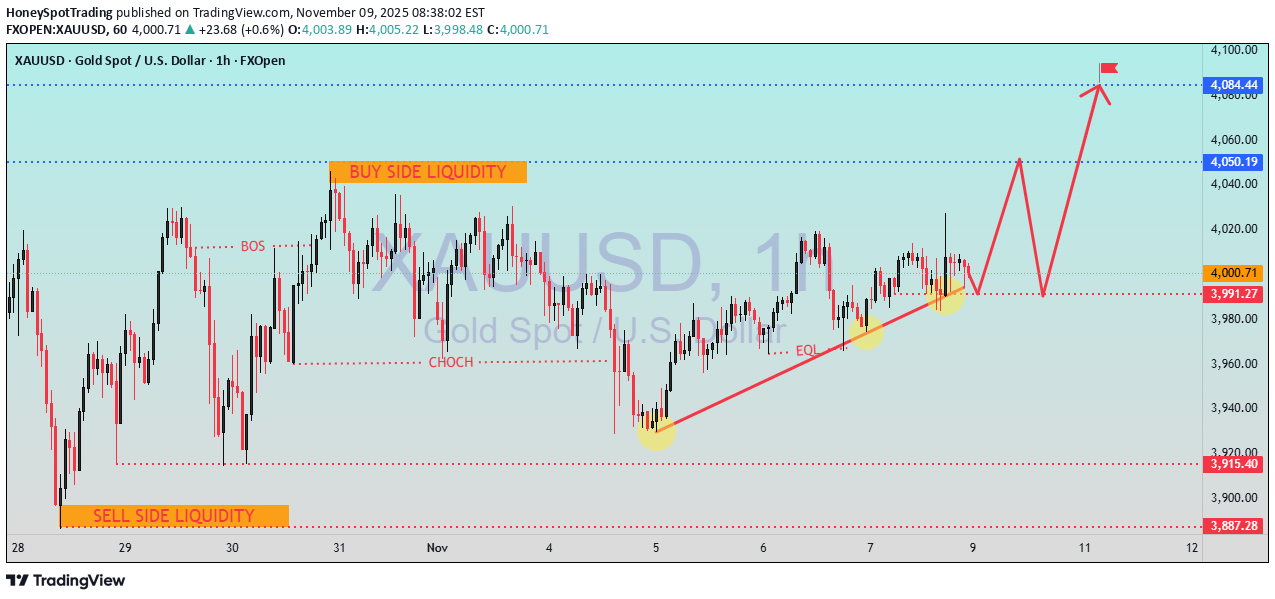
XAUUSD – Bullish Structure Forming Above Support | Liquidity Targets Ahead 📌 DESCRIPTION: By analyzing Gold (XAUUSD) on the 1-hour timeframe, we observe a bullish market structure developing after tapping into sell-side liquidity near $3,950 – $3,915. Price created Equal Lows (EQL) followed by a higher-low structure, indicating demand stepping in. The recent CHoCH → BOS confirms buyers gaining control, with price currently holding above the key $3,991 support zone. As long as this level remains protected, we expect liquidity engineering targeting upside levels. 🎯 Bullish Targets: $4,050 → First liquidity zone (Buy-Side Liquidity sweep risk) $4,084 → Major imbalance fill + next key liquidity pool 📌 Trading Expectations: A short-term corrective pullback can retest demand at $3,991 – $3,980 If price maintains structure, continuation toward upside liquidity is favored Clean break above $4,050 opens a path to $4,084 and higher ⚠️ Invalidation: A sustained break below $3,978 – $3,950 may shift momentum back to sellers targeting $3,915 / $3,887 ✔️ Overall sentiment: Bullish continuation as long as support holds 📍Strategy favors buy-the-dip entries into demand zone
Disclaimer
Any content and materials included in Sahmeto's website and official communication channels are a compilation of personal opinions and analyses and are not binding. They do not constitute any recommendation for buying, selling, entering or exiting the stock market and cryptocurrency market. Also, all news and analyses included in the website and channels are merely republished information from official and unofficial domestic and foreign sources, and it is obvious that users of the said content are responsible for following up and ensuring the authenticity and accuracy of the materials. Therefore, while disclaiming responsibility, it is declared that the responsibility for any decision-making, action, and potential profit and loss in the capital market and cryptocurrency market lies with the trader.