Technical analysis by HoneySpotTrading about Symbol ETH: Sell recommendation (11/30/2025)

HoneySpotTrading
تحلیل تکنیکال اتریوم (ETH/USD): آیا گوه صعودی پایان کار است؟ پیشبینی سقوط تا ۲۶۵۰ دلار
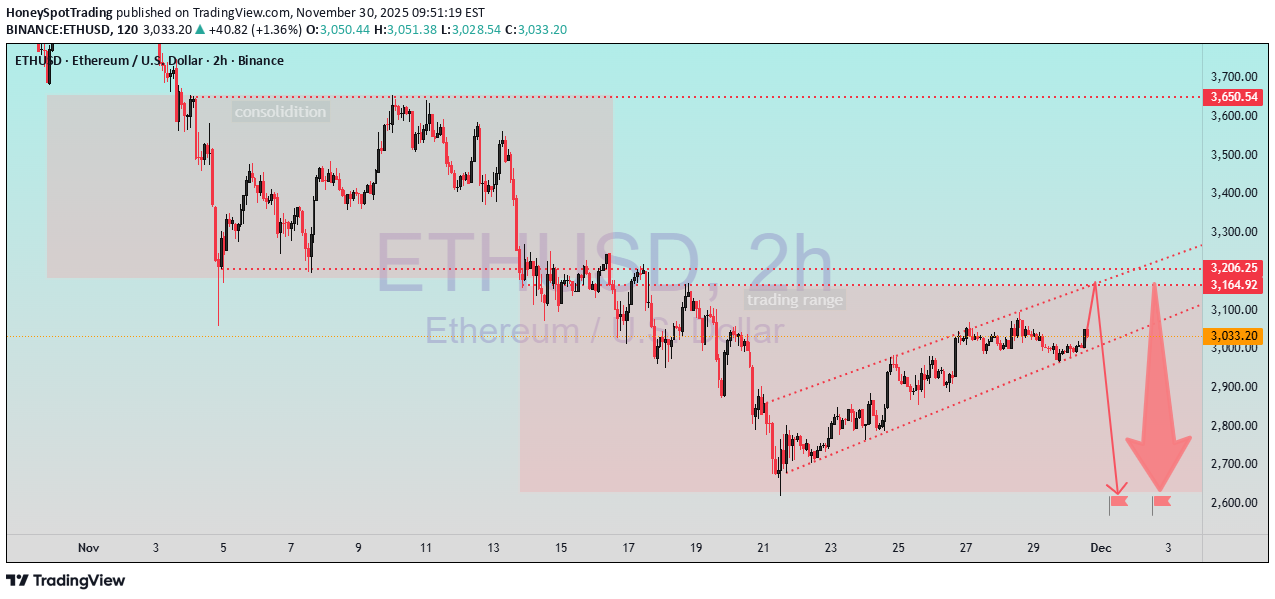
📌 ETH/USD – 2H Technical Analysis Structure Breakdown & Bearish Reversal Scenario ETH is trading inside a rising wedge structure after a prolonged down-move, showing weakening bullish momentum. Price is approaching a major resistance zone between $3,165 – $3,206, which previously acted as the upper boundary of the trading range. 📊 Key Technical Points 1️⃣ Previous Consolidation Zone (Left Side) Price spent several days inside a wide horizontal consolidation box. Multiple equal highs/lows indicate liquidity build-up. A sharp breakdown confirmed the end of that range. 2️⃣ Current Trading Range (Middle Section) Price attempted to re-enter the old range but failed. This rejection created a supply zone, now acting as strong resistance. 3️⃣ Rising Wedge Formation (Right Side) ETH is climbing in a narrowing ascending channel. Weak higher highs = buyer exhaustion. Rising wedge often breaks to the downside. 4️⃣ Resistance Levels $3,165 – $3,206 zone: heavy supply; strong rejection expected. Multiple dotted red lines show previous reaction levels. 📉 Bearish Projection The chart’s red arrows show a likely scenario: Final liquidity grab above wedge → fake breakout risk. Sharp sell-off expected toward: First target: ~$2,750 Second target: ~$2,650 (marked liquidity zone) This aligns with: Trendline break Range rejection Liquidity sweep pattern 📌 Conclusion ETH currently looks more bearish than bullish at this level. If price taps the resistance zone and rejects, a strong downward move toward the lower liquidity blocks is likely.