
KABHI_TA_TRADING
@t_KABHI_TA_TRADING

What symbols does the trader recommend buying?
Purchase History
پیام های تریدر
Filter
KABHI_TA_TRADING
BTC/USDT - Major Rejection from Supply Zone
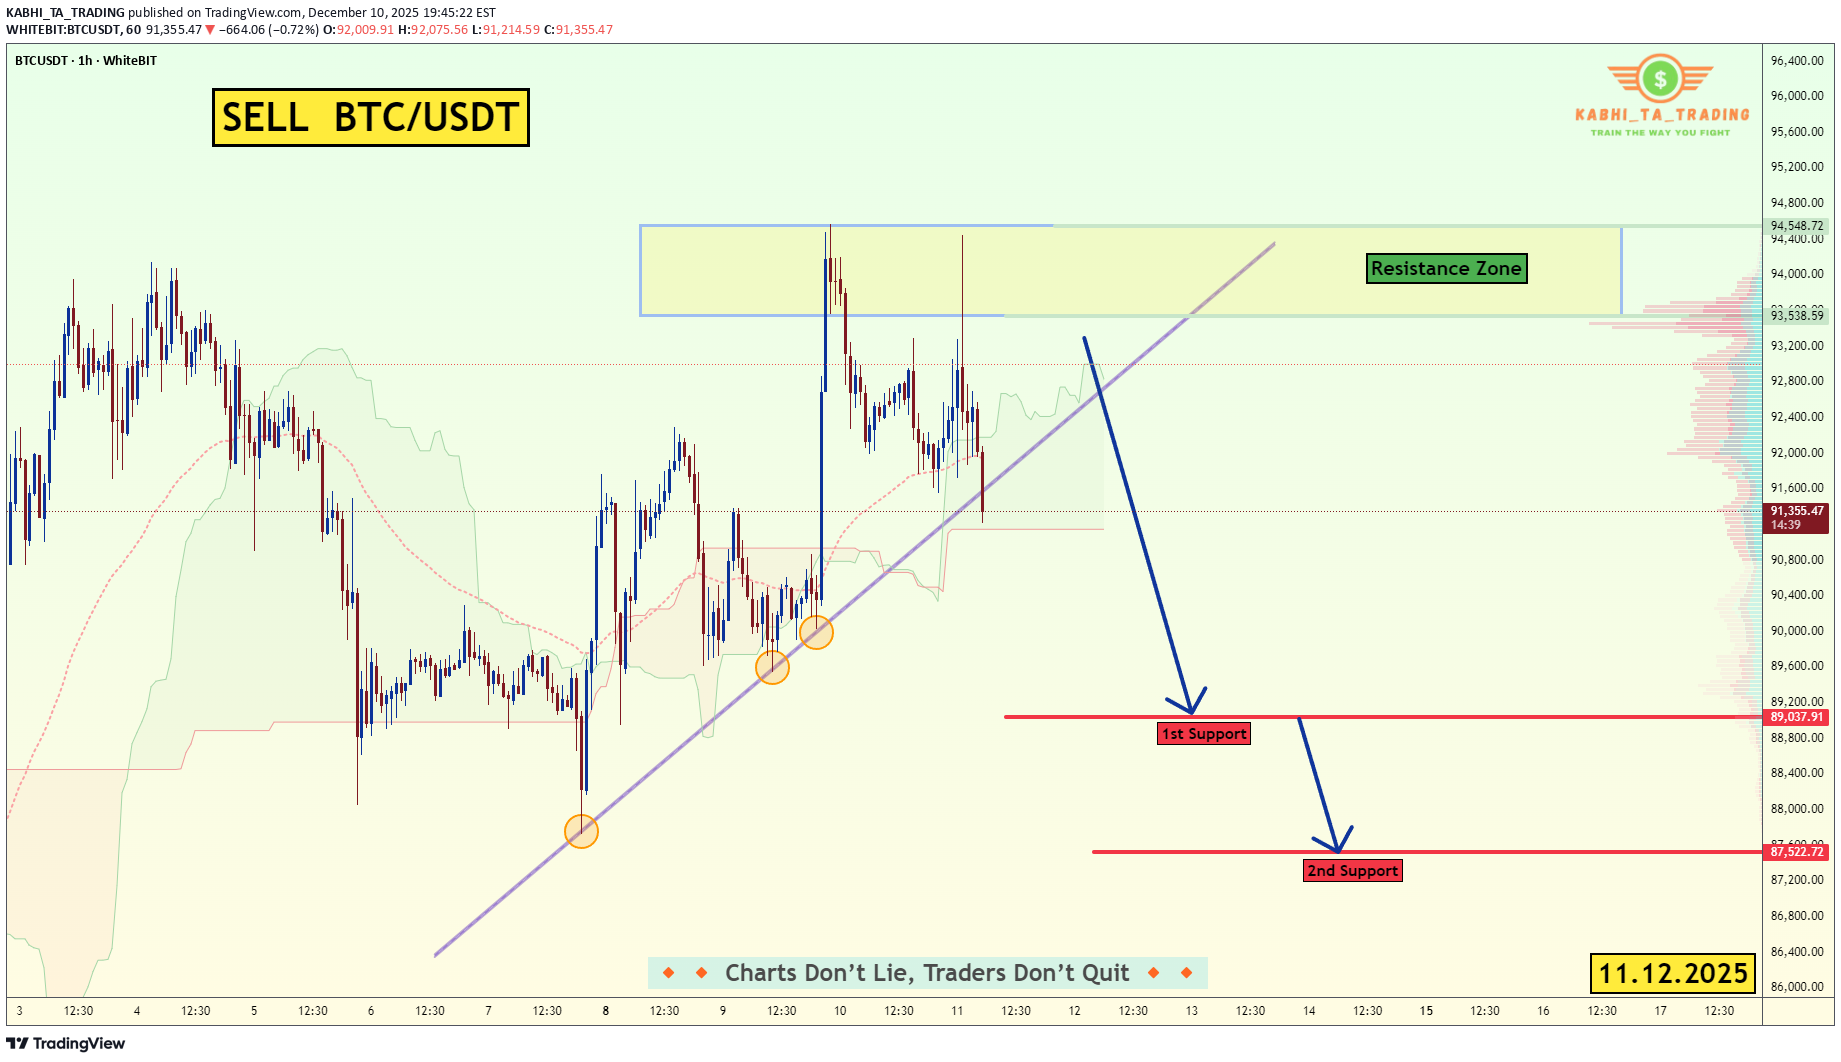
📝 Description 🔹 Setup Overview BTCUSDT BTC/USDT has faced a strong rejection from the upper resistance / supply zone near the recent highs. Price has broken below the rising trendline, signaling a shift in short-term market structure from bullish to bearish. Failure to reclaim the trendline keeps sellers in control. 📌 Trading Plan📉 Bearish Scenario (Primary Bias ) Sell Zone: Below the broken trendline & previous support Target 1: 89,030 (1st Support) Target 2: 87,520 (2nd Support – liquidity area) Confirmation: Weak bullish candles + rejection from trendline retest #BTCUSDT #BitcoinAnalysis #CryptoTrading #BTC #PriceAction #TechnicalAnalysis #CryptoMarket #TrendlineBreak #TradingView #Kabhi_TA_Trading #SellBTC ⚠️ Disclaimer This analysis is for educational purposes only. Crypto markets are highly volatile — always manage risk and use stop-losses. 👍 Support the Analysis❤️ LIKE if this helped💬 COMMENT your BTC view 🔁 SHARE with fellow traders Your support keeps the analysis coming! 🙏
KABHI_TA_TRADING
تحلیل تکنیکال آمازون (AMZN): سقوط در کمین است؟ سرنخهای هشداردهنده در نمودار!

📊 Setup Overview: Amazon stock (NASDAQ: AMZN) is forming a Double Top Reversal Pattern on the 4H chart, signaling potential weakness after failing twice to break above the major resistance zone near $238–$240.The price has also broken below the ascending trendline with a cloud crossover, confirming bearish momentum building up. AMZN 📈 Trade Plan: Bias: Bearish below $220 1st Target: $197.91 ✅ 2nd Target: $183.99 🎯 Resistance Zone: $238 – $240 🧩 Technical Confluence: 1.Double Top formation near major resistance zone 2.Trendline break confirming reversal 3.Ichimoku Cloud crossover indicating bearish momentum 4.Volume profile shows selling pressure increasing below $215 📉 Fundamental Amazon (AMZN): Amazon remains one of the most dominant global tech giants, but several near-term factors could impact its price action: ⚡Upcoming Earnings (Late October 2025): 1.Analysts project Q3 FY2025 revenue around $158–160 billion, with EPS expectations near $1.24–$1.30. 2.Focus will be on AWS (Amazon Web Services) performance — which still contributes over 50% of total operating income, but has shown slower growth due to corporate cost-cutting and cloud competition. ⚡Retail & E-commerce Trends: 1.Amazon’s North America segment remains strong but margin pressure continues due to logistics and rising fulfillment costs. 2.The company’s push into AI-driven retail advertising could offset some of that weakness if ad revenue exceeds expectations. ⚡Broader Market Context: 1.With U.S. yields staying elevated, large-cap tech stocks like Amazon may face valuation compression. 2.Institutional rotation toward value and defensive stocks could further weigh on AMZN in the short term. 🎯Overall, fundamentals remain strong for the long-term, but the technical structure suggests a near-term correction before accumulation resumes. #AMZN #AmazonStock #NASDAQ #USStocks #TechnicalAnalysis #DoubleTopPattern #BearishSetup #PriceAction #EarningsWatch #StockMarket #SwingTrading #TradingView #Ichimoku #CloudCrossover #ChartsDontLie #Kabhi_TA_Trading ⚠️ Disclaimer: This analysis is for educational purposes only and not investment advice. Always perform your own due diligence and manage risk appropriately before taking any position. 💬 Support the Analysis: If this chart helped you — LIKE 👍, COMMENT 💬 your thoughts, and FOLLOW ✅ for more daily stock & forex chart breakdowns from Kabhi_TA_Trading!
KABHI_TA_TRADING
XAU/USD (Gold) - Trendline Breakout (US - CPI Data) (11.09.2025)
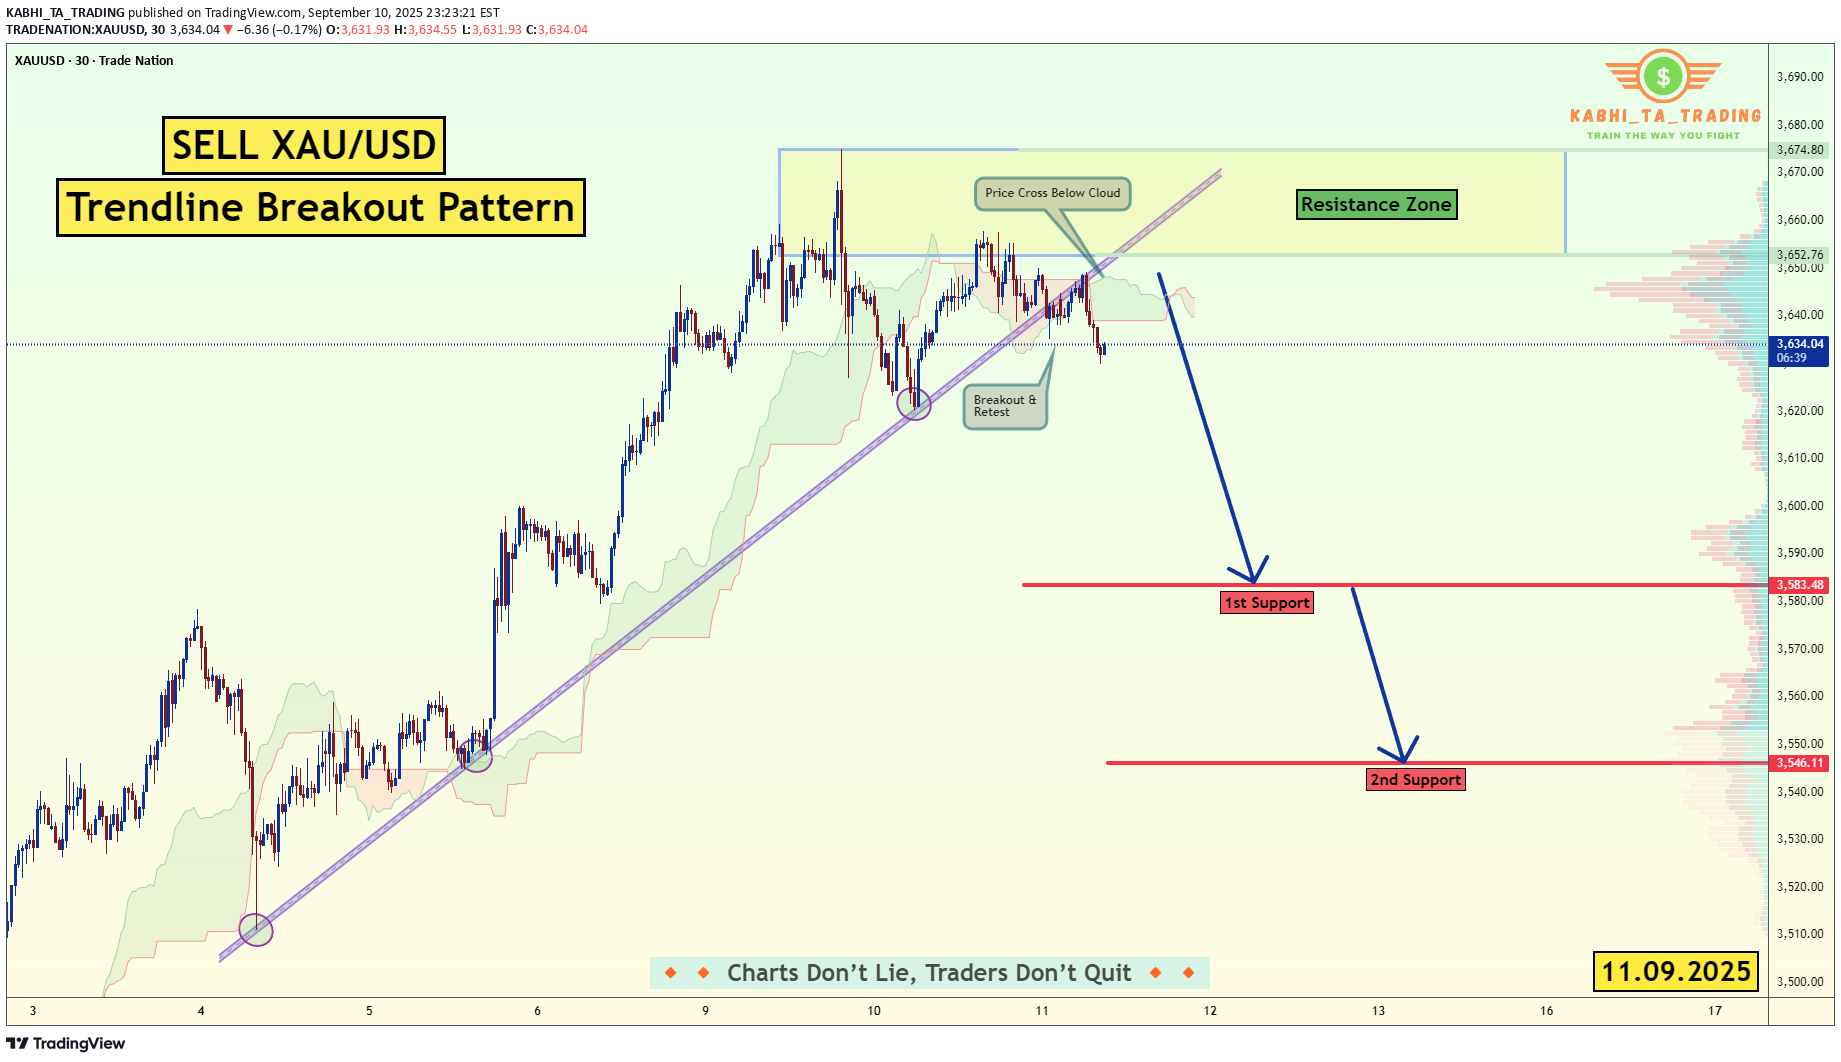
The XAU/USD Pair on the M30 timeframe presents a Potential Selling Opportunity due to a recent Formation of a Trendline Breakout Pattern. This suggests a shift in momentum towards the downside in the coming hours. Possible Short Trade: Entry: Consider Entering A Short Position around Trendline Of The Pattern. Target Levels: 1st Support – 3583 2nd Support – 3546 🎁 Please hit the like button and 🎁 Leave a comment to support for My Post ! Your likes and comments are incredibly motivating and will encourage me to share more analysis with you.Placed
KABHI_TA_TRADING
DOGE/USDT - H4 - Breakout (17.08.2025)
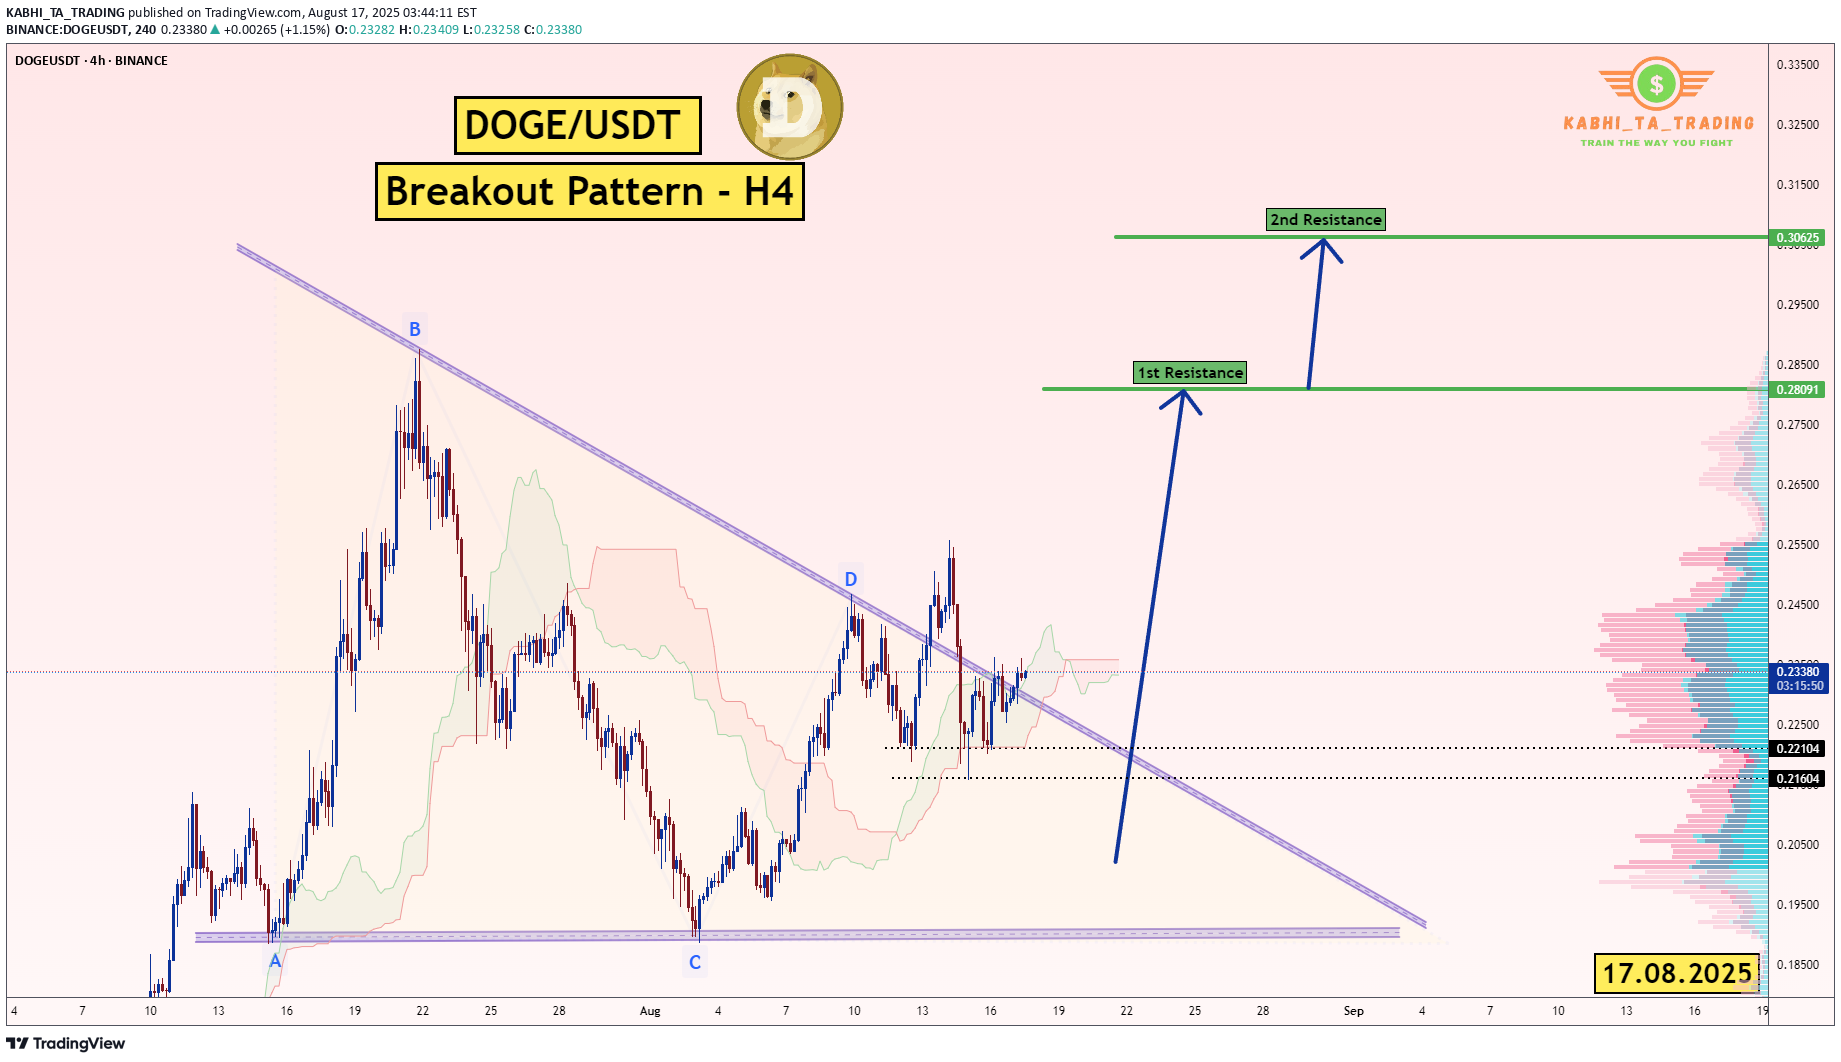
The DOGE/USDT pair on the H4 timeframe presents a Potential Buying Opportunity due to a recent Formation of a Breakout Pattern. This suggests a shift in momentum towards the upside and a higher likelihood of further advances in the coming Days. Possible Long Trade: Entry: Consider Entering A Long Position around Trendline Of The Pattern. Target Levels: 1st Resistance – 0.2809 2nd Resistance – 0.3062 🎁 Please hit the like button and 🎁 Leave a comment to support for My Post ! Your likes and comments are incredibly motivating and will encourage me to share more analysis with you. Best Regards, KABHI_TA_TRADING Thank you.Placed
KABHI_TA_TRADING
XAU/USD - Bearish Flag Pattern (16.08.2025)
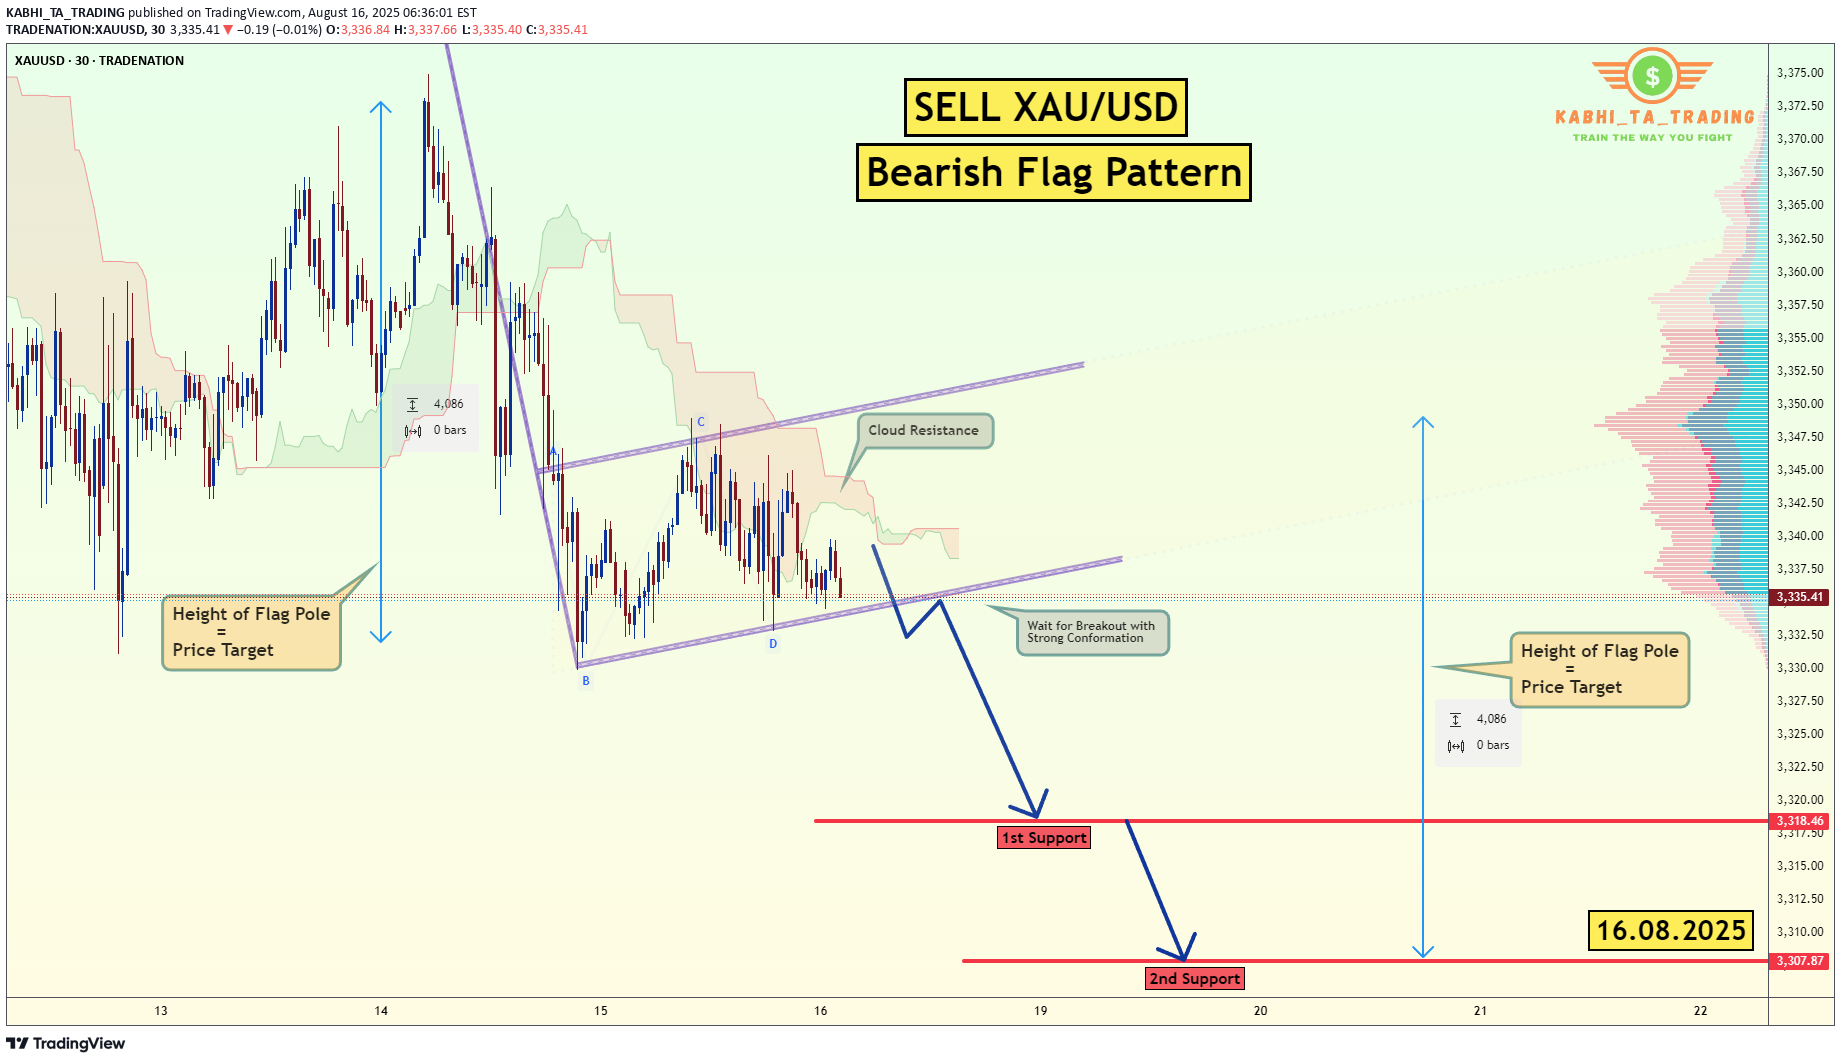
The XAU/USD Pair on the M30 timeframe presents a Potential Selling Opportunity due to a recent Formation of a Bearish Flag Pattern. This suggests a shift in momentum towards the downside in the coming hours. Possible Short Trade: Entry: Consider Entering A Short Position around Trendline Of The Pattern. Target Levels: 1st Support – 3318 2nd Support – 3308 🎁 Please hit the like button and 🎁 Leave a comment to support for My Post ! Your likes and comments are incredibly motivating and will encourage me to share more analysis with you. Best Regards, KABHI_TA_TRADING Thank you. Disclosure: I am part of Trade Nation's Influencer program and receive a monthly fee for using their TradingView charts in my analysis.Order
KABHI_TA_TRADING
XRP/USDT -H1 - Triangle Breakout (07.08.2025)

The XRP/USDT Pair on the H1 timeframe presents a Potential Selling Opportunity due to a recent Formation of a Triangle Breakout Pattern. This suggests a shift in momentum towards the downside in the coming Days. Possible Short Trade: Entry: Consider Entering A Short Position around Trendline Of The Pattern. Target Levels: 1st Support – 2.7054 2nd Support – 2.5468 🎁 Please hit the like button and 🎁 Leave a comment to support for My Post ! Your likes and comments are incredibly motivating and will encourage me to share more analysis with you. Best Regards, KABHI_TA_TRADING Thank you.Placed
KABHI_TA_TRADING
XAU/USD (Gold) Triangle Breakout (07.08.2025)

The XAU/USD pair on the M30 timeframe presents a Potential Buying Opportunity due to a recent Formation of a Triangle Breakout Pattern. This suggests a shift in momentum towards the upside and a higher likelihood of further advances in the coming hours. Possible Long Trade: Entry: Consider Entering A Long Position around Trendline Of The Pattern. Target Levels: 1st Resistance – 3407 2nd Resistance – 3420 🎁 Please hit the like button and 🎁 Leave a comment to support for My Post ! Your likes and comments are incredibly motivating and will encourage me to share more analysis with you. Best Regards, KABHI_TA_TRADING Thank you. Disclosure: I am part of Trade Nation's Influencer program and receive a monthly fee for using their TradingView charts in my analysis.placed
KABHI_TA_TRADING
XAU/USD (Gold) - Triangle Breakout (1.08.2025)

The XAU/USD Pair on the M30 timeframe presents a Potential Selling Opportunity due to a recent Formation of a Triangle Breakout Pattern. This suggests a shift in momentum towards the downside in the coming hours. Possible Short Trade: Entry: Consider Entering A Short Position around Trendline Of The Pattern. Target Levels: 1st Support – 3249 2nd Support – 3225 🎁 Please hit the like button and 🎁 Leave a comment to support for My Post ! Your likes and comments are incredibly motivating and will encourage me to share more analysis with you. Best Regards, KABHI_TA_TRADING Thank you. Disclosure: I am part of Trade Nation's Influencer program and receive a monthly fee for using their TradingView charts in my analysis.Placed
KABHI_TA_TRADING
XAU/USD Trendline Breakout (30.07.2025)

The XAU/USD pair on the M30 timeframe presents a Potential Buying Opportunity due to a recent Formation of a Trendline Breakout Pattern. This suggests a shift in momentum towards the upside and a higher likelihood of further advances in the coming hours. Possible Long Trade: Entry: Consider Entering A Long Position around Trendline Of The Pattern. Target Levels: 1st Resistance – 3360 2nd Resistance – 3377 🎁 Please hit the like button and 🎁 Leave a comment to support for My Post ! Your likes and comments are incredibly motivating and will encourage me to share more analysis with you. Best Regards, KABHI_TA_TRADING Thank you. Disclosure: I am part of Trade Nation's Influencer program and receive a monthly fee for using their TradingView charts in my analysis.placed
KABHI_TA_TRADING
TON/USDT - Bullish Channel in H4 (27.07.2025)

The TON/USDT pair on the H4 timeframe presents a Potential Buying Opportunity due to a recent Formation of a Bullish Channel Pattern. This suggests a shift in momentum towards the upside and a higher likelihood of further advances in the coming Days. Possible Long Trade: Entry: Consider Entering A Long Position around Trendline Of The Pattern. Target Levels: 1st Resistance – 3.770 2nd Resistance – 3.989 🎁 Please hit the like button and 🎁 Leave a comment to support for My Post ! Your likes and comments are incredibly motivating and will encourage me to share more analysis with you. Best Regards, KABHI_TA_TRADING Thank you.placed
Disclaimer
Any content and materials included in Sahmeto's website and official communication channels are a compilation of personal opinions and analyses and are not binding. They do not constitute any recommendation for buying, selling, entering or exiting the stock market and cryptocurrency market. Also, all news and analyses included in the website and channels are merely republished information from official and unofficial domestic and foreign sources, and it is obvious that users of the said content are responsible for following up and ensuring the authenticity and accuracy of the materials. Therefore, while disclaiming responsibility, it is declared that the responsibility for any decision-making, action, and potential profit and loss in the capital market and cryptocurrency market lies with the trader.