
Lingrid
@t_Lingrid

What symbols does the trader recommend buying?
Purchase History
پیام های تریدر
Filter
Lingrid
Lingrid | SOLUSDT Bullish Setup After Channel Break

SOLUSDT has completed a successful channel breakout and is now holding above the reclaimed descending trendline, signaling a structural shift in momentum. The breakout follows a prolonged compression phase, which typically precedes strong directional moves. Price is currently retesting the former resistance zone around 134–135, which now acts as key support. As long as this level holds, the structure favors continuation higher toward the 146 resistance zone, where previous supply is located. ➡️ Primary scenario: support holds → continuation toward 146.8 ⚠️ Invalidation: sustained breakdown below 134 would negate the breakout and reopen downside risk If this idea resonates with you or you have your own opinion, traders, hit the comments. I’m excited to read your thoughts!
Lingrid
Lingrid | GOLD Trend Continuation After Corrective Phase

XAUUSD remains within a well-defined upward channel after completing a healthy corrective move from the recent higher high. Price has respected the 4,300 support zone, printing a higher low directly on the rising trendline — a key signal that bullish structure is still intact. This area acts as a technical demand zone, combining support and prior consolidation, making it a high-probability zone for continuation. As long as price holds above 4,350, buyers are expected to defend the structure and push price back toward 4,510 initially, with a potential extension into the higher resistance zone. ➡️ Primary scenario: support holds → continuation toward 4,510 ⚠️ Invalidation: decisive breakdown below 4,350 shifts bias to deeper correction If this idea resonates with you or you have your own opinion, traders, hit the comments. I’m excited to read your thoughts!
Lingrid
بیت کوین (BTCUSDT) آماده جهش به ۹۵ هزار دلار؛ حمایت ۹۰ هزار تومانیدی چقدر مهم است؟

BTCUSDT broke above the consolidation zone, reclaiming structure above the prior range while holding the 90,000 support zone. Price is also stabilizing above trendline, suggesting the corrective phase may be ending rather than expanding. As long as BTC continues to defend the 90K area, upside continuation toward 95,800 remains the primary scenario, with a potential extension toward higher resistance zone if momentum accelerates. This bullish structure stays valid unless price accepts back below the trendline. ➡️ Primary scenario: hold above 90K → push toward 95.8K ⚠️ Risk scenario: loss of 90K opens downside toward mid-range support If this idea resonates with you or you have your own opinion, traders, hit the comments. I’m excited to read your thoughts!
Lingrid
Lingrid | GOLD Swap Zone Bounce Signals Trend Continuation

XAUUSD reacted strongly after pulling back from the 2025 high, finding demand inside the 4,270–4,280 swap zone, where prior structure and the rising trendline converge. The rebound from this area suggests selling pressure may be losing control rather than accelerating into a trend reversal. If price continues to respect this support, a recovery move toward 4,460 could develop, followed by a possible re-test of the upper resistance. The broader bullish framework remains intact as long as price stabilizes above the channel base. ➡️ Primary scenario: defense of 4,270 → push toward 4,460 ⚠️ Risk scenario: acceptance below 4,250 shifts focus to deeper corrective levels If this idea resonates with you or you have your own opinion, traders, hit the comments. I’m excited to read your thoughts!+1890 pips! Yes it was Great rise
Lingrid
Lingrid | HYPEUSDT Weak Corrective Move May Spark Selling

HYPEUSDT perfectly played out my previous trading idea . Price attempted a rebound from the higher-low area but stalled beneath the resistance zone, showing hesitation as it approached the 27.8–28.0 swap zone. The recovery lacks follow-through, and structure still favors sellers while price remains capped below former breakdown levels. If this zone continues to reject upside attempts, the move may unfold as a corrective pullback within a broader bearish leg. A rollover from current levels could drag price back toward 23.0, where prior demand and the rising trendline converge, acting as a magnet for liquidity. ➡️ Primary scenario: rejection from 27.8 → decline toward 23.0 ⚠️ Risk scenario: clean breakout and hold above 28.5 weakens bearish control and delays downside If this idea resonates with you or you have your own opinion, traders, hit the comments. I’m excited to read your thoughts!
Lingrid
Lingrid | GOLD Long Entry After Aggressive Sell-Off

XAUUSD reacted strongly from the lower support band around 4,300–4,320, where price respected the rising channel base and quickly rejected further downside. The sharp bounce suggests that sell pressure may be exhausting after the recent top, with buyers stepping back in at a key structural level. As long as price holds above this support and builds acceptance above 4,345, the rebound could extend toward the 4,450 level initially. A clean push above that zone would open the way for a renewed attempt toward the upper resistance. ➡️ Primary scenario: hold above 4,345 → continuation toward 4,450 and higher ⚠️ Risk scenario: loss of 4,300 invalidates the setup and signals deeper correction If this idea resonates with you or you have your own opinion, traders, hit the comments. I’m excited to read your thoughts!
Lingrid
Lingrid | XRPUSDT Range Break Below May Trigger Decline

XRPUSDT perfectly played out my previous trading idea . Price continues to trade beneath a descending trendline while forming a sequence of lower highs, signaling that sellers still dictate the broader structure. Price is consolidating just below the 1.94 swap zone, an area that previously acted as support and is now turning into overhead supply. If this zone caps upside attempts again, downside pressure may rebuild toward the 1.70 support region, where the lower channel boundary converges with prior demand. Any rebound into the trendline without acceptance above it keeps the bearish continuation scenario favored. ➡️ Primary scenario: rejection near 1.94 → drop toward 1.70 ⚠️ Risk scenario: sustained close above 1.94 weakens bearish bias and delays continuation If this idea resonates with you or you have your own opinion, traders, hit the comments. I’m excited to read your thoughts!
Lingrid
Lingrid | BTCUSDT Bullish Setup After Key Trendline Breakout
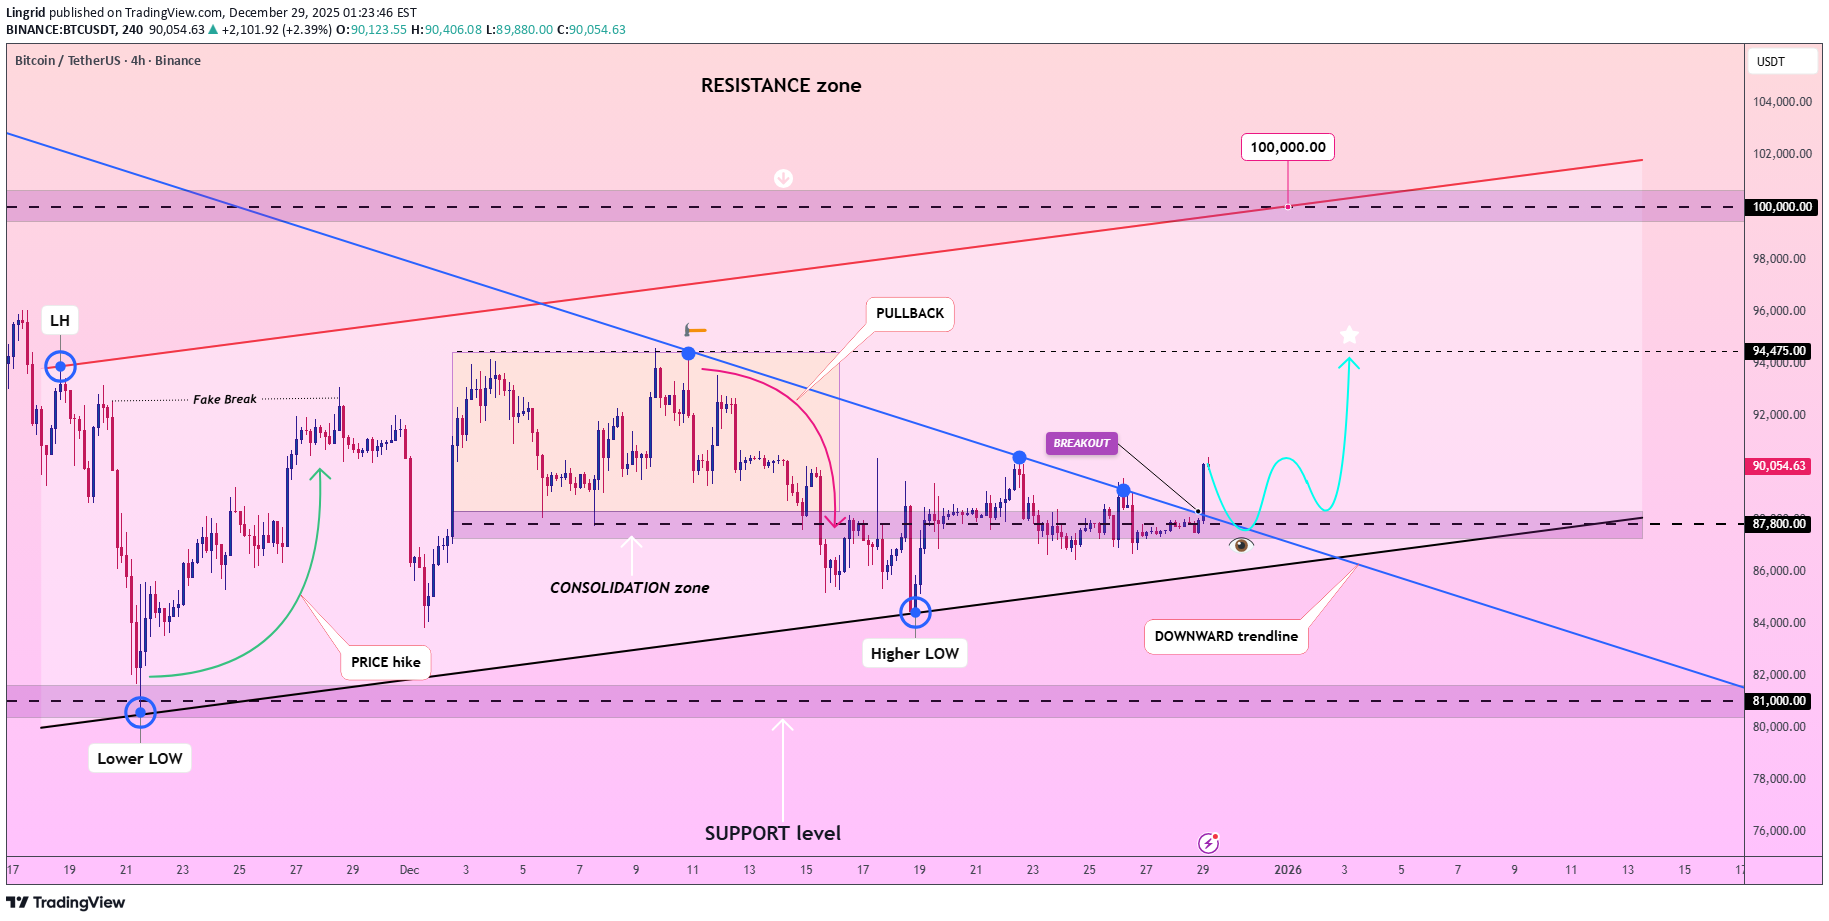
BTCUSDT has reclaimed the descending trendline and 90,000 level. Price is now holding above the former resistance area, signaling a shift in short-term structure. The recent pullback respected the trendline breakout, forming a higher low and confirming buyer defense near the 87,800 support zone. Price action is compressing above this level, suggesting preparation for a continuation move rather than distribution. As long as BTC remains above the broken trendline, upside pressure may build toward the 94,500 zone, with an extension toward the higher level if momentum expands. Failure to hold above 87,800 would delay the bullish scenario and expose a deeper retest toward the lower support band. ➡️ Primary scenario: hold above 87,800 → push toward 94,475. ⚠️ Risk scenario: acceptance below 87,800 weakens bullish structure and invalidates continuation. If this idea resonates with you or you have your own opinion, traders, hit the comments. I’m excited to read your thoughts!
Lingrid
پیشبینی طلای هفته: آیا اصلاح کوتاهمدت، سکوی پرتاب به سوی اوجهای جدید است؟
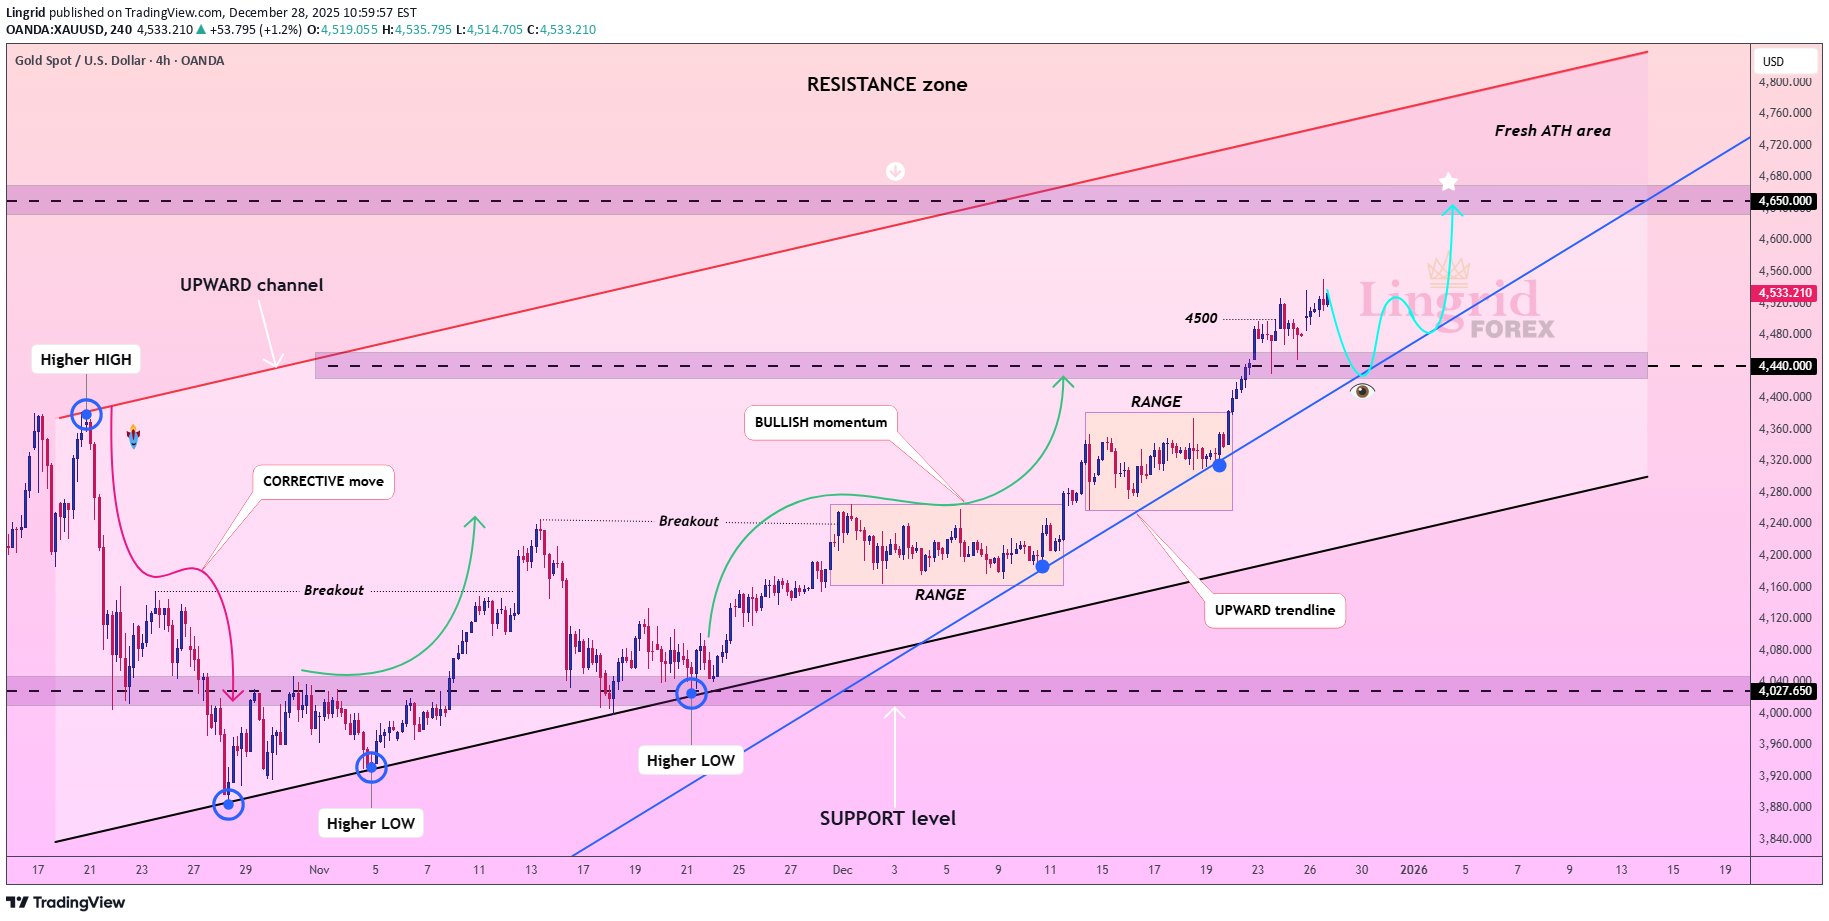
XAUUSD perfectly played out my previous weekly idea . Gold push toward $4,500 has stalled as bullish momentum wanes ahead of year-end, with price now testing the upper boundary of its recent range near $4,530. 4H chart clearly shows the market is losing steam, hinting at a short-term pullback toward the $4,440 support zone—a natural pause after a strong run. This is consolidation within a powerful uptrend defined by higher lows and a clear upward channel. The macro backdrop remains firmly supportive: central banks are still buying, geopolitics are volatile, and real yields stay low. This dip is not a warning—it’s an opportunity to add to long positions with disciplined risk management. The bullish market structure remains intact. Key support sits at $4,440, reinforced by the rising trendline. A break below $4,400 could trigger a deeper correction toward $4,250, but that would likely be a shallow retracement before resuming the climb. Conversely, a decisive close above weekly opens the door to fresh all-time highs in the $4,650 and higher, where resistance is thin. We should watch for bullish reversals on the 4H chart near support. GOLD ’s bull market is structural, not seasonal. This holiday slowdown is just the bull catching its breath—don’t mistake it for fatigue. The next surge is already being prepared and 2026 could start with it. If this idea resonates with you or you have your own opinion, traders, hit the comments. I’m excited to read your thoughts!GOLD remains in a well-defined upward channel and continues to print higher lows, confirming that the recent pullback is corrective. Price is holding above the former breakout zone near 4,420, which is now acting as dynamic support. As long as buyers defend this area, continuation toward the 4,600 level is favored, with a potential extension into the fresh ATH zone near if momentum accelerates. A clean breakdown below 4,420 would signal a deeper correction toward channel support. ➡️ Primary scenario: hold above 4,420 → push toward 4,600 ⚠️ Invalidation: sustained break below upward trendline
Lingrid
Lingrid | BNBUSDT Potential Downside Break After Swap Rejection
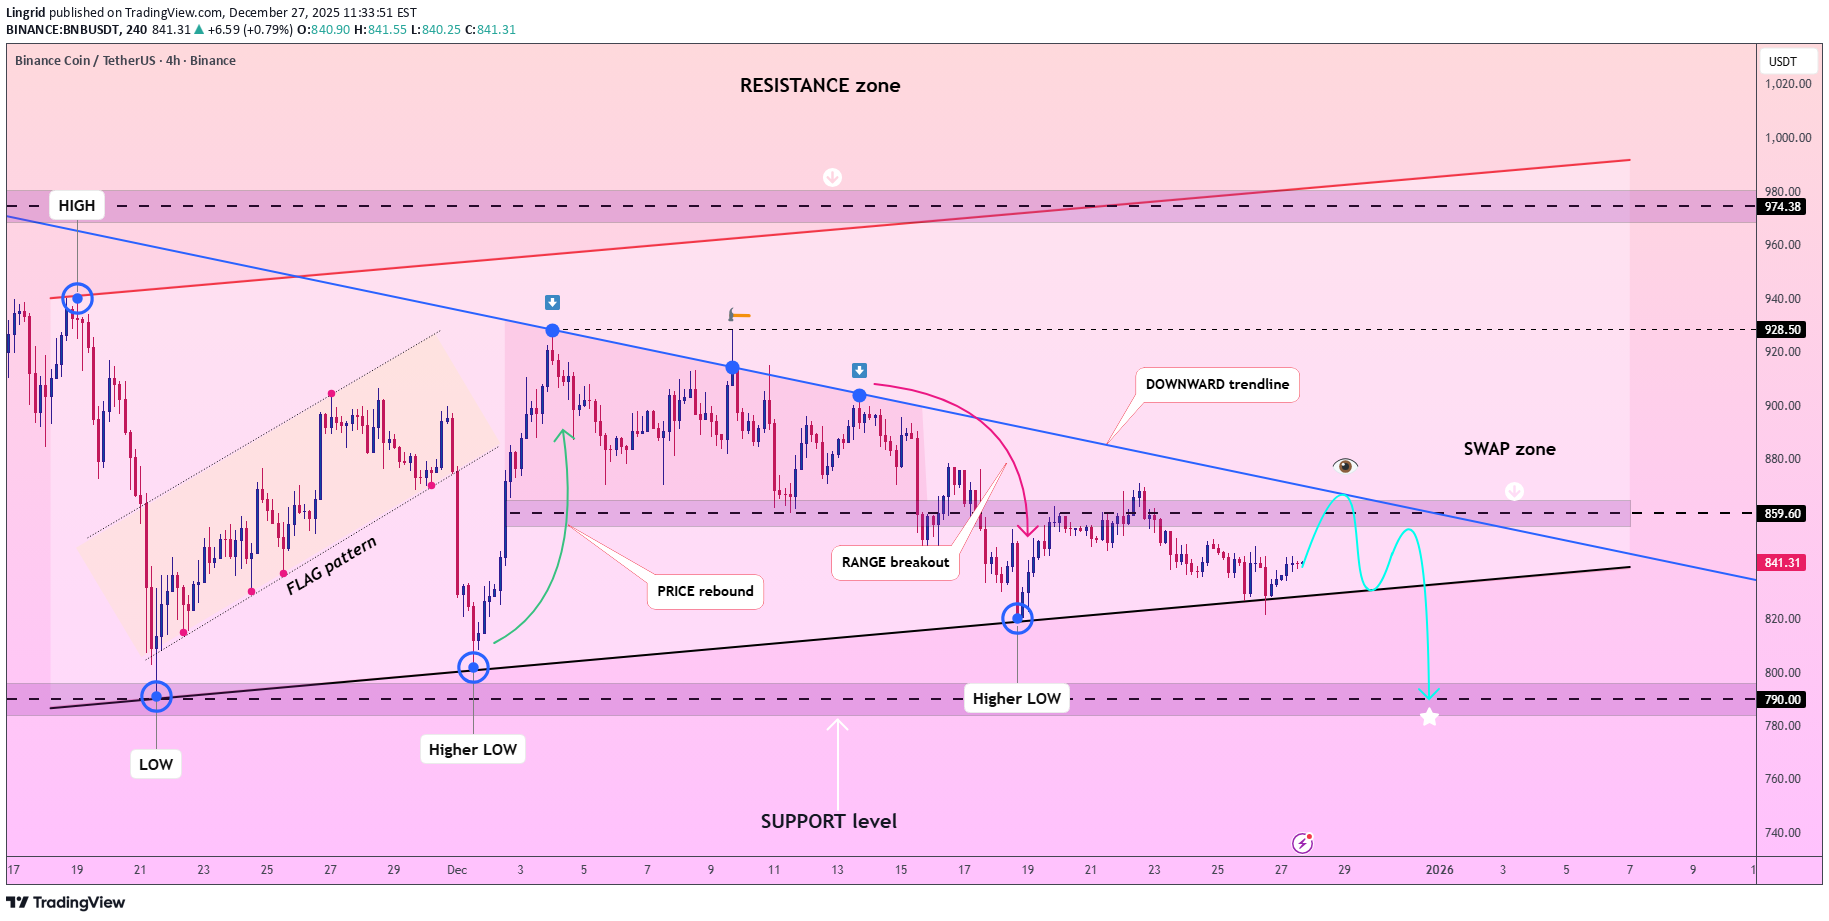
BNBUSDT perfectly played out my previous trading idea . Price is trading below a descending trendline while struggling to reclaim the swap zone, suggesting sellers still control the short-term structure. Recent rebounds appear corrective rather than impulsive, with price repeatedly failing to hold above the broken range. The overall flow continues to favor distribution inside a pressured channel. If the swap zone around 860–870 acts as resistance again, price could slip back below the channel floor, opening room toward the 790 support band where previous demand was formed. Momentum remains fragile, and a rejection here may accelerate downside continuation. ➡️ Primary scenario: rejection from 860–870 → breakdown toward 790. ⚠️ Risk scenario: sustained acceptance above 870 weakens bearish pressure and shifts focus back toward 920. If this idea resonates with you or you have your own opinion, traders, hit the comments. I’m excited to read your thoughts!
Disclaimer
Any content and materials included in Sahmeto's website and official communication channels are a compilation of personal opinions and analyses and are not binding. They do not constitute any recommendation for buying, selling, entering or exiting the stock market and cryptocurrency market. Also, all news and analyses included in the website and channels are merely republished information from official and unofficial domestic and foreign sources, and it is obvious that users of the said content are responsible for following up and ensuring the authenticity and accuracy of the materials. Therefore, while disclaiming responsibility, it is declared that the responsibility for any decision-making, action, and potential profit and loss in the capital market and cryptocurrency market lies with the trader.