
HYPE
Hyperliquid
| تریدر | نوع سیگنال | حد سود/ضرر | زمان انتشار | مشاهده پیام |
|---|---|---|---|---|
 MadWhaleRank: 729 | خرید | حد سود: ۵۶ حد ضرر: تعیین نشده | 10/26/2025 | |
 unichartzRank: 1059 | خرید | حد سود: تعیین نشده حد ضرر: تعیین نشده | 10/25/2025 | |
 Richtv_officialRank: 1513 | خرید | حد سود: تعیین نشده حد ضرر: تعیین نشده | 10/31/2025 | |
 CryptoNuclearRank: 2198 | خرید | حد سود: ۵۱ حد ضرر: تعیین نشده | 10/29/2025 | |
 CryptoAnalystSignalRank: 2519 | خرید | حد سود: تعیین نشده حد ضرر: تعیین نشده | 10/31/2025 |
Price Chart of Hyperliquid
سود 3 Months :
خلاصه سیگنالهای Hyperliquid
سیگنالهای Hyperliquid
Filter
Sort messages by
Trader Type
Time Frame
Richtv_official
تحلیل HYPEUSDT: منتظر فرصت خرید در کجای این منطقه حیاتی؟
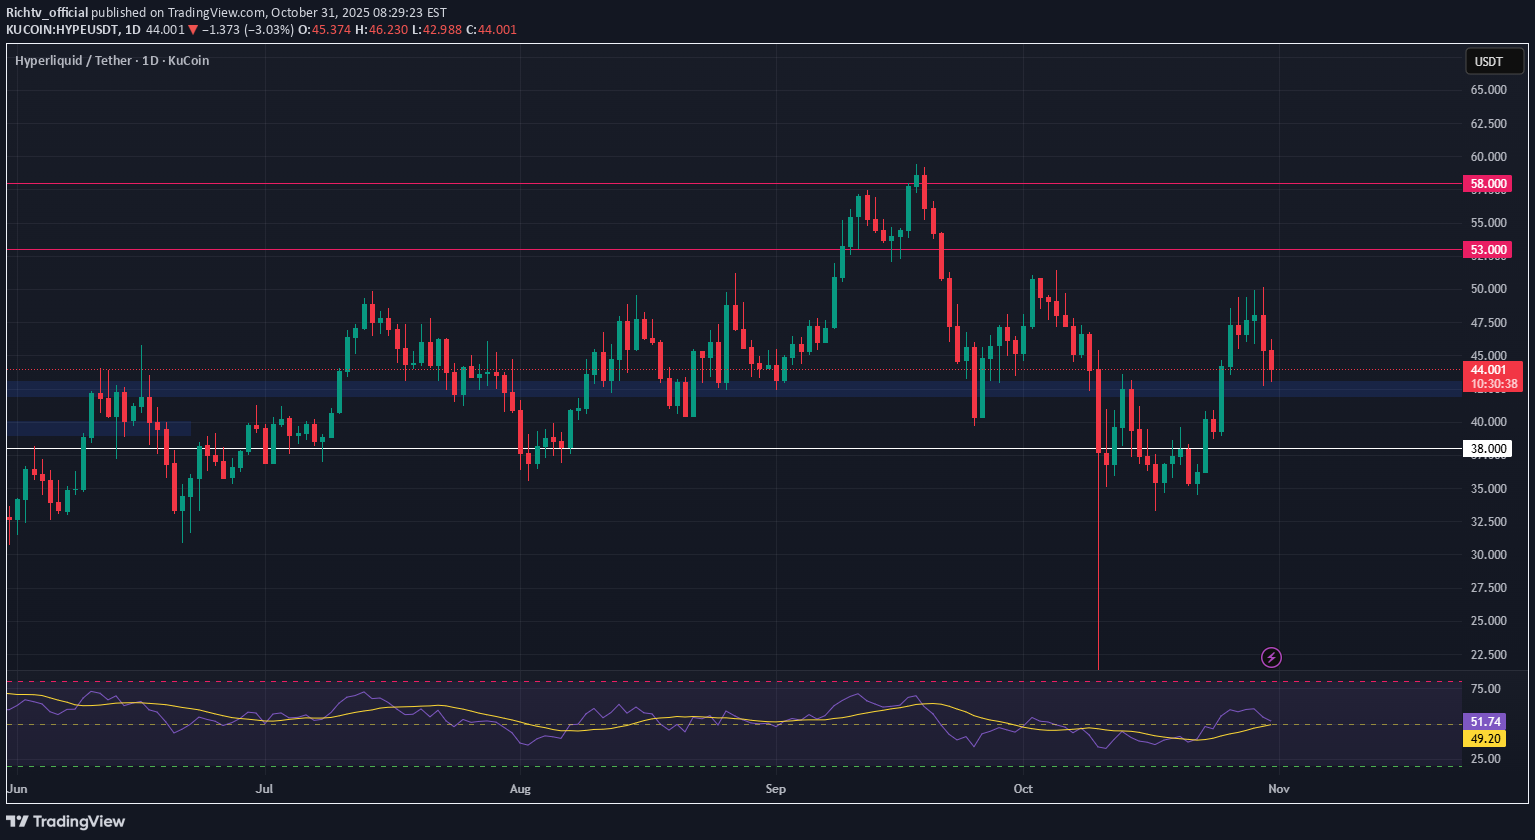
HYPEUSDT is currently pulling back and heading toward a major support area at $42–$43. This zone has historically provided strong buying interest and could act as a platform for a reversal. We’re closely watching this level for a potential long swing trade opportunity. 🛠 Trade Setup Entry Zone: $42 – $43 (Support Area) Take Profit Levels: • TP1: $53 • TP2: $59 Stop Loss: $38 (Just below structure)

شانس بالای فروش در هایپرلیکوئید: استراتژی ورود با ریسک عالی!
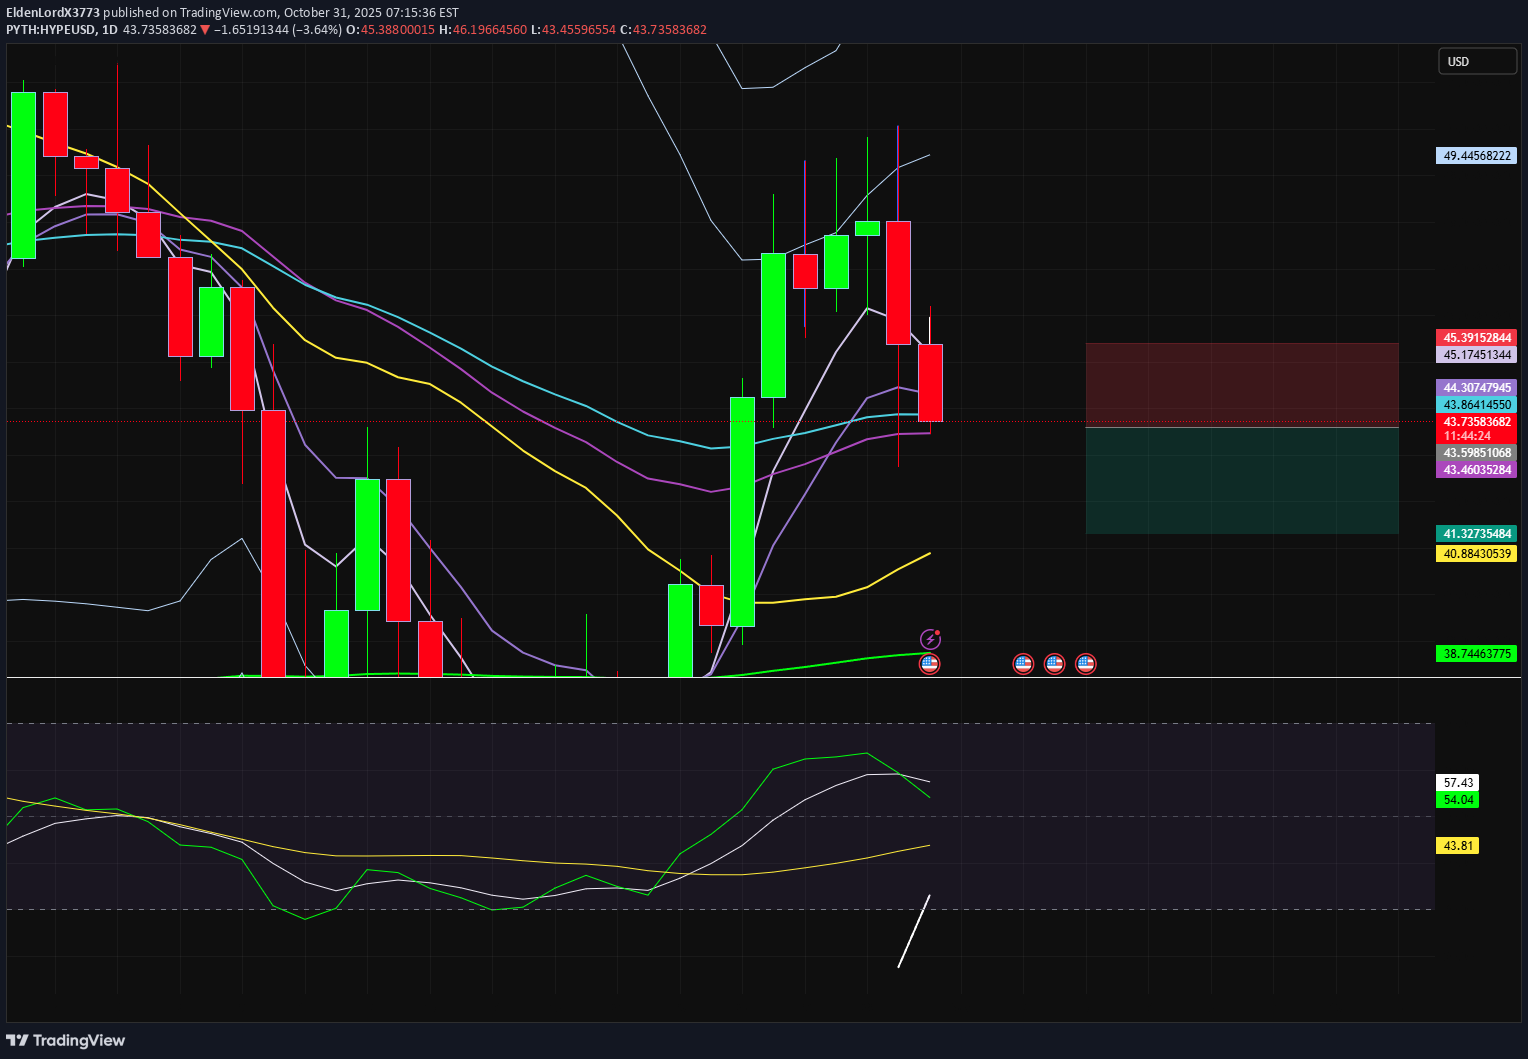
high confluence high probability short with decent R/R : % success ratio. coming back to test the 20sma on the daily :)
CryptoAnalystSignal
تحلیل HYPE/USDT: هدف بعدی 49 دلار، آماده انفجار صعودی؟
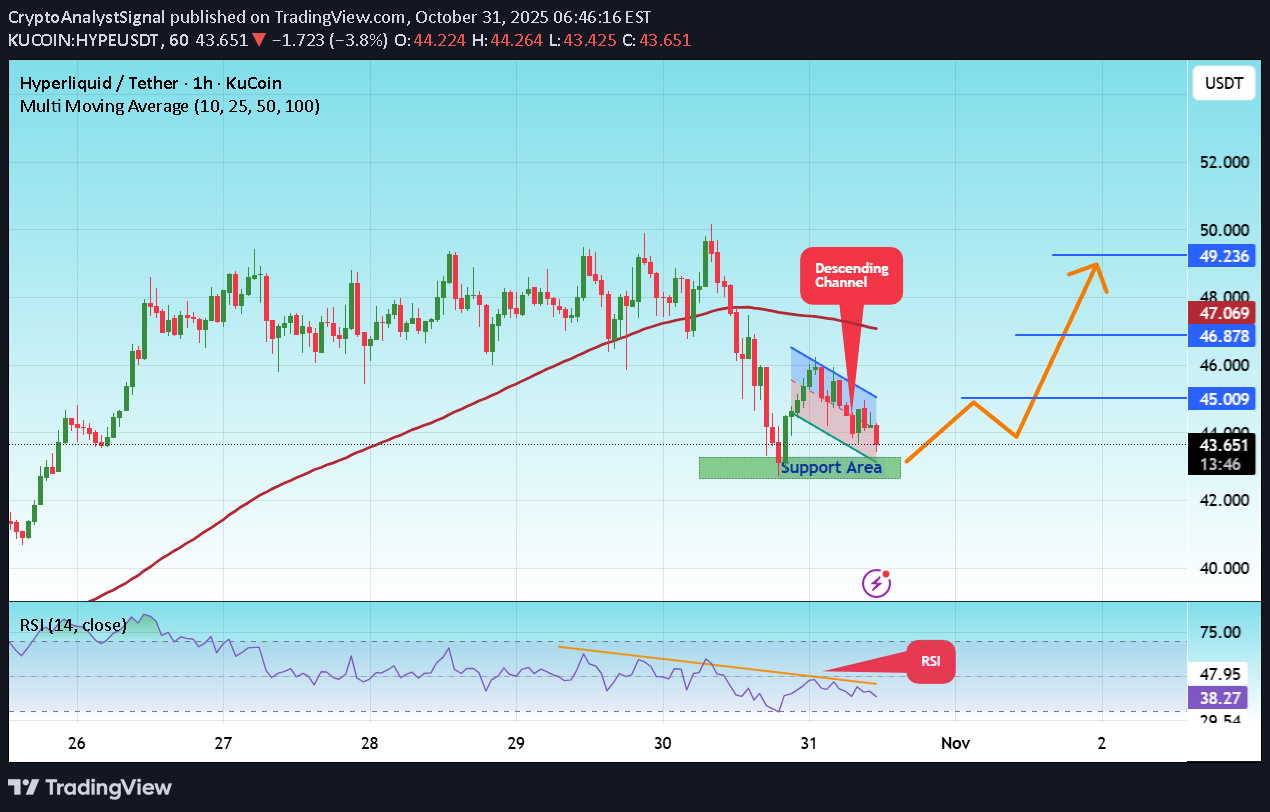
#HYPE The price is moving in a descending channel on the 1-hour timeframe and is expected to break out and continue upwards. We have a trend to stabilize above the 100-period moving average again. We have a downtrend on the RSI indicator, which supports an upward move if it breaks above it. We have a key support zone in green that pushed the price higher at 43.00. Entry price: 43.72 First target: 45.00 Second target: 46.87 Third target: 49.23 For risk management, don't forget your stop-loss and money management. The stop-loss is below the green support zone. Upon reaching the first target, take some profit and then change your stop-loss order to an entry order. For any questions, please comment. Thank you.

SwallowAcademy
هایپرلیکوید (HYPE): در انتظار تصمیم بازار؛ شکاف صعودی یا نزولی CME؟
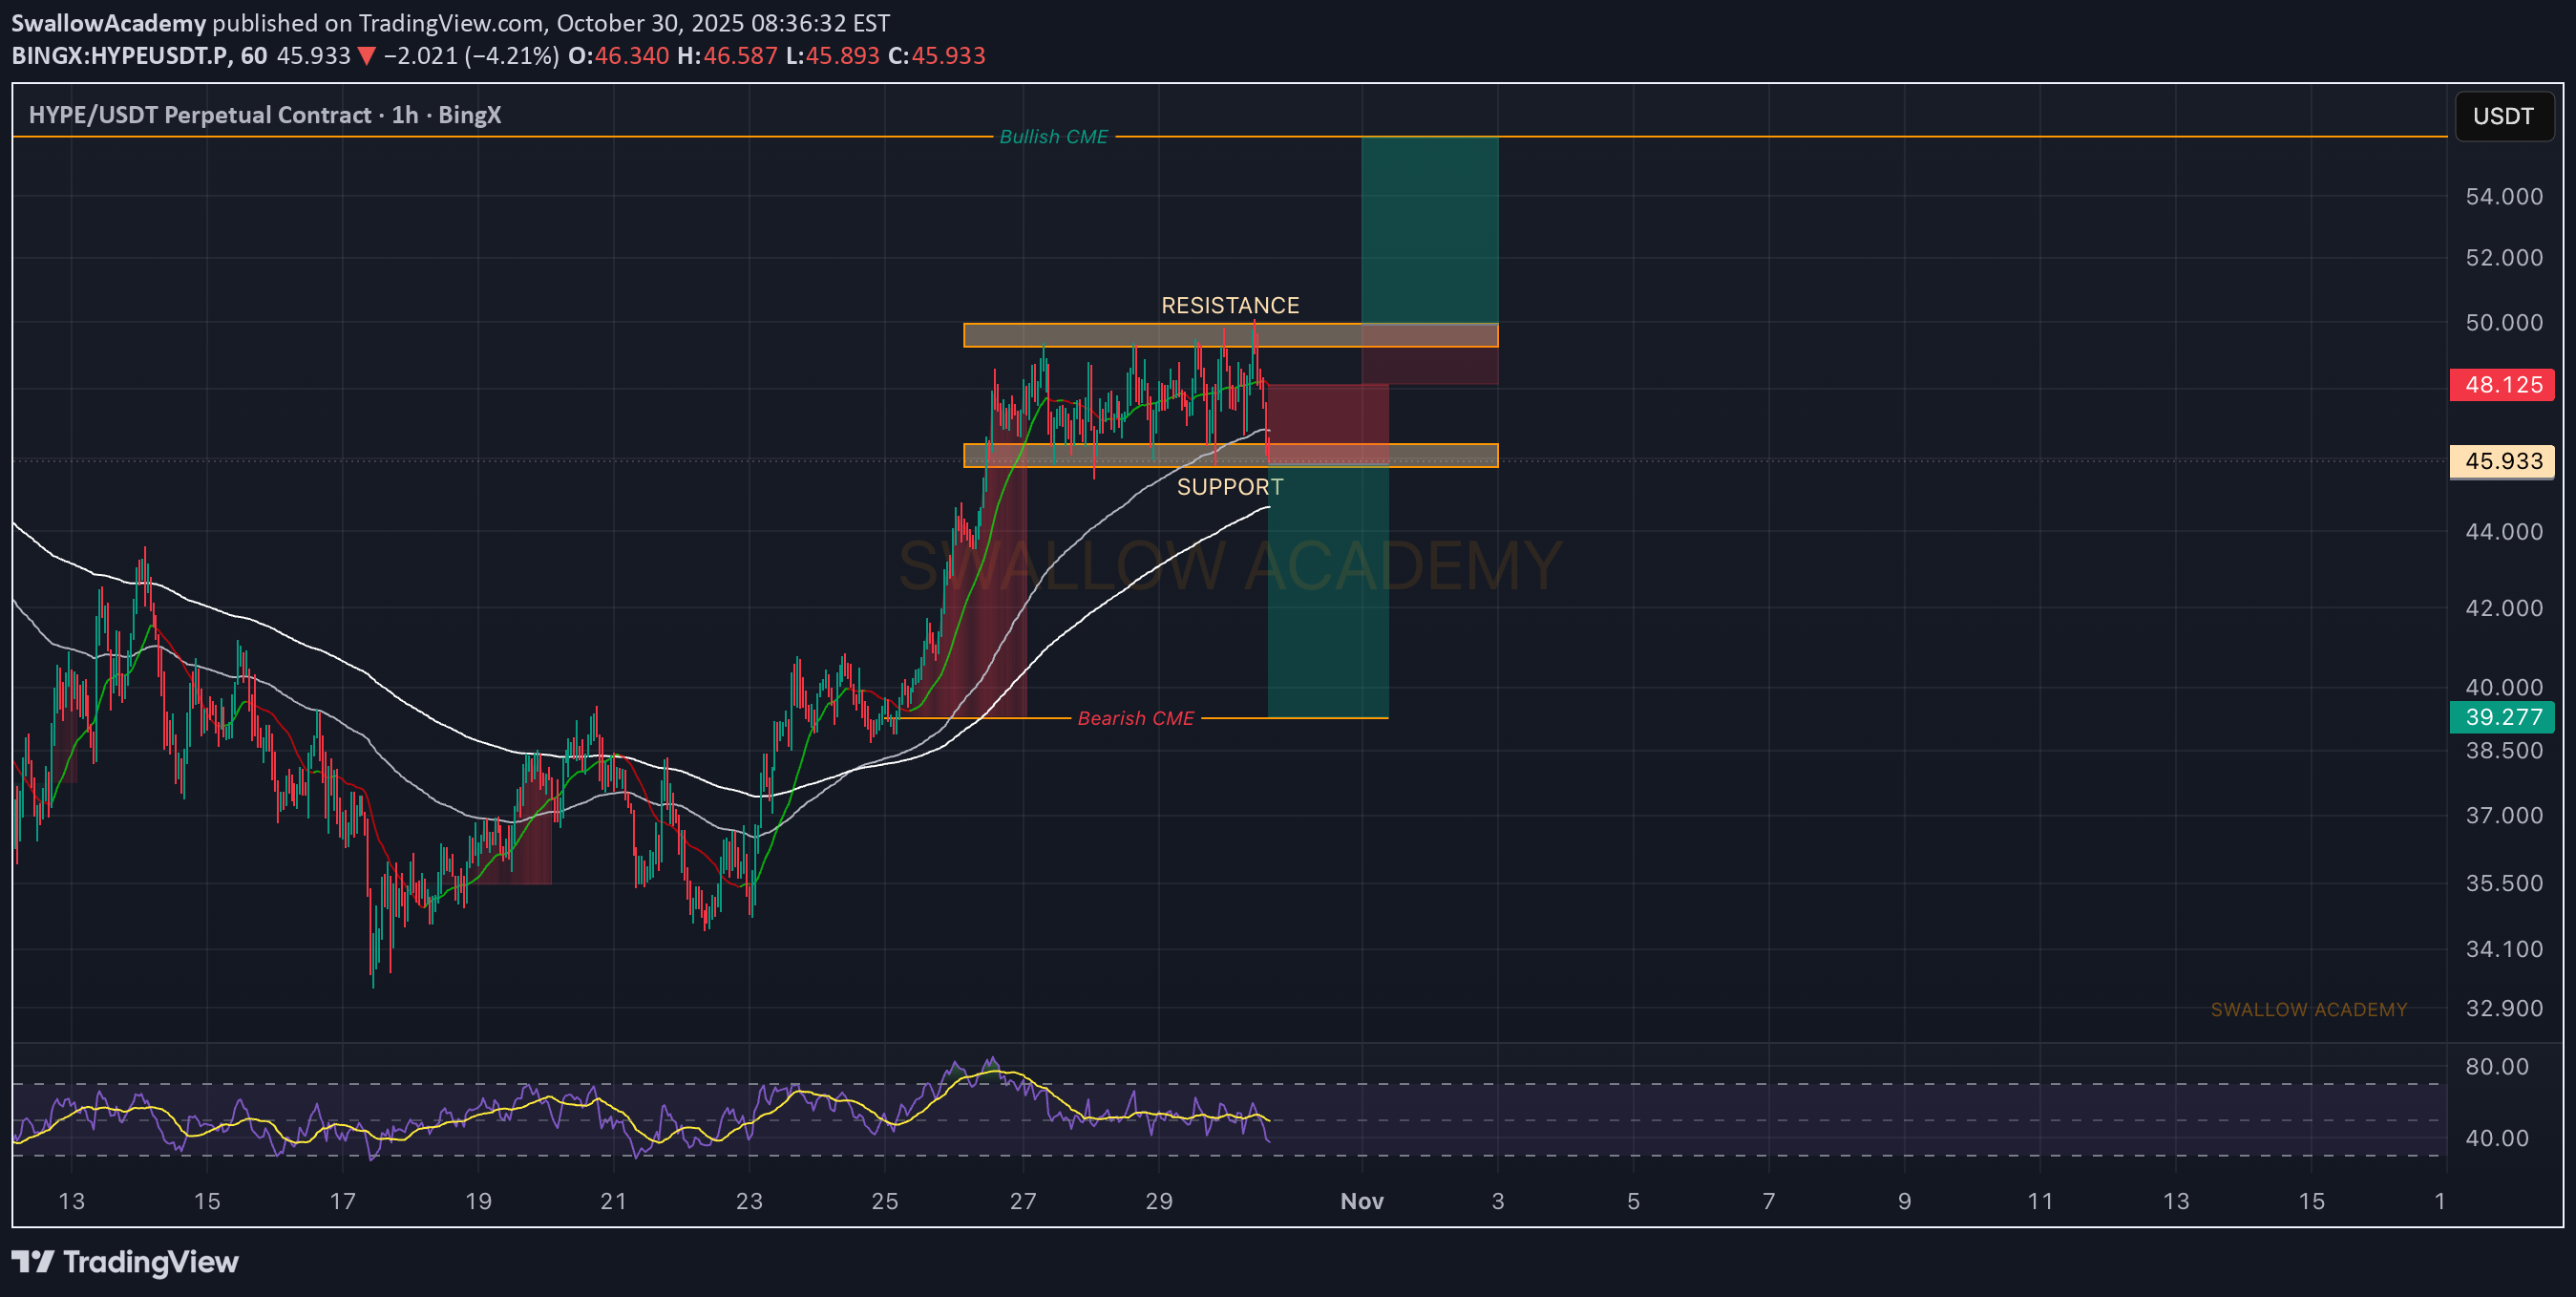
HYPE is sitting right inside the range between support and resistance, making this a clear two-way setup. What we want to see next is confirmation — either a clean breakout above resistance for continuation or a breakdown below support for a deeper move toward the bearish CME. Until then, patience is key; we let the market decide the direction before stepping in. Swallow Academy

RTED_Investing
ریزش قریبالوقوع HYPE/USDT: هشدار به فروشندگان پس از شکست در مقاومت ۵۰,۰۰۰ دلاری!
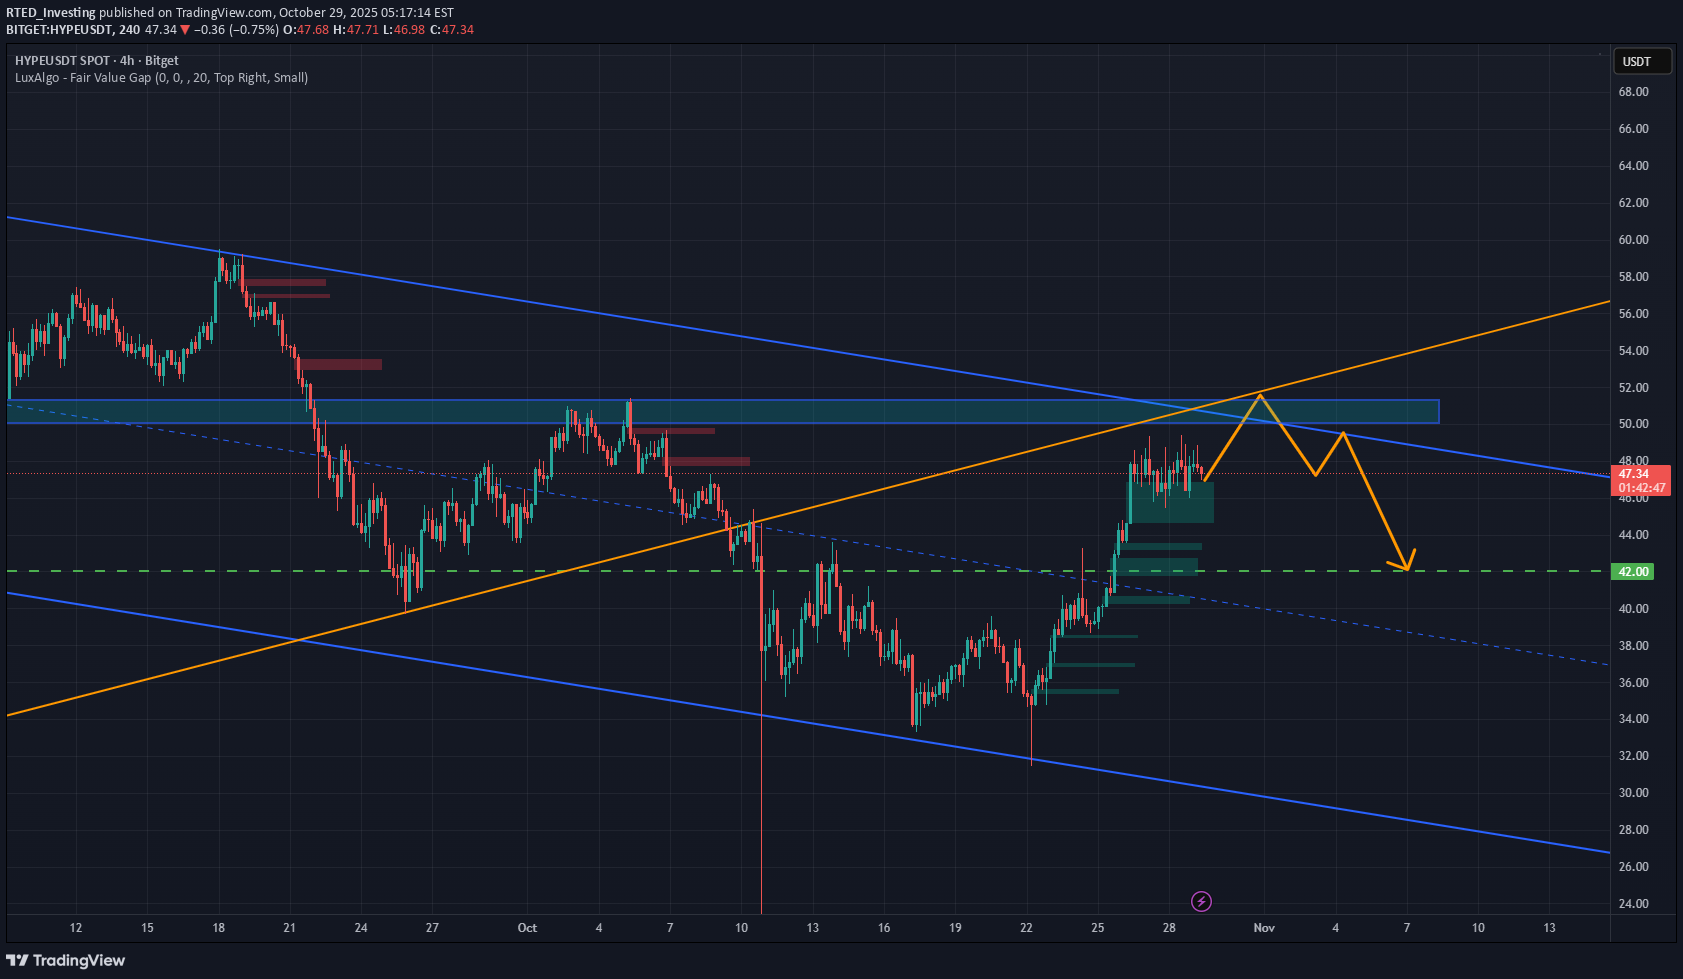
HYPE/USDT is facing rejection near the 50.000 resistance zone, showing signs of weakening momentum after a strong rebound. Price remains within a downward structure, and the recent compression pattern points to buyer exhaustion. If the pair fails to hold above 47.000, a drop toward the 42.000 support zone becomes more likely. Sellers remain in control as long as price stays below the 50.000 resistance level.

Lingrid
تحلیل تکنیکال HYPEUSDT: فرصت فروش در محدوده مقاومت 50 دلار!
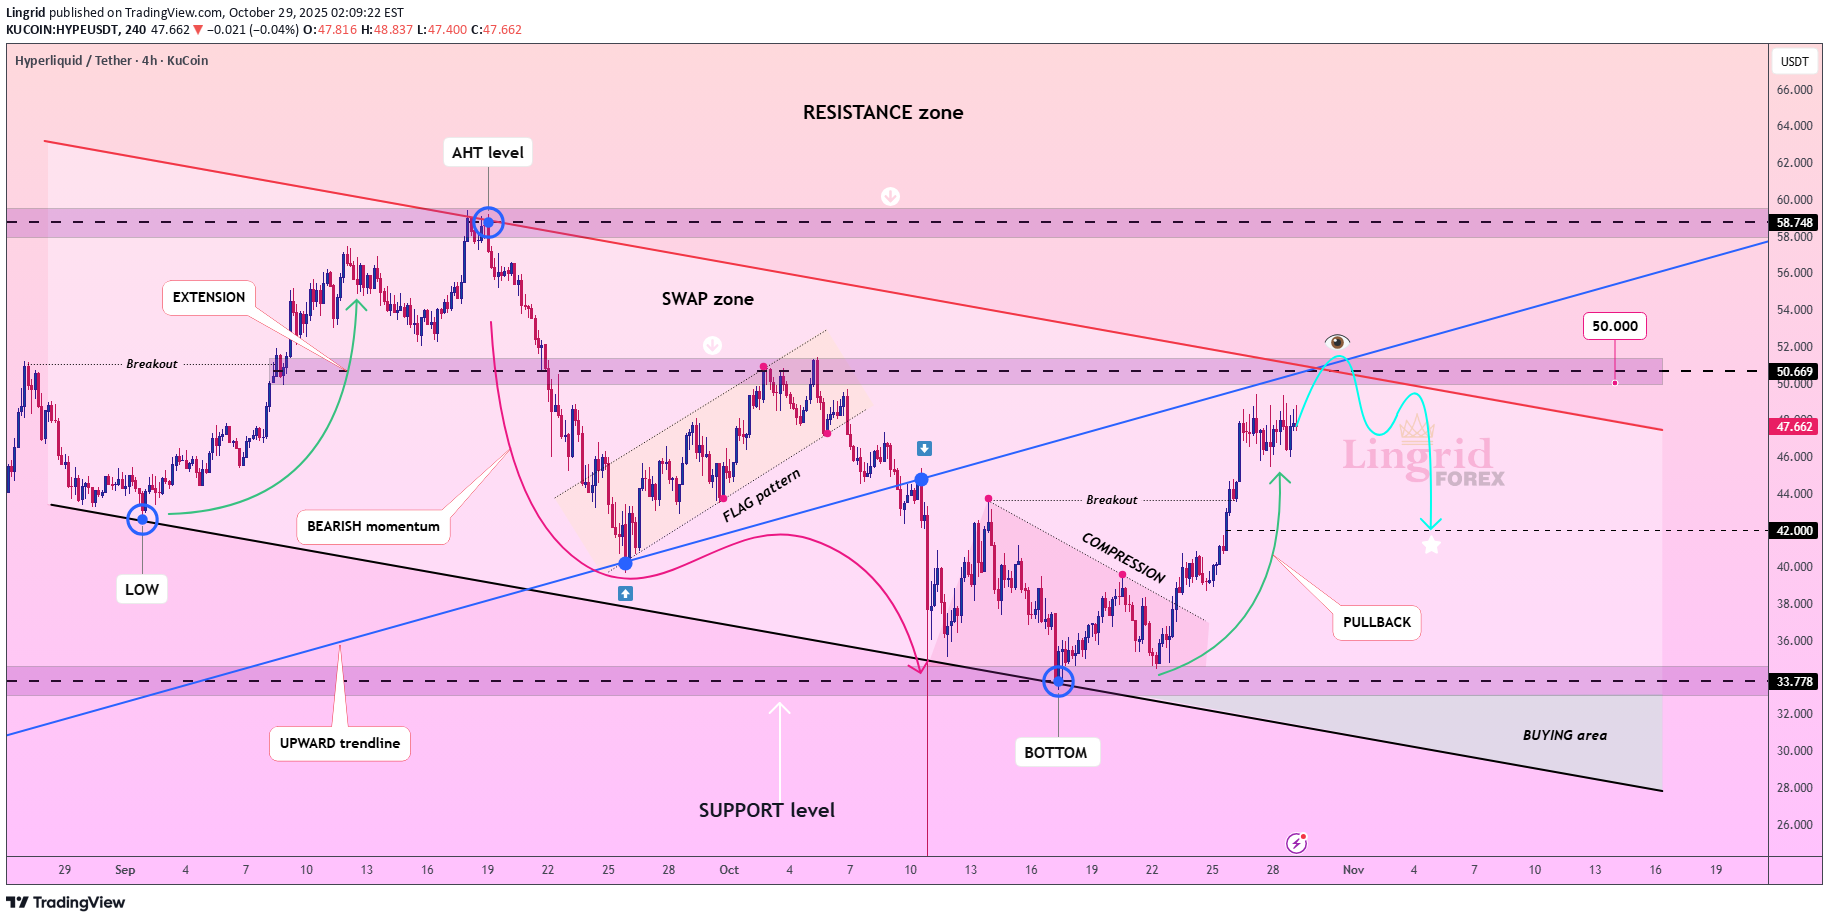
HYPEUSDT is facing rejection near the 50.000 resistance zone, indicating weakening momentum after a strong rebound. Price action remains capped within a downward structure, with the recent compression pattern suggesting exhaustion of buyers. A failure to hold above 47.000 could accelerate the decline toward the 42.000 support zone. Sellers maintain control while the pair trades below the 50.00 resistance. ⚠️ Risks: A breakout above 50.000 could invalidate the short setup. Positive macro or crypto market sentiment may fuel short covering. Lower liquidity conditions could lead to false downside breaks. If this idea resonates with you or you have your own opinion, traders, hit the comments. I’m excited to read your thoughts!
CryptoNuclear
HYPE/USDT: آیا پس از شکست، منطقه 43.5-40.5 آزمون مجدد میشود؟ (کلید صعود بعدی؟)
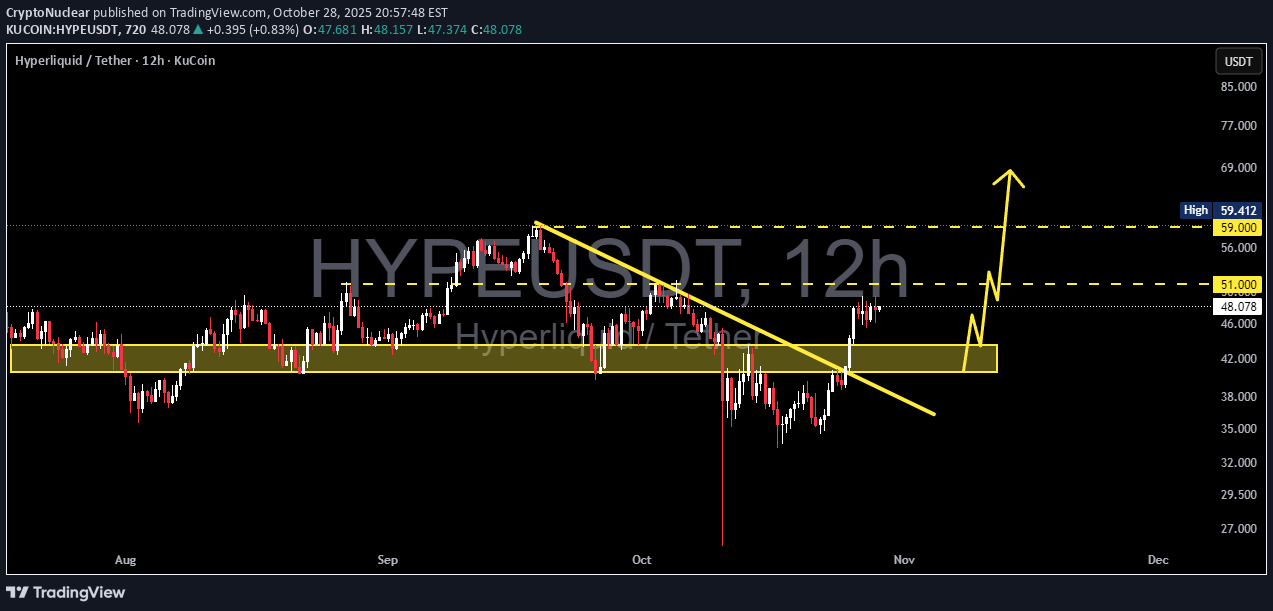
Overview After weeks of persistent selling pressure and a consistent lower-high structure, HYPE/USDT has finally shown signs of life — a clean breakout above the major downtrend line that has capped price action since early October. This breakout signals a psychological shift in market sentiment, moving from fear-driven selling into an early optimism phase, where smart money begins accumulating before the retail wave arrives. The 43.5–40.5 zone has acted as a crucial battlefield between buyers and sellers, now transforming into a key demand base — the foundation of a potential mid-term trend reversal. --- Pattern & Structure Analysis Primary pattern: Descending trendline breakout followed by a minor retest above structural support. Context: After printing a panic wick in early October, price established a higher low and then broke through the descending line of resistance. Technical implication: Bearish momentum is fading, while bullish pressure is gradually strengthening — an early indication of trend reversal. --- Bullish Scenario — Momentum Reignited If price holds above 47–48 USDT, the structure can evolve into a bullish continuation pattern with clear upside potential. A confirmed breakout above 51 USDT would likely trigger the next expansion phase toward 59.4 USDT, aligning with the previous swing high and liquidity pocket. Bullish Confirmation Signals: 12-hour candle closes above 48–51 with increasing volume. Successful retest around 46–47 without falling back below the demand zone. Upside Targets: TP1: 51.00 (initial breakout zone). TP2: 59.40 (major resistance / previous high). TP3 (extended target): 65+ if momentum accelerates. --- Bearish Scenario — False Breakout Trap If the breakout fails to sustain and 51 USDT acts as a strong rejection point, the move may turn into a liquidity sweep — a classic bull trap. A breakdown below 43.5–40.5 would invalidate the bullish structure and expose downside risk toward 36–32 USDT. Bearish Confirmation: 12h candle closes below 43.5 with rising sell volume. Clean breakdown of 40.5 with no rebound — confirming continuation of the previous downtrend. --- Conclusion HYPE is currently at a critical transition zone — between the end of a prolonged downtrend and the potential start of a new bullish cycle. The 43.5–40.5 region remains the key battleground. If buyers defend this base and reclaim 51 with strength, HYPE could enter a momentum expansion phase toward its previous highs. Failure to hold this level, however, could send price back into extended consolidation. Trader’s focus: Watch the 47–51 USDT range for confirmation of strength, or wait for a clean retest and bounce from 43.5–40.5 for high-probability long setups. --- #HYPEUSDT #Hyperliquid #CryptoBreakout #TechnicalAnalysis #PriceAction #SupportResistance #SmartMoneyConcepts #BreakoutTrading #TrendReversal #CryptoAnalysis

pullbacksignal
سیگنال خرید فوری هایپرلِجر (HYPEUSDT): فرصت صعود کوتاه مدت با تحلیل تکنیکال کلاسیک
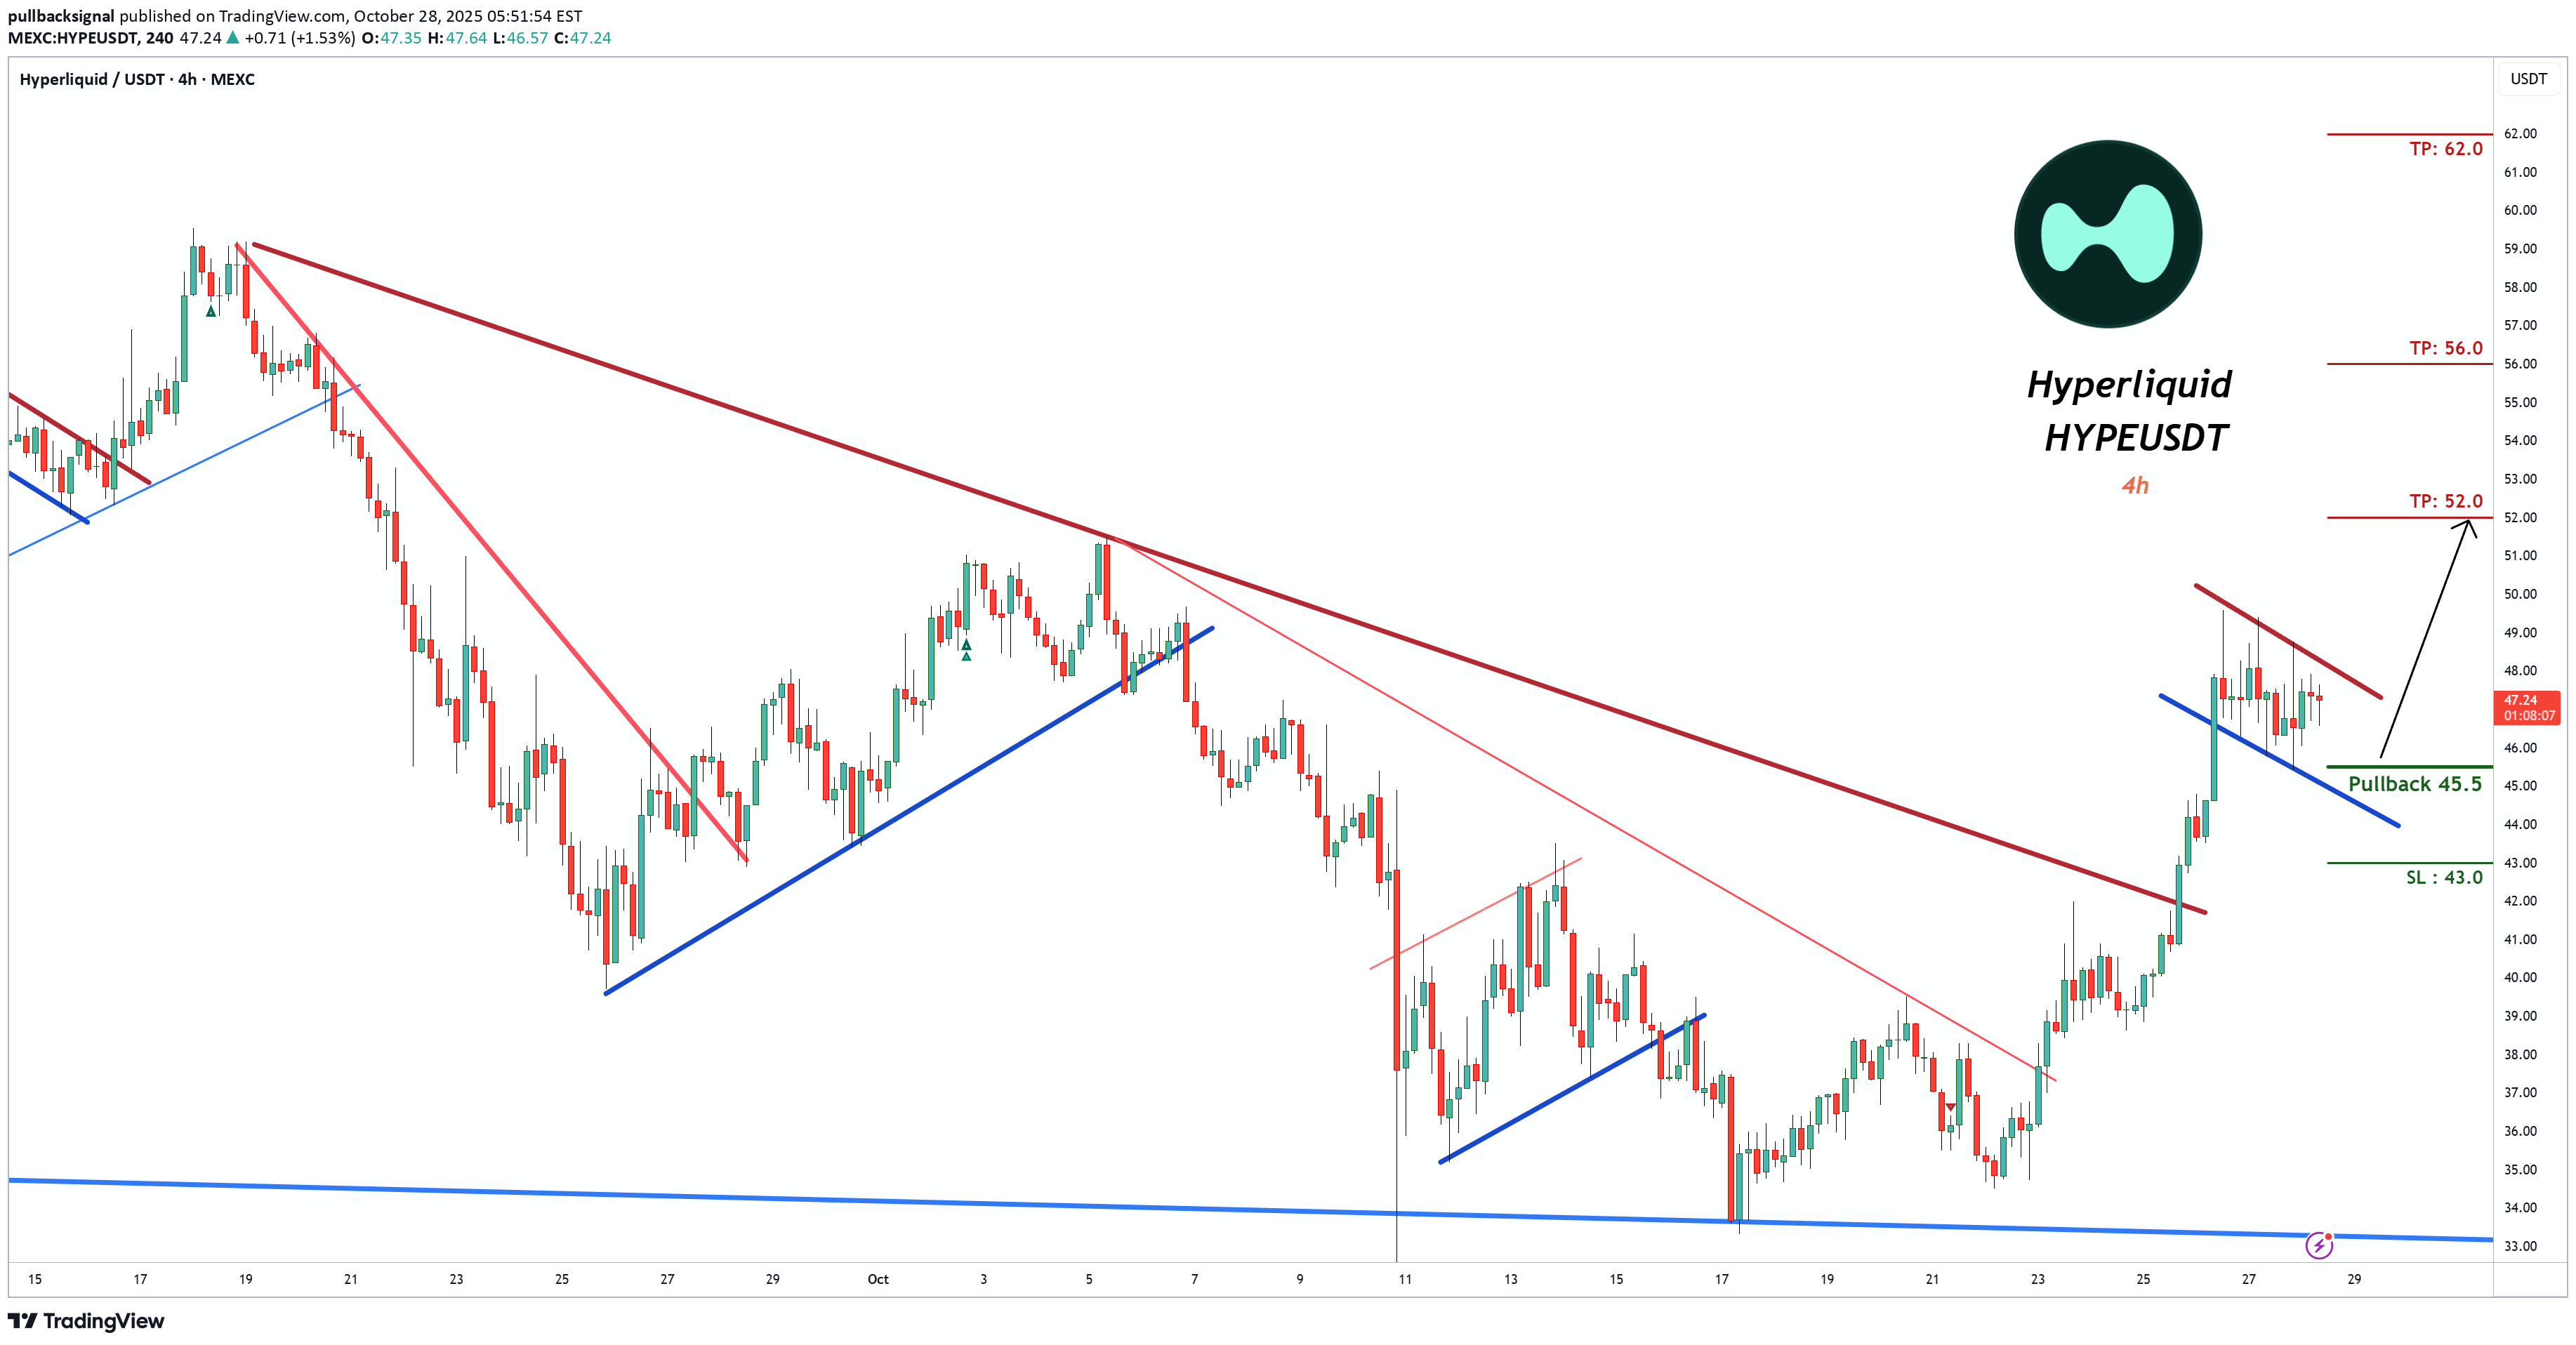
Trading Setup: A Trading Signal is seen in the HYPEUSDT Hyperliquid (Futures) (4h) Traders can open their Buy Trades NOW ⬆️Buy now or Buy on 45.5 ⭕️SL @ 43.0 🔵TP1 @ 52.0 🔵TP2 @ 56.0 🔵TP3 @ 62.0 What are these signals based on? Classical Technical Analysis Price Action Candlesticks Fibonacci RSI, Moving Average , Ichimoku , Bollinger Bands Risk Warning Trading Forex, CFDs, Crypto, Futures, and Stocks involve a risk of loss. Please consider carefully if such trading is appropriate for you. Past performance is not indicative of future results. If you liked our ideas, please support us with your likes 👍 and comments .

Mausty
سرمایهگذاری هیجانانگیز در HYPE: آیا این ارز دیجیتال، رابینهود آینده است؟
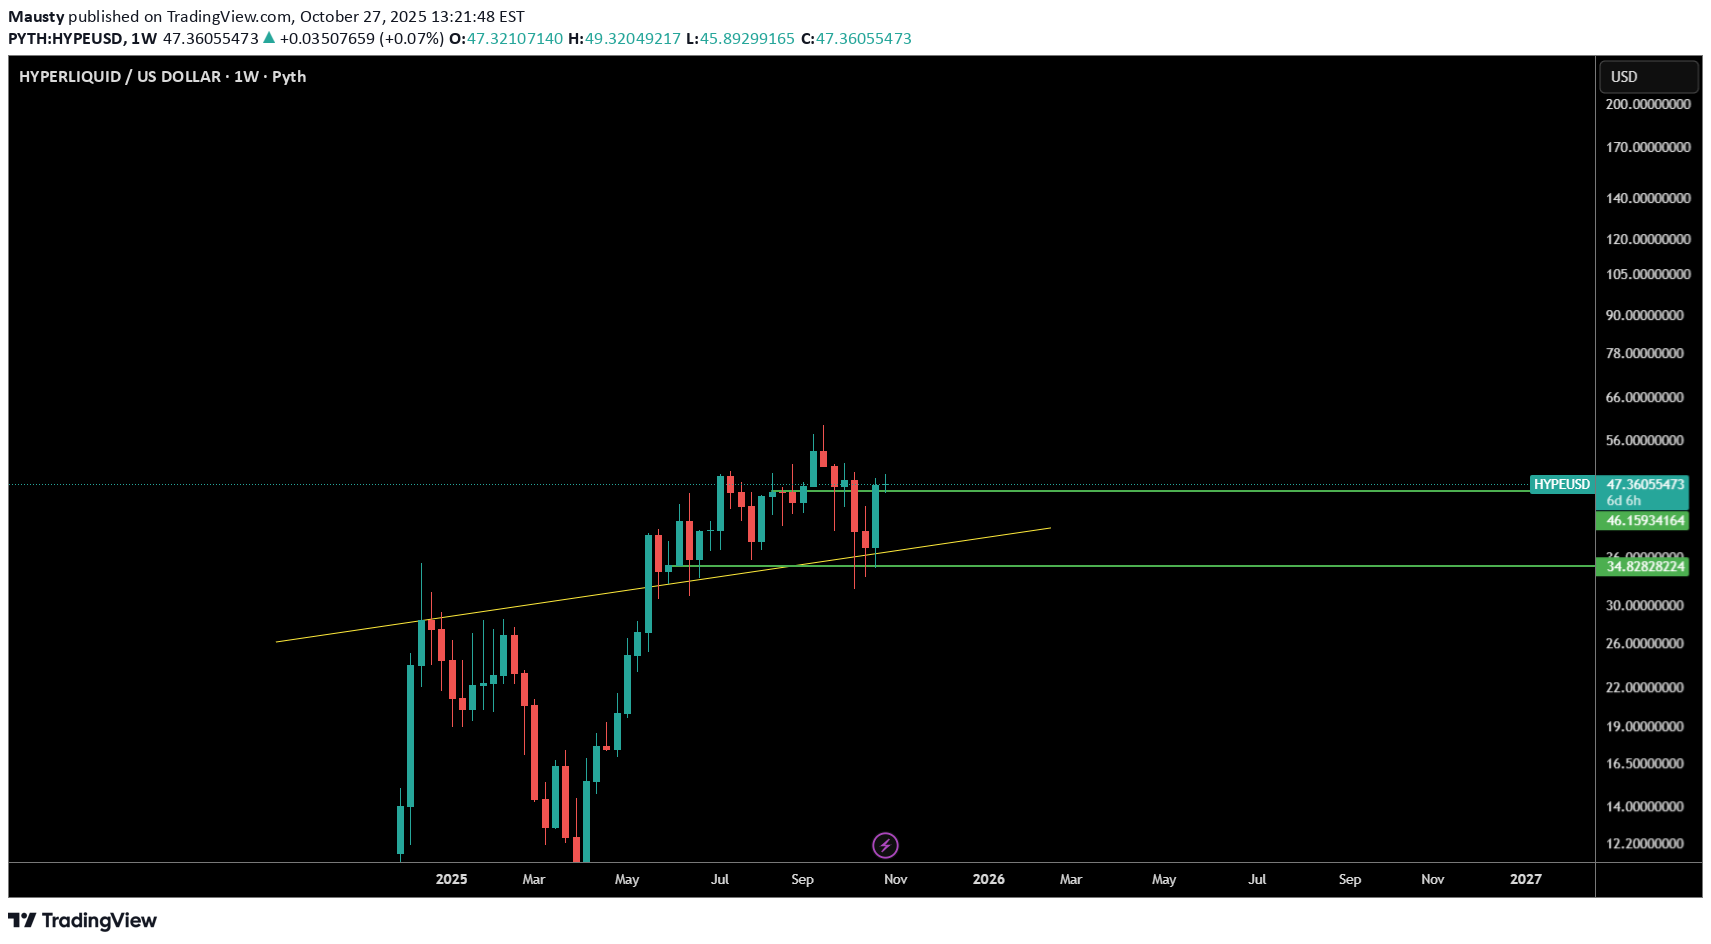
I took a position in HYPE this morning. The chart speaks for it self, it's respected levels and looks like it wants to go into price discovery. The fundamentals on this name are pretty fascinating, and i see a world where this is the Robinhood of crypto. I wouldn't even be surprised if HOOD acts as the front end for some hype offerings someday, 10x TSLA anyone? This is a small position for me (1%) and i may increase as the thesis plays out.

DEXWireNews
هایپرلیکویید رکورد زد! آیا این ارز به مرز ۱۰۰ دلار میرسد؟
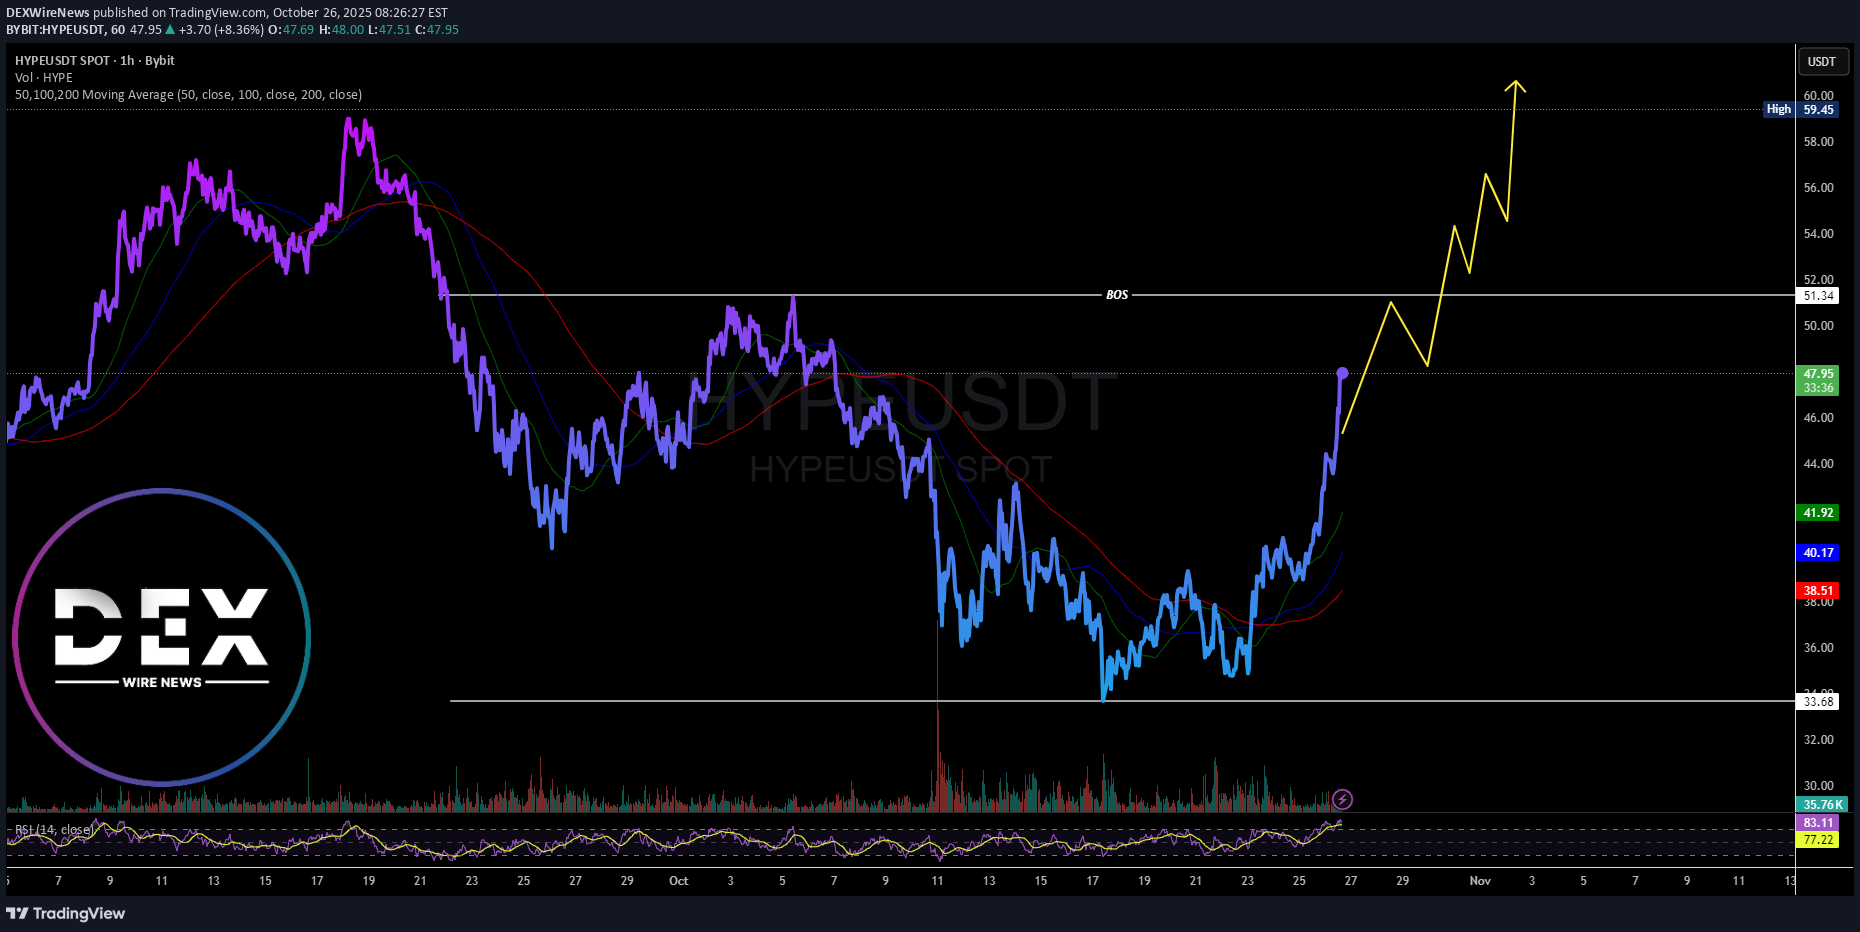
The price of the notable novel Layer 1 (L1) blockchain that is meticulously engineered from the ground up to optimize performance and scalability -Hyperliquid ( HYPE ) Spike 15% today gearing for a $100 move should the asset break the ceiling of the resistance point at $51. Hyperliquid's architecture boasts a fully on-chain order book, a rarity among decentralized exchanges (DEXs), which typically rely on off-chain order books to manage trades. This on-chain approach ensures greater transparency and security, as all transactions are verifiable on the blockchain. With the all time low of $3.20 recorded November last year and an all time high of $59.39 representing an ROI of +1392% this altcoin might just be the next big thing on the crypto space.
Disclaimer
Any content and materials included in Sahmeto's website and official communication channels are a compilation of personal opinions and analyses and are not binding. They do not constitute any recommendation for buying, selling, entering or exiting the stock market and cryptocurrency market. Also, all news and analyses included in the website and channels are merely republished information from official and unofficial domestic and foreign sources, and it is obvious that users of the said content are responsible for following up and ensuring the authenticity and accuracy of the materials. Therefore, while disclaiming responsibility, it is declared that the responsibility for any decision-making, action, and potential profit and loss in the capital market and cryptocurrency market lies with the trader.