
Wolftrader1337
@t_Wolftrader1337

What symbols does the trader recommend buying?
Purchase History
پیام های تریدر
Filter
Wolftrader1337
تحلیل بیت کوین (BTC/USDT): سطح کلیدی حمایت و مقاومت امروز برای حفظ قیمت ۹۳ هزار دلار
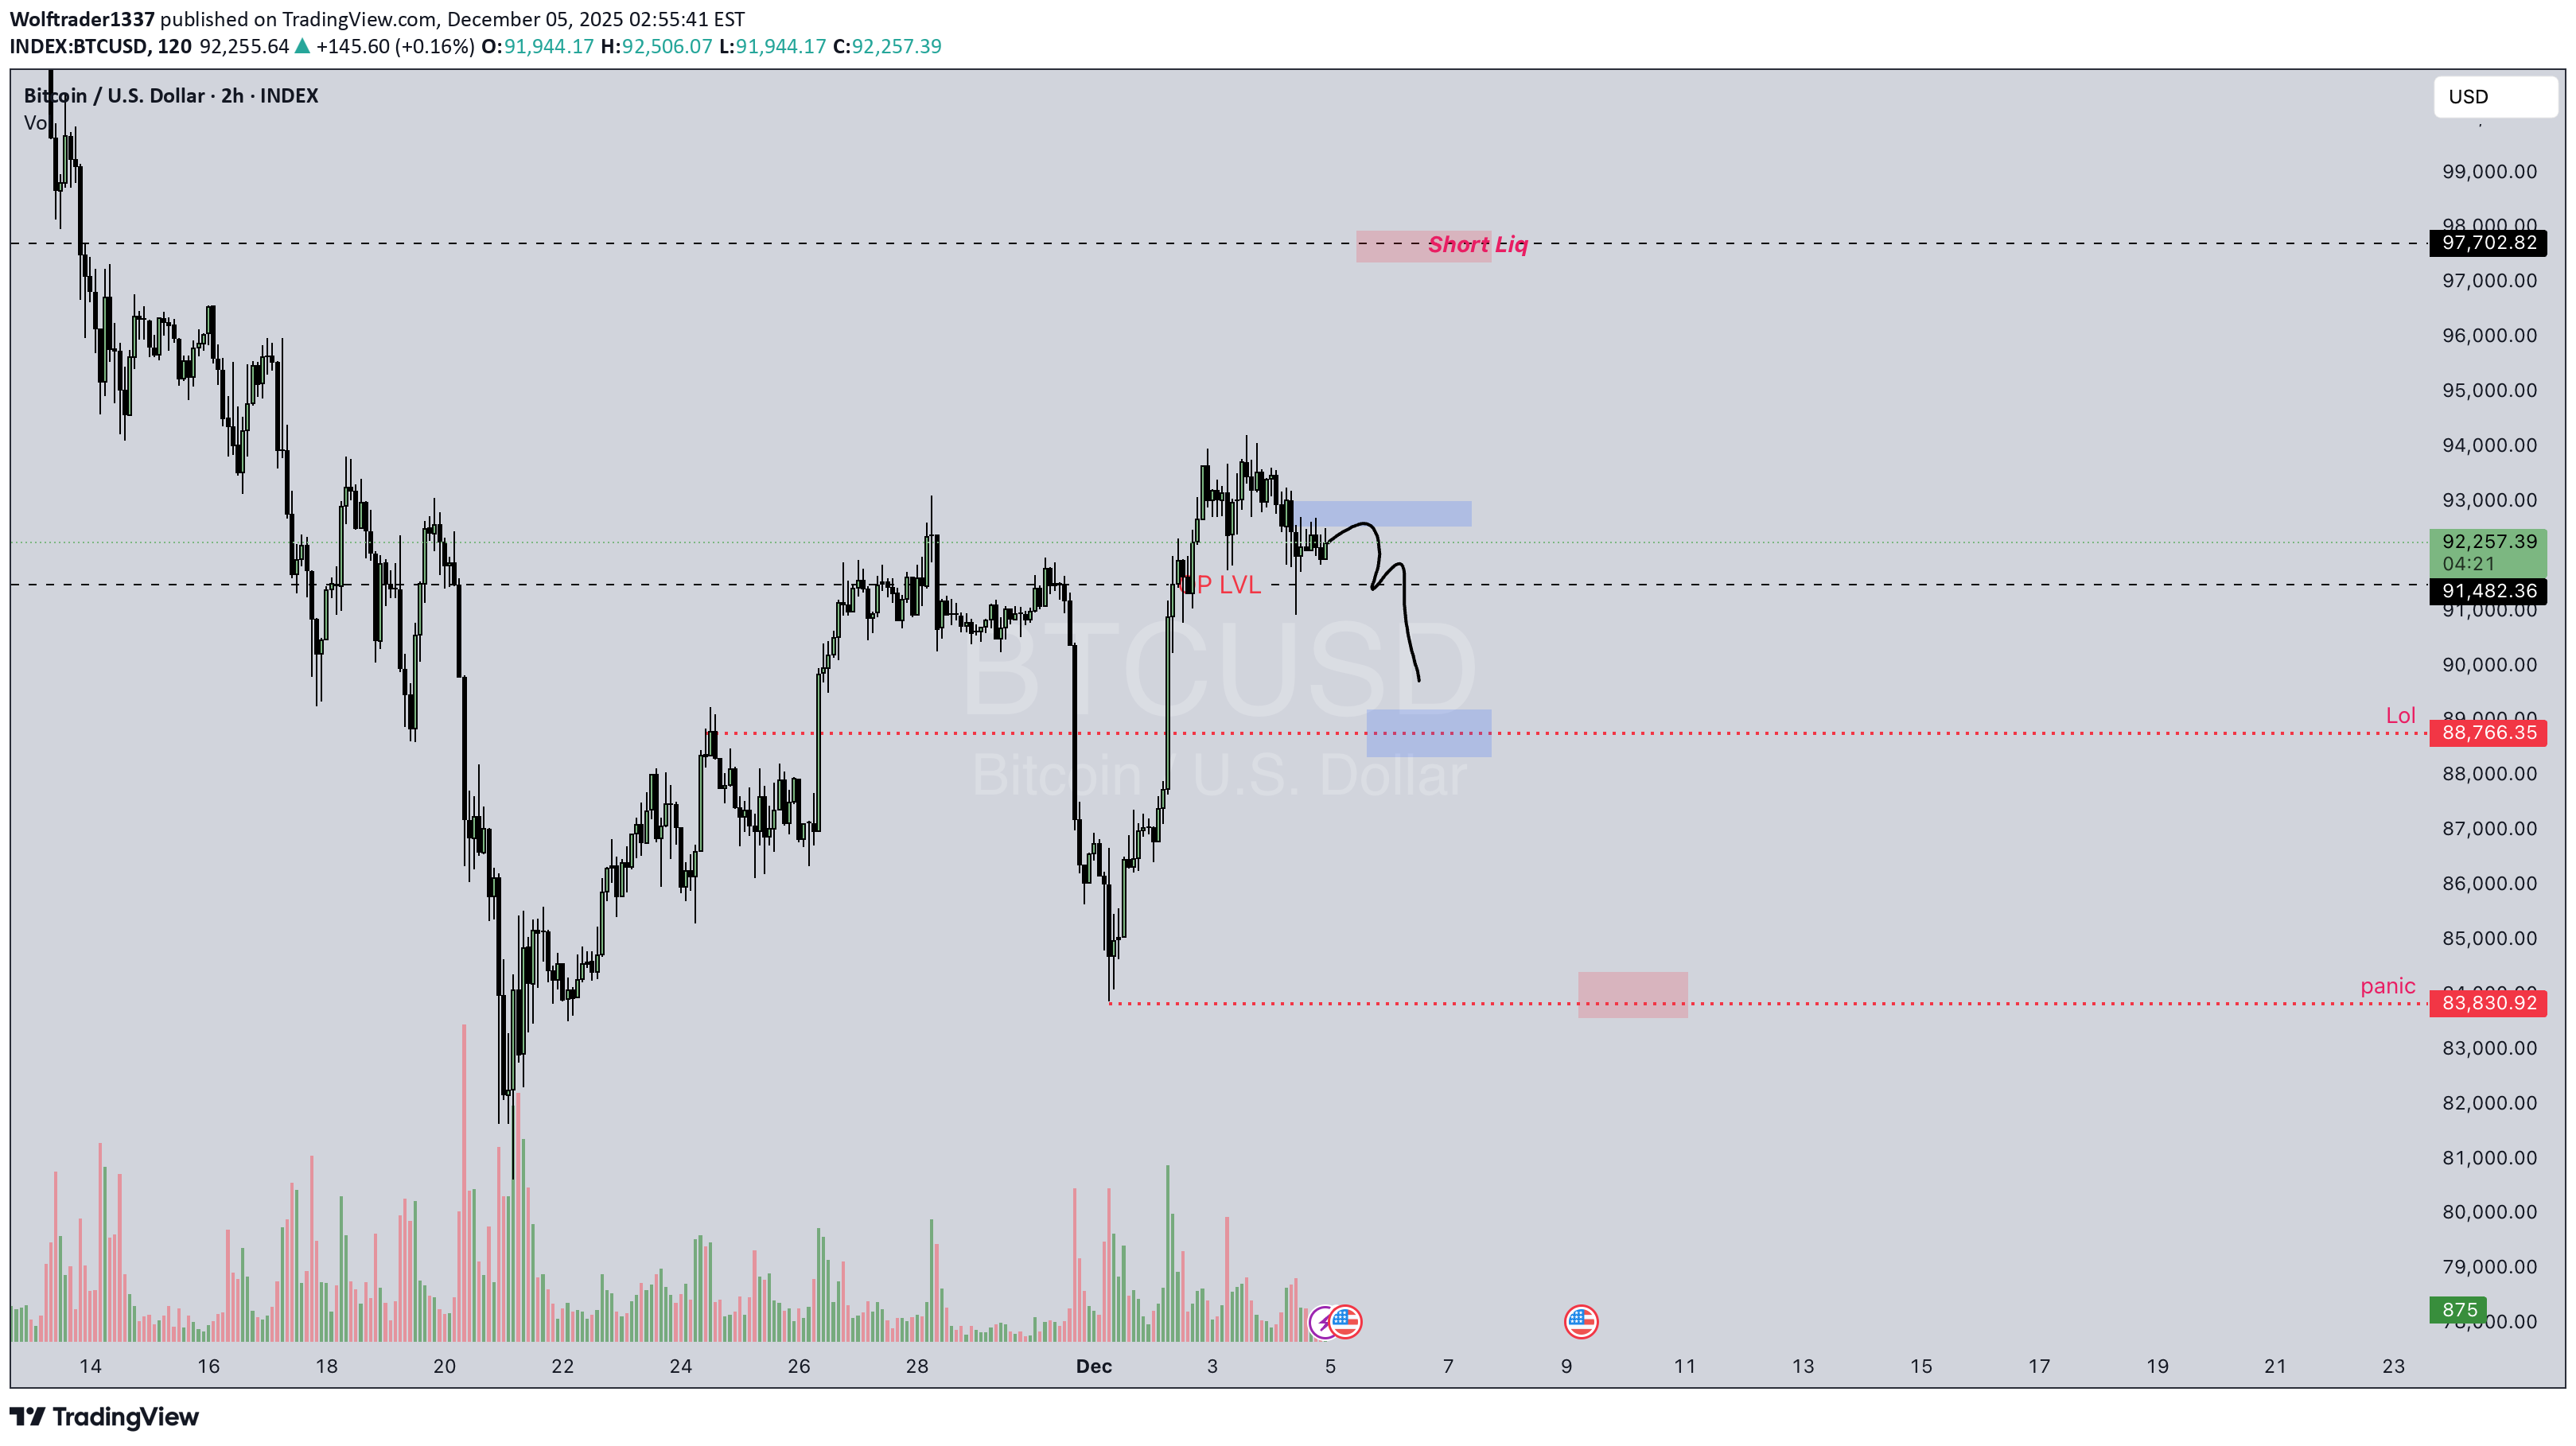
BTCUSD ### Bitcoin / US Dollar — 2h Chart (INDEX) - **Last Candle Data (approx.)**: Open ~**93,500.02**, current SELL pressure indicated. - **Volume**: **794** (appears low on scale). - **Key Price Levels (in USD)**: - **Resistance Zone**: 99,000 – 97,000 - **Near-term Resistance**: 95,000 – 96,000 - **Current Trading Range**: ~93,000 – 92,300 - **Support Levels**: 91,000 → 90,000 → 87,000 → 85,000 - **Major Support Zone**: 83,000 – 79,000 **Summary**: Bitcoin is trading in the lower half of the displayed range, with immediate support near **92,300–91,000** and resistance around **95,000–96,000**. Volume is relatively low on this timeframe. Watch for a break above 96,000 for bullish momentum or a drop below 91,000 for further downside. --- **Disclaimer**: This is technical observation, not financial advice. Cryptocurrency trading carries risk. Always do your own research.
Wolftrader1337
آیا EDEN/USDT در آستانه انفجار است؟ تحلیل کلیدی ۰.۳۳۶ برای صعود یا سقوط!

EDENUSDT ### 🔍 **Chart Overview** * **Pattern:** Falling wedge / descending channel — typically a *potential reversal pattern*. * **Key Level:** Around **0.336** (marked “Need to hold above that line”). * **Current Price:** ~0.33 USDT. --- ### 📈 **Bullish Scenario** * If price **holds above 0.336** and confirms support, it could **break the wedge** upward. * Possible targets: * **First:** 0.38 * **Next:** 0.42–0.46 * Volume confirmation is important — breakout with low volume may be fake. --- ### 📉 **Bearish Scenario** * If it **fails to hold 0.336** and drops below the lower red line → * Next downside zones: **0.30 → 0.27** * Could continue drifting until new support forms. --- ✅ **In short (not financial advice):** > OpenEden is sitting at a key support. Holding above **0.336** = bullish bounce likely. Losing it = short-term bearish continuation.
Wolftrader1337
Btc / Usdt
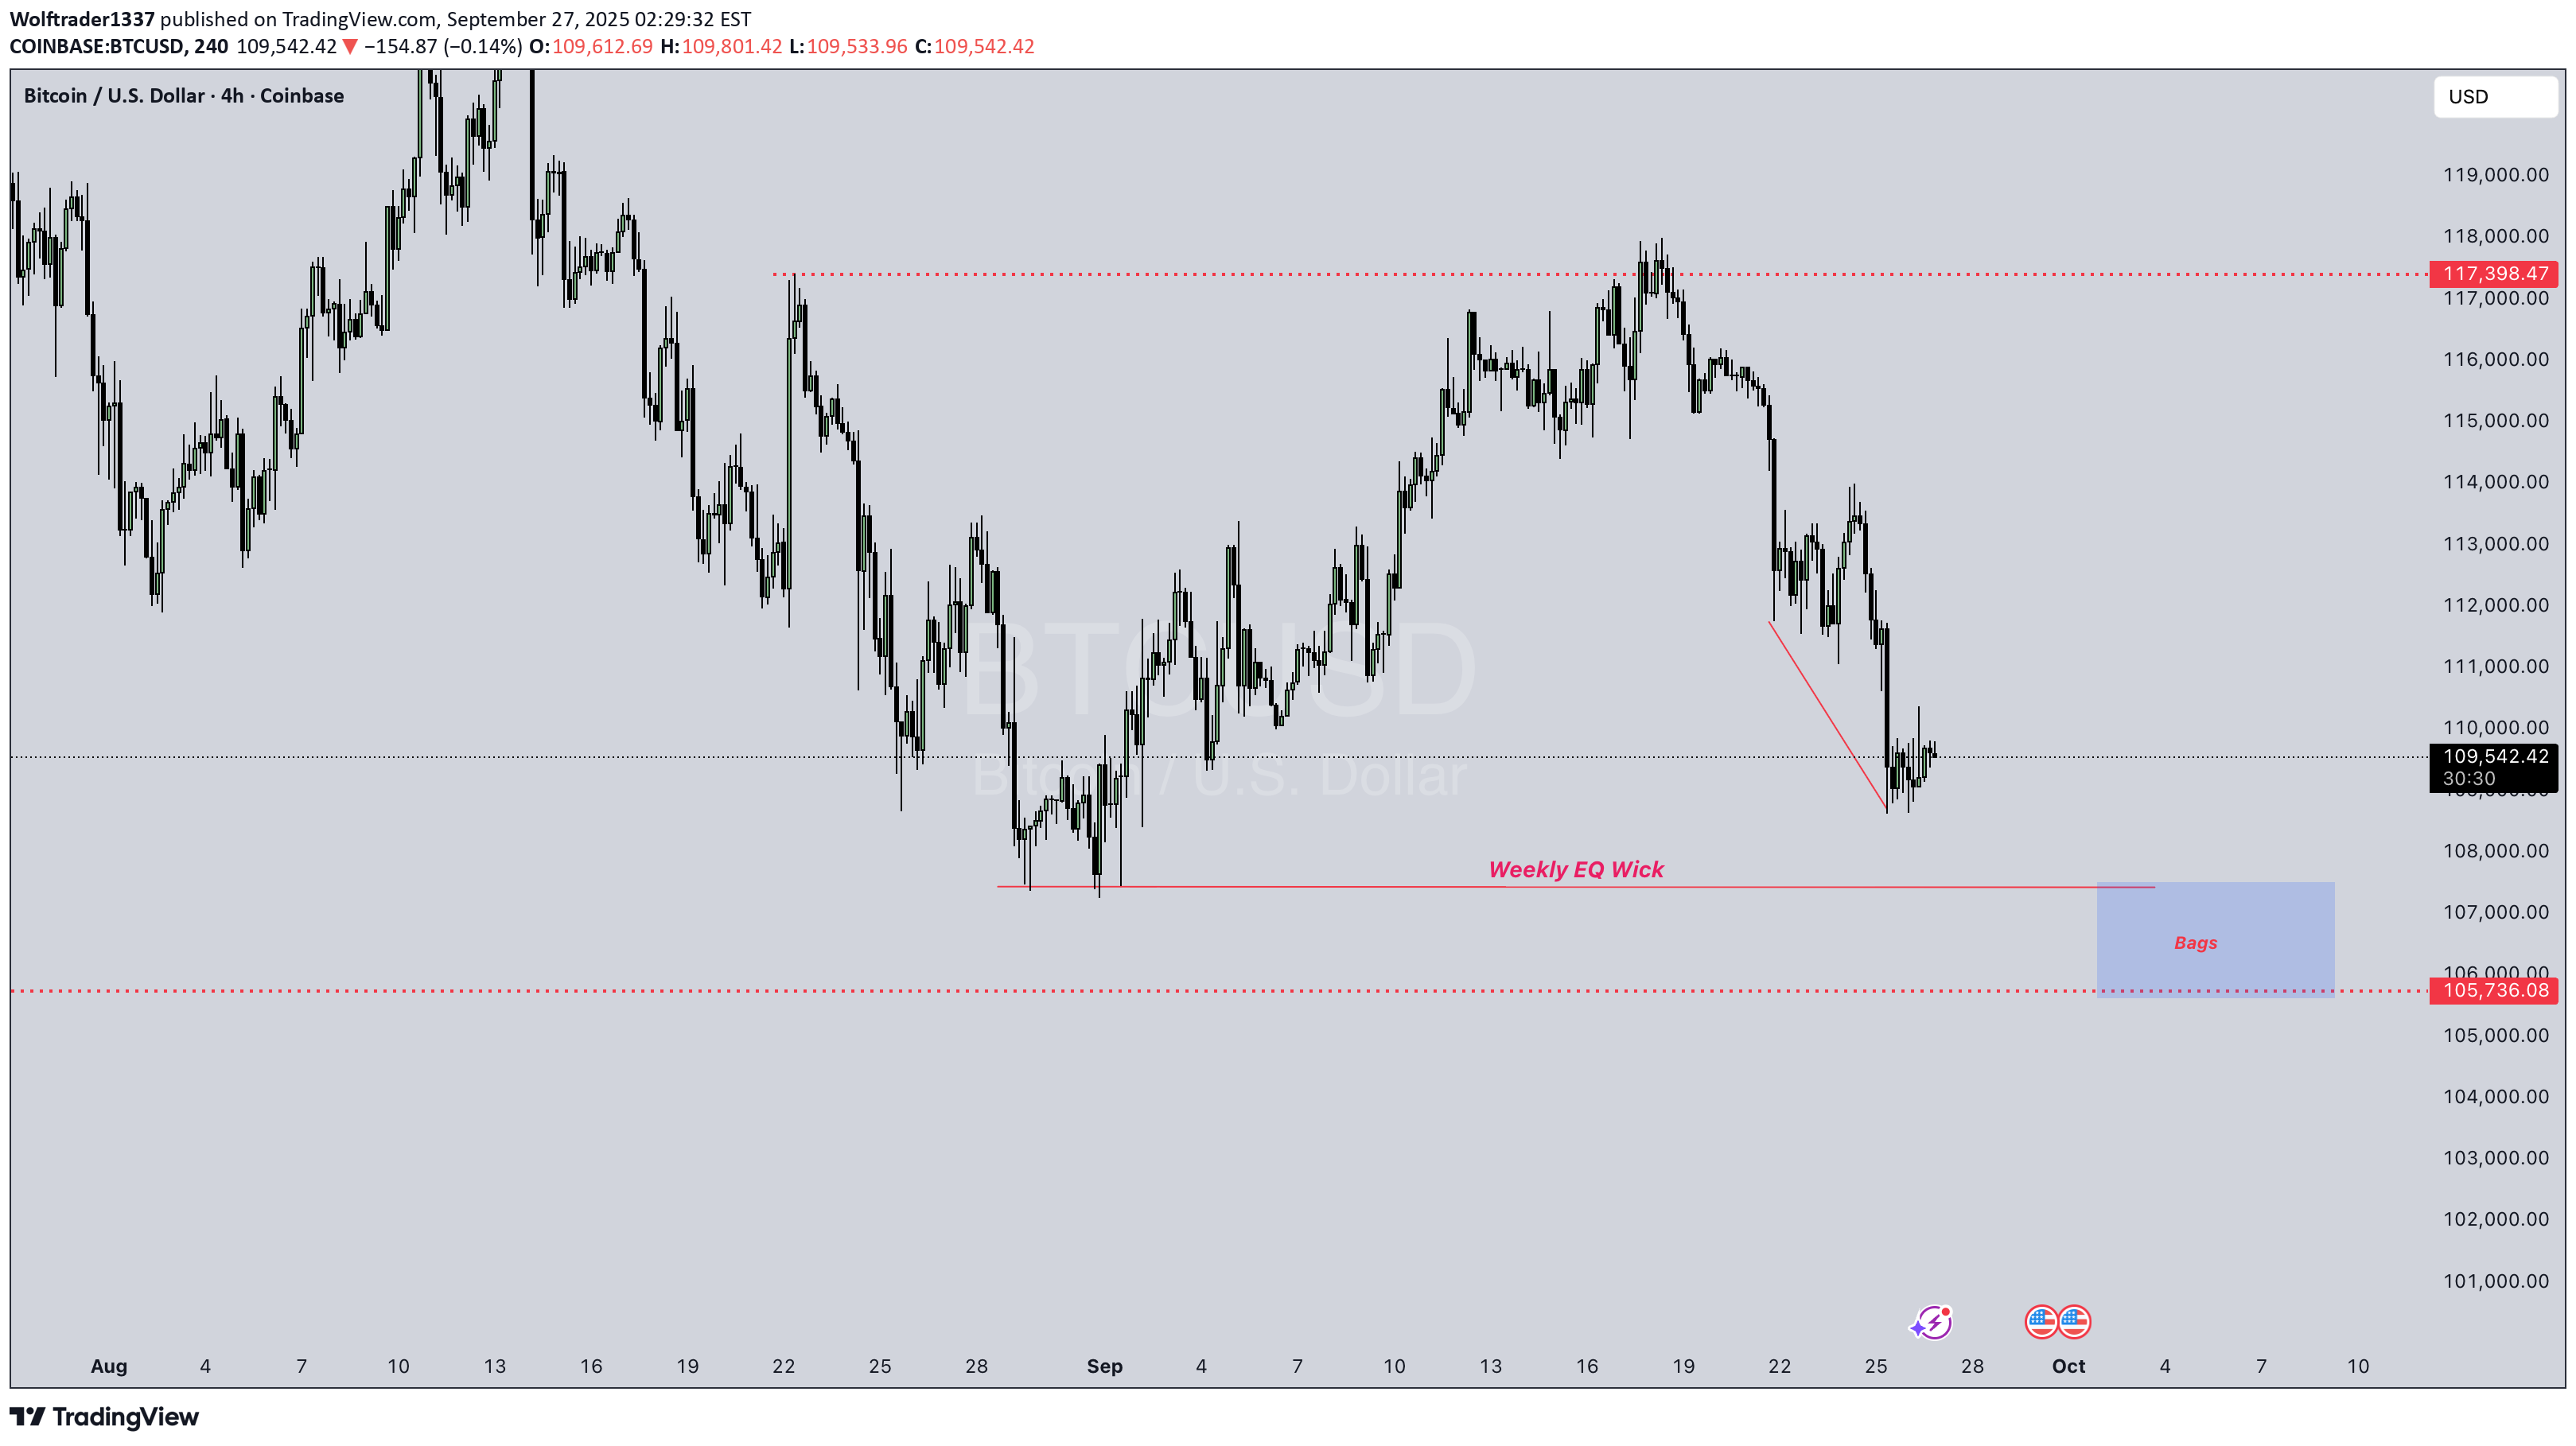
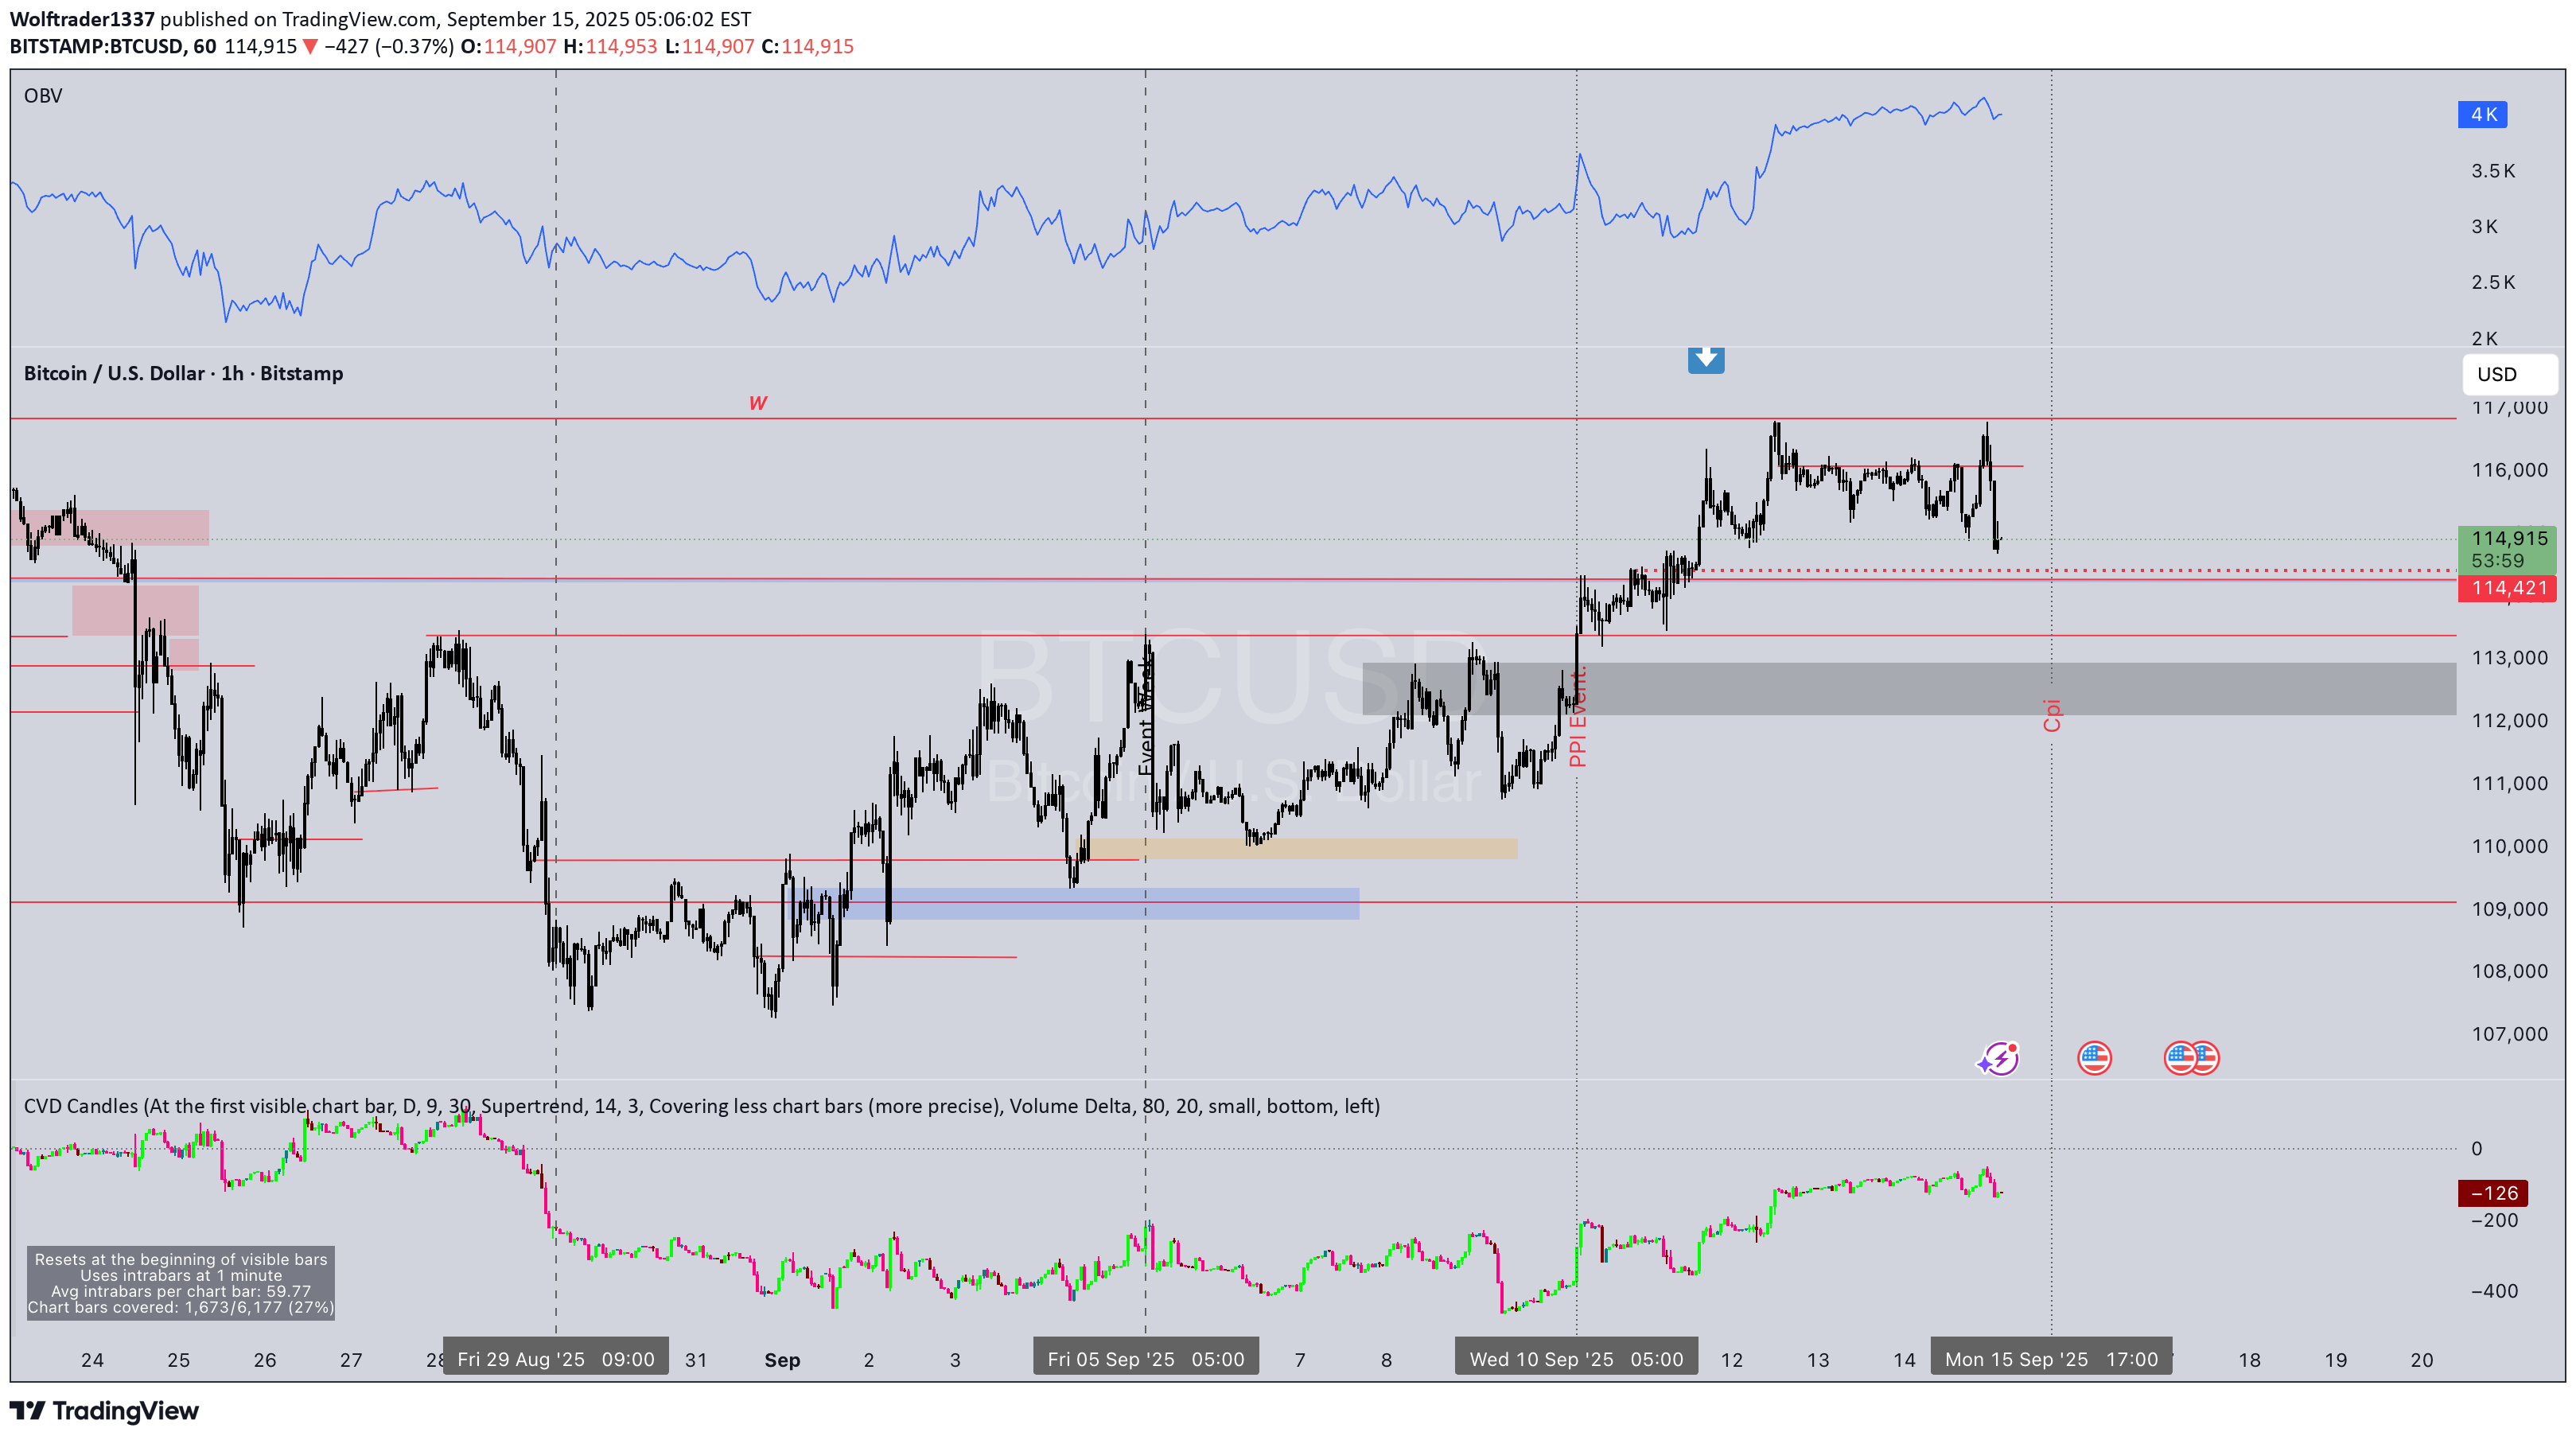
BTCUSD 1. **Price Action** * BTC dropped from \~117K to \~109K. * Current price is consolidating around **109.5K** after a sharp fall. 2. **Levels Marked** * **117,398 (dotted red)** → Resistance zone. * **111,849 (gray dashed)** → Mid-level resistance/support. * **105,736 (red dotted)** → Strong support. * **Weekly EQ Wick (around 108K)** and a **demand zone (blue box "Bags")** → Potential bounce area. 3. **Structure** * Trend is **short-term bearish** (lower highs, lower lows). * Price is nearing the demand zone, so buyers may step in around **107K–106K**. 4.**Inflation** * Rate Cut Important For Bitcoin Disclaimer : Not Financial Advice..
Wolftrader1337
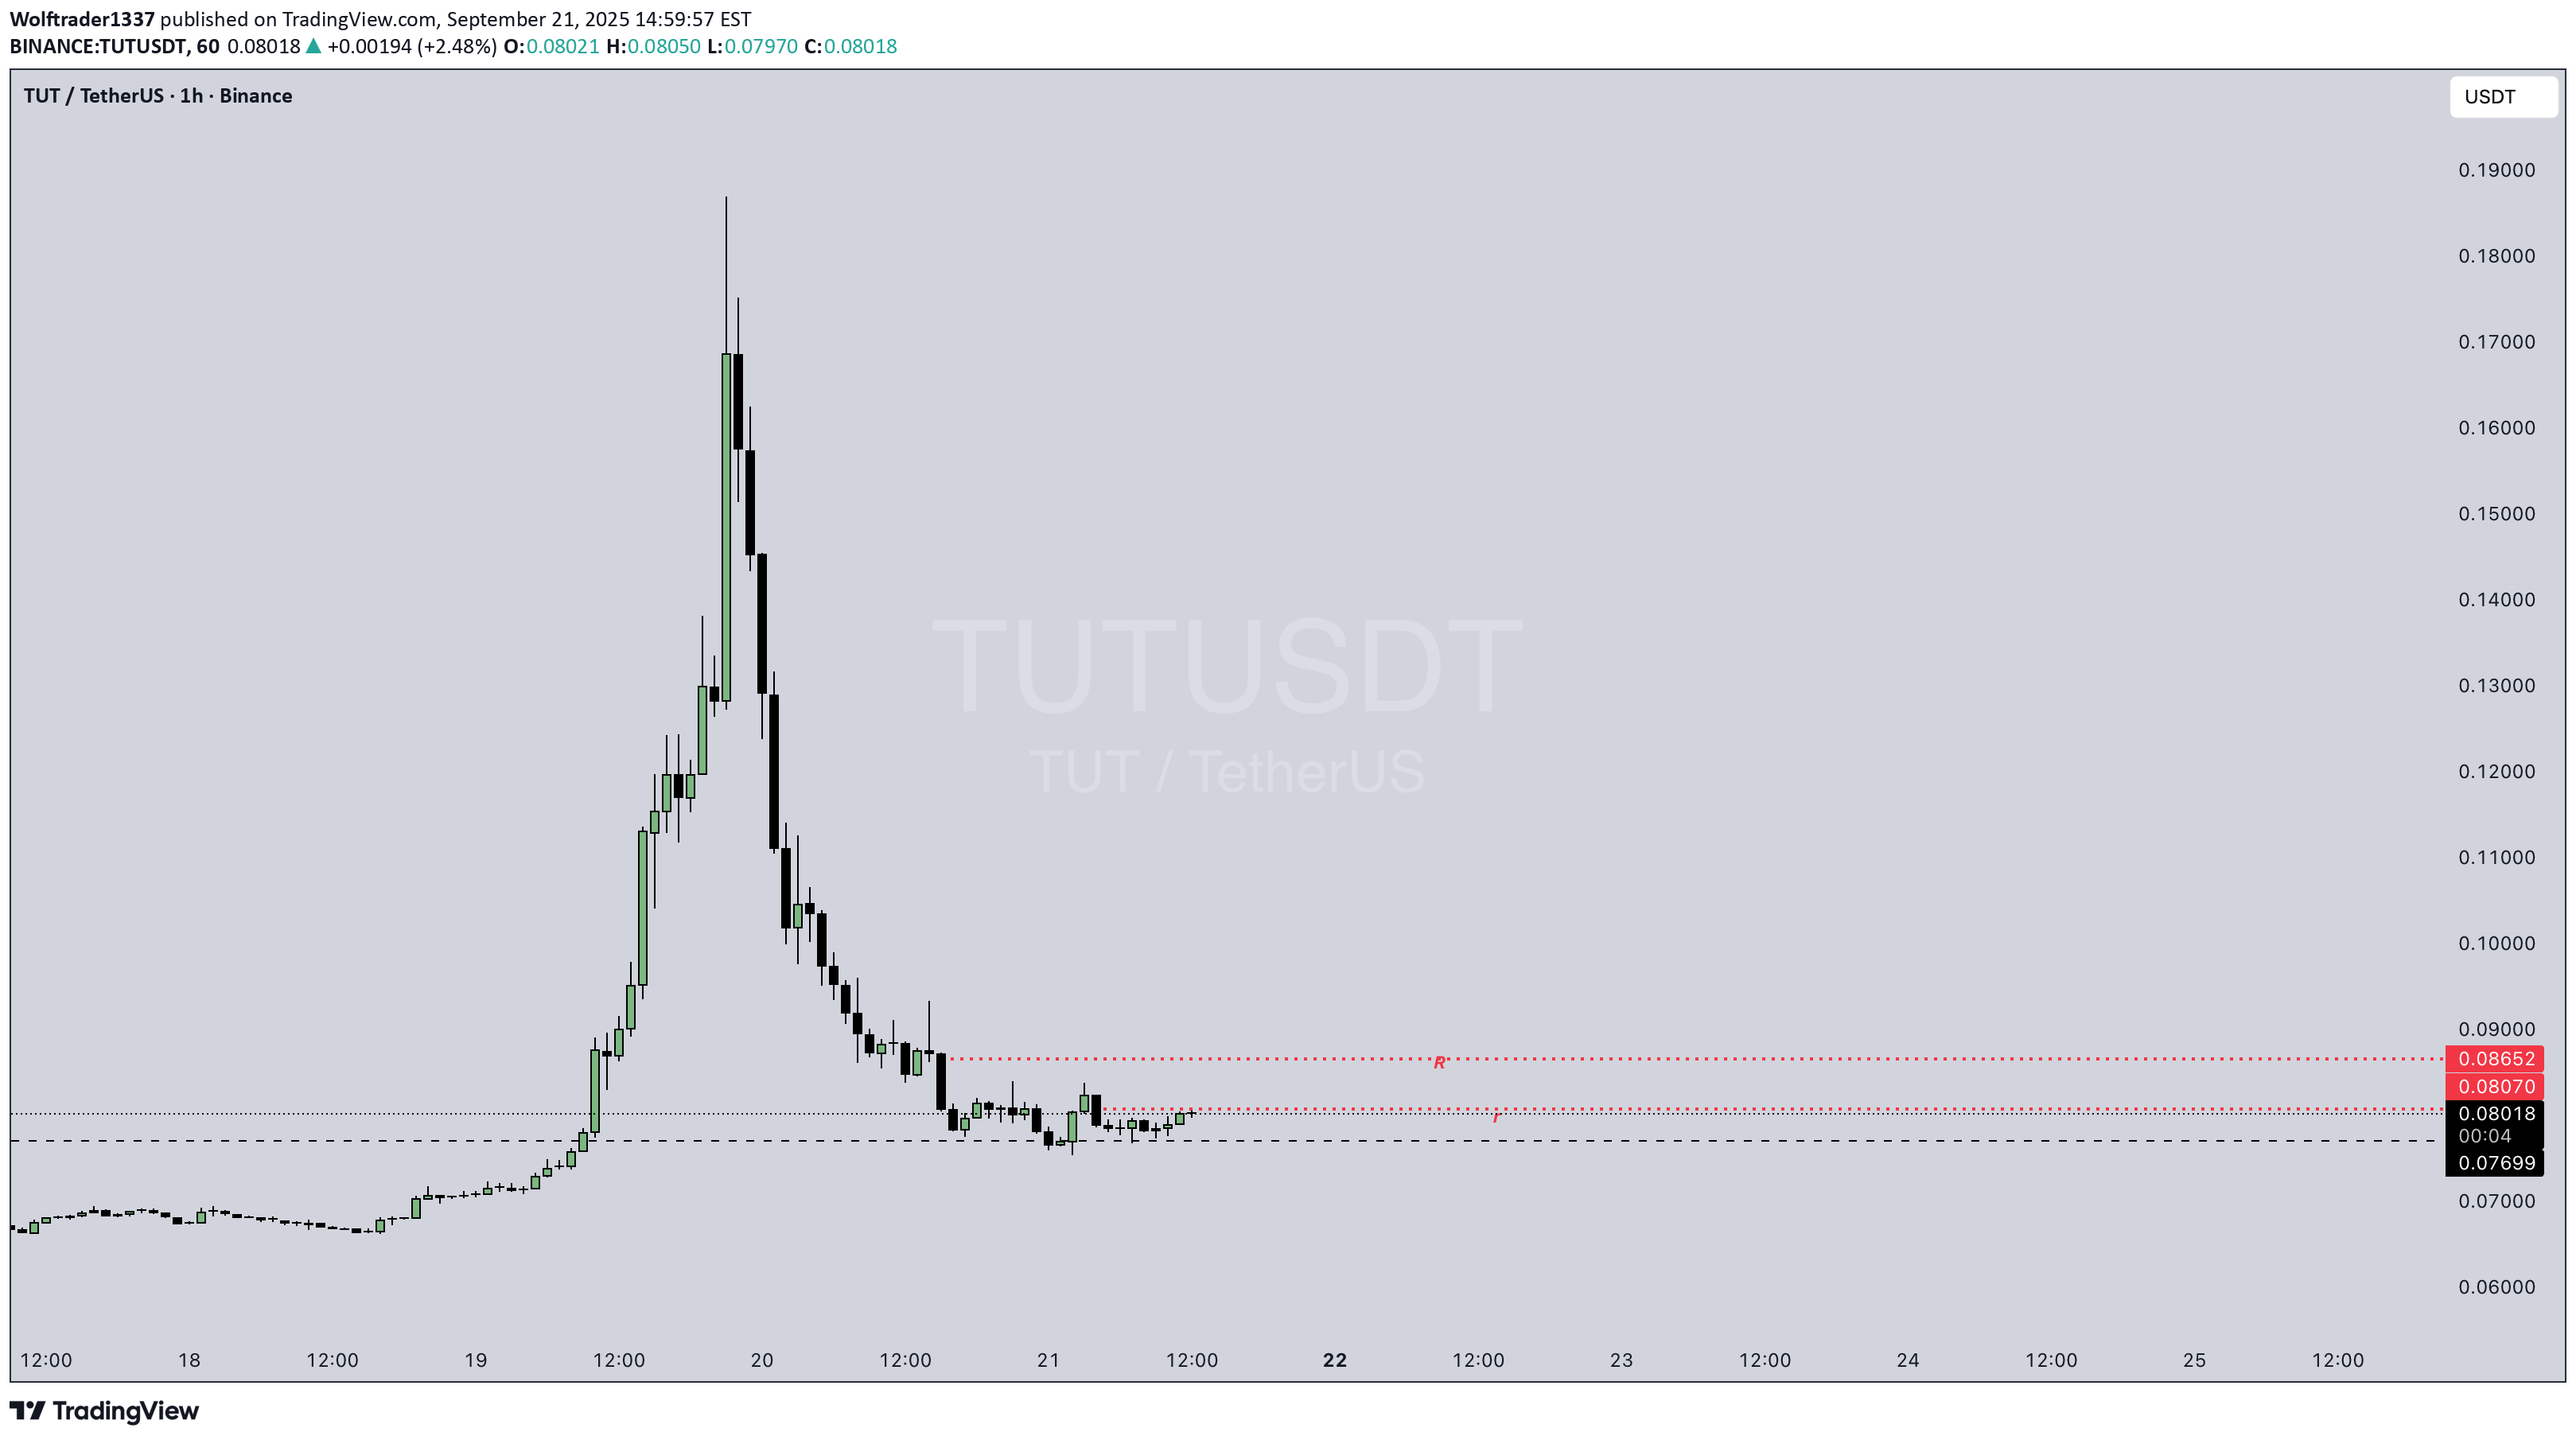
Tut / Usdt
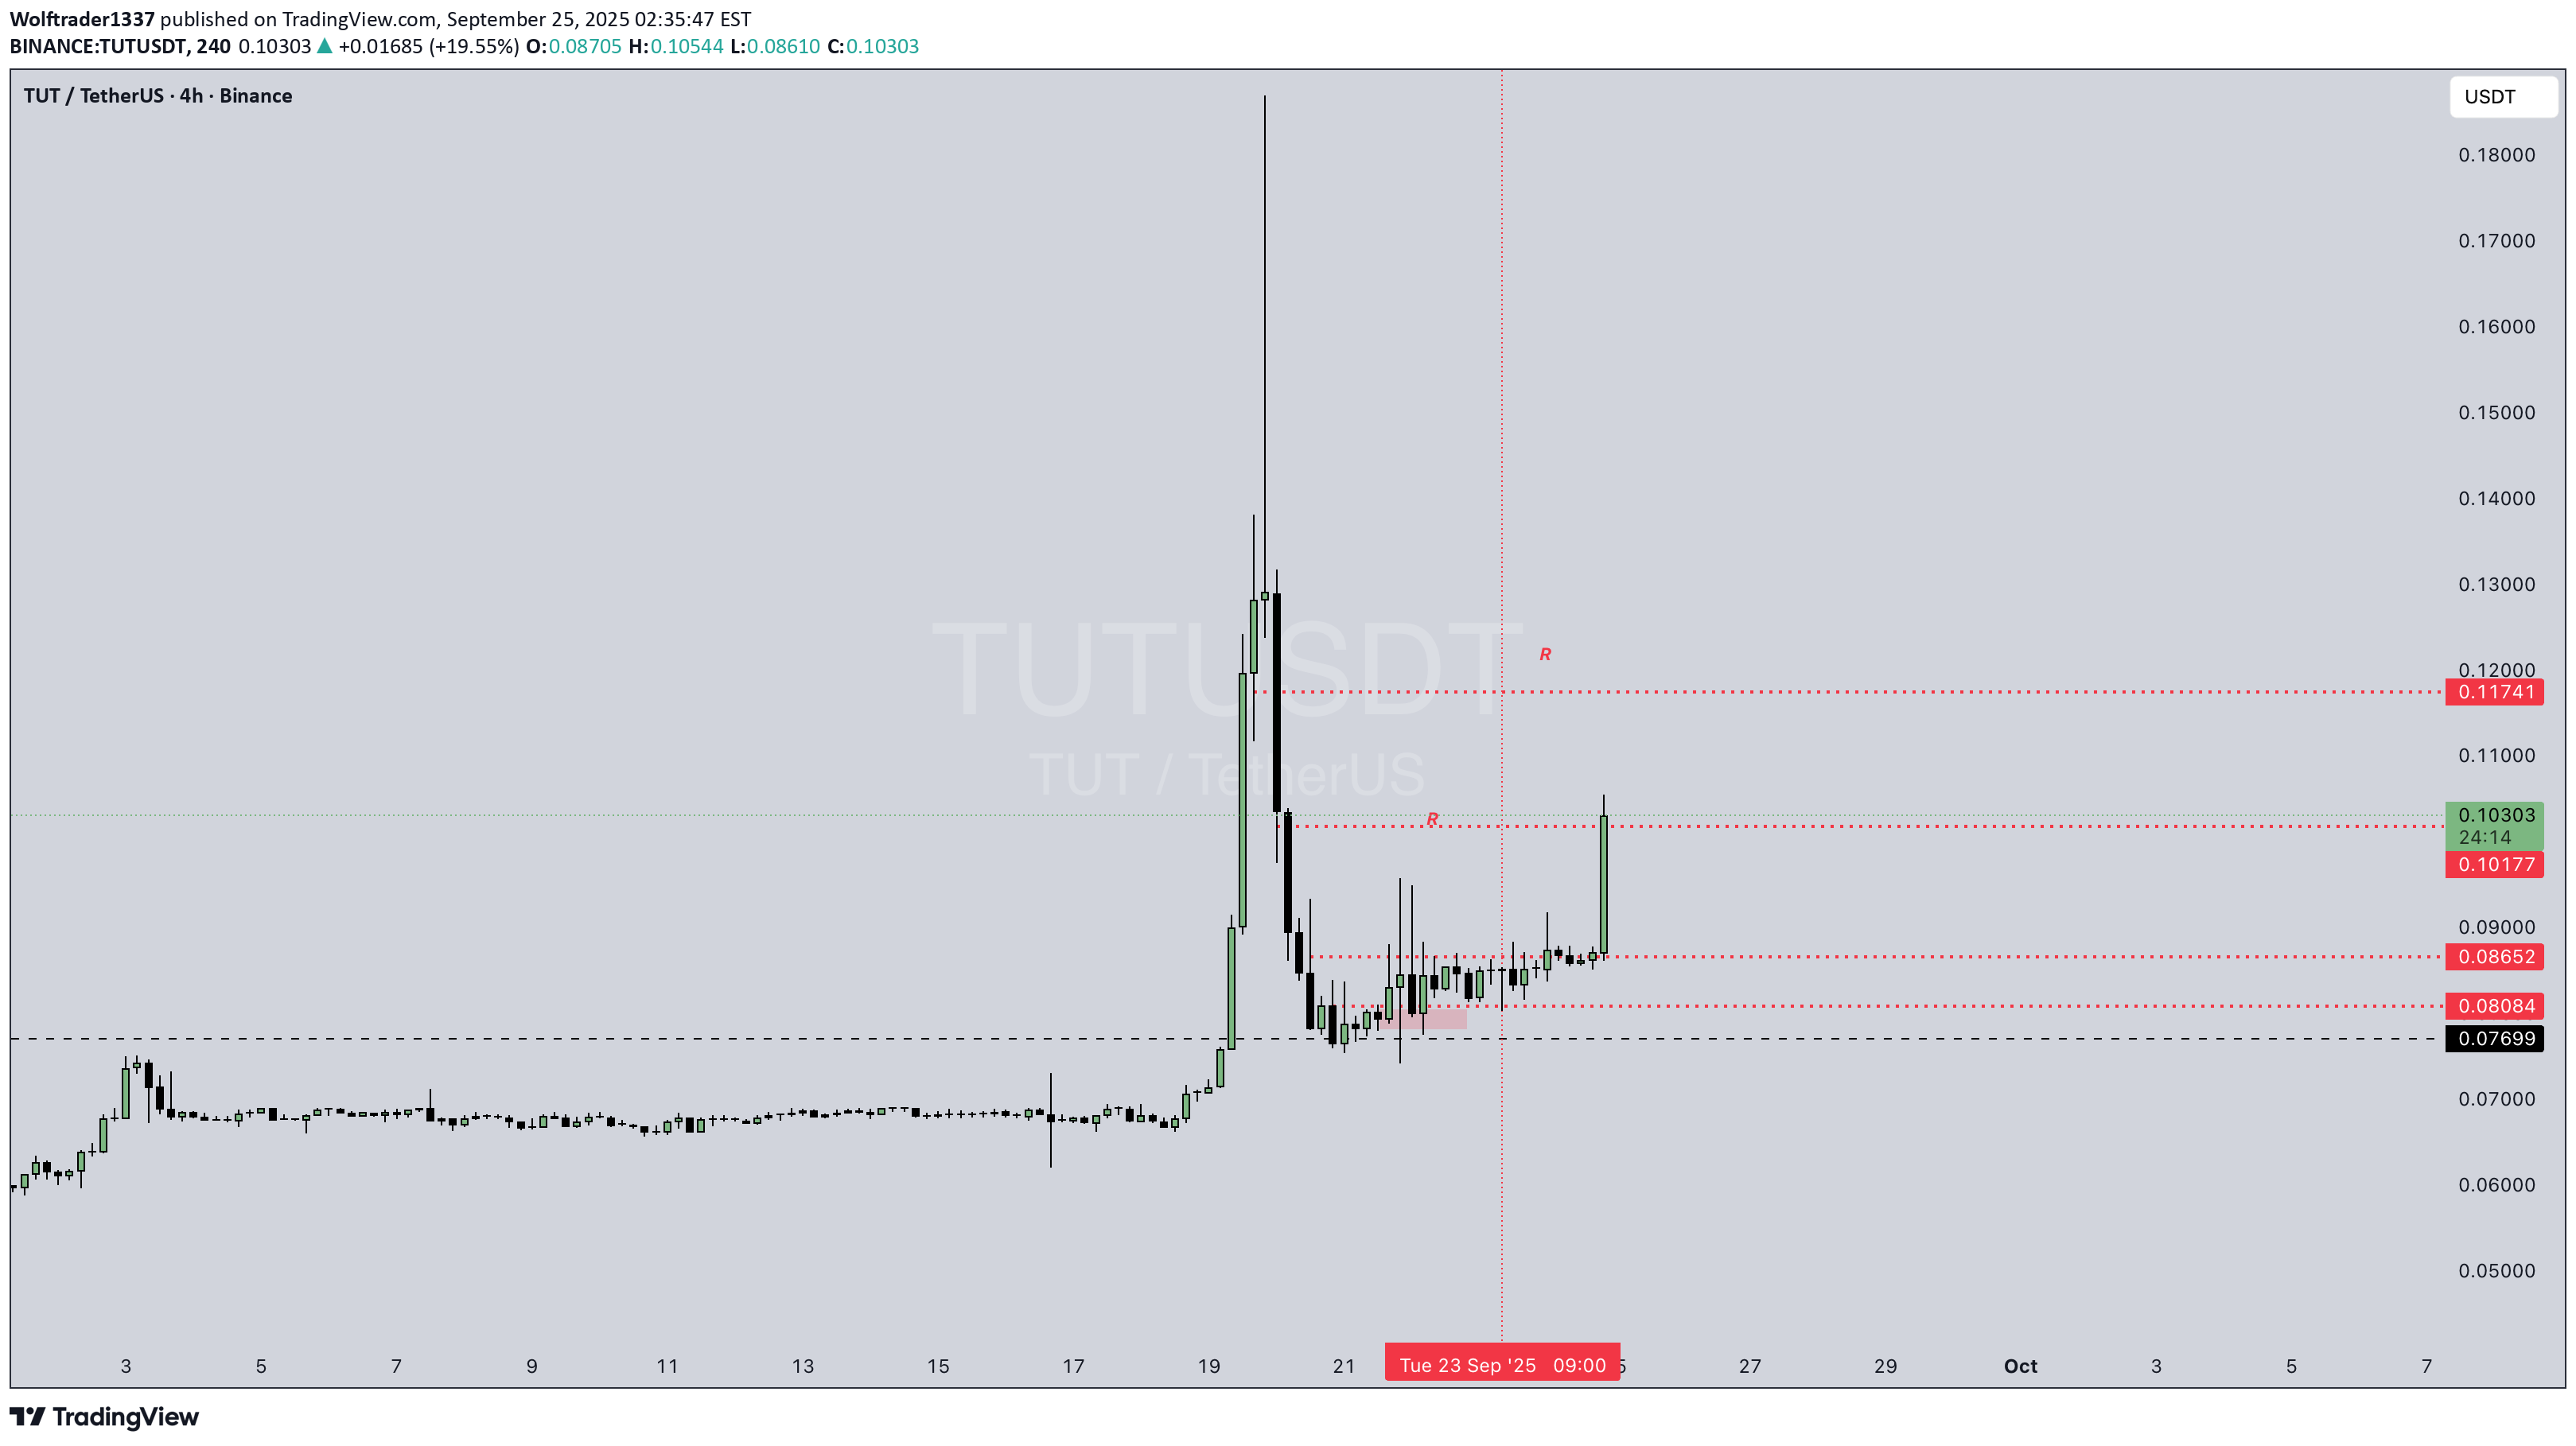
TUTUSDT Enjoy It And next target Set Disclaimer : Not Financial Advice.
Wolftrader1337
Wolftrader1337
Btc / Usdt
BTCUSD Next Support Zone is 109k / 110k Soon. Alts gonna bleed.. Disclaimer : Not Financial Advice.
Wolftrader1337
Opul / Usdt
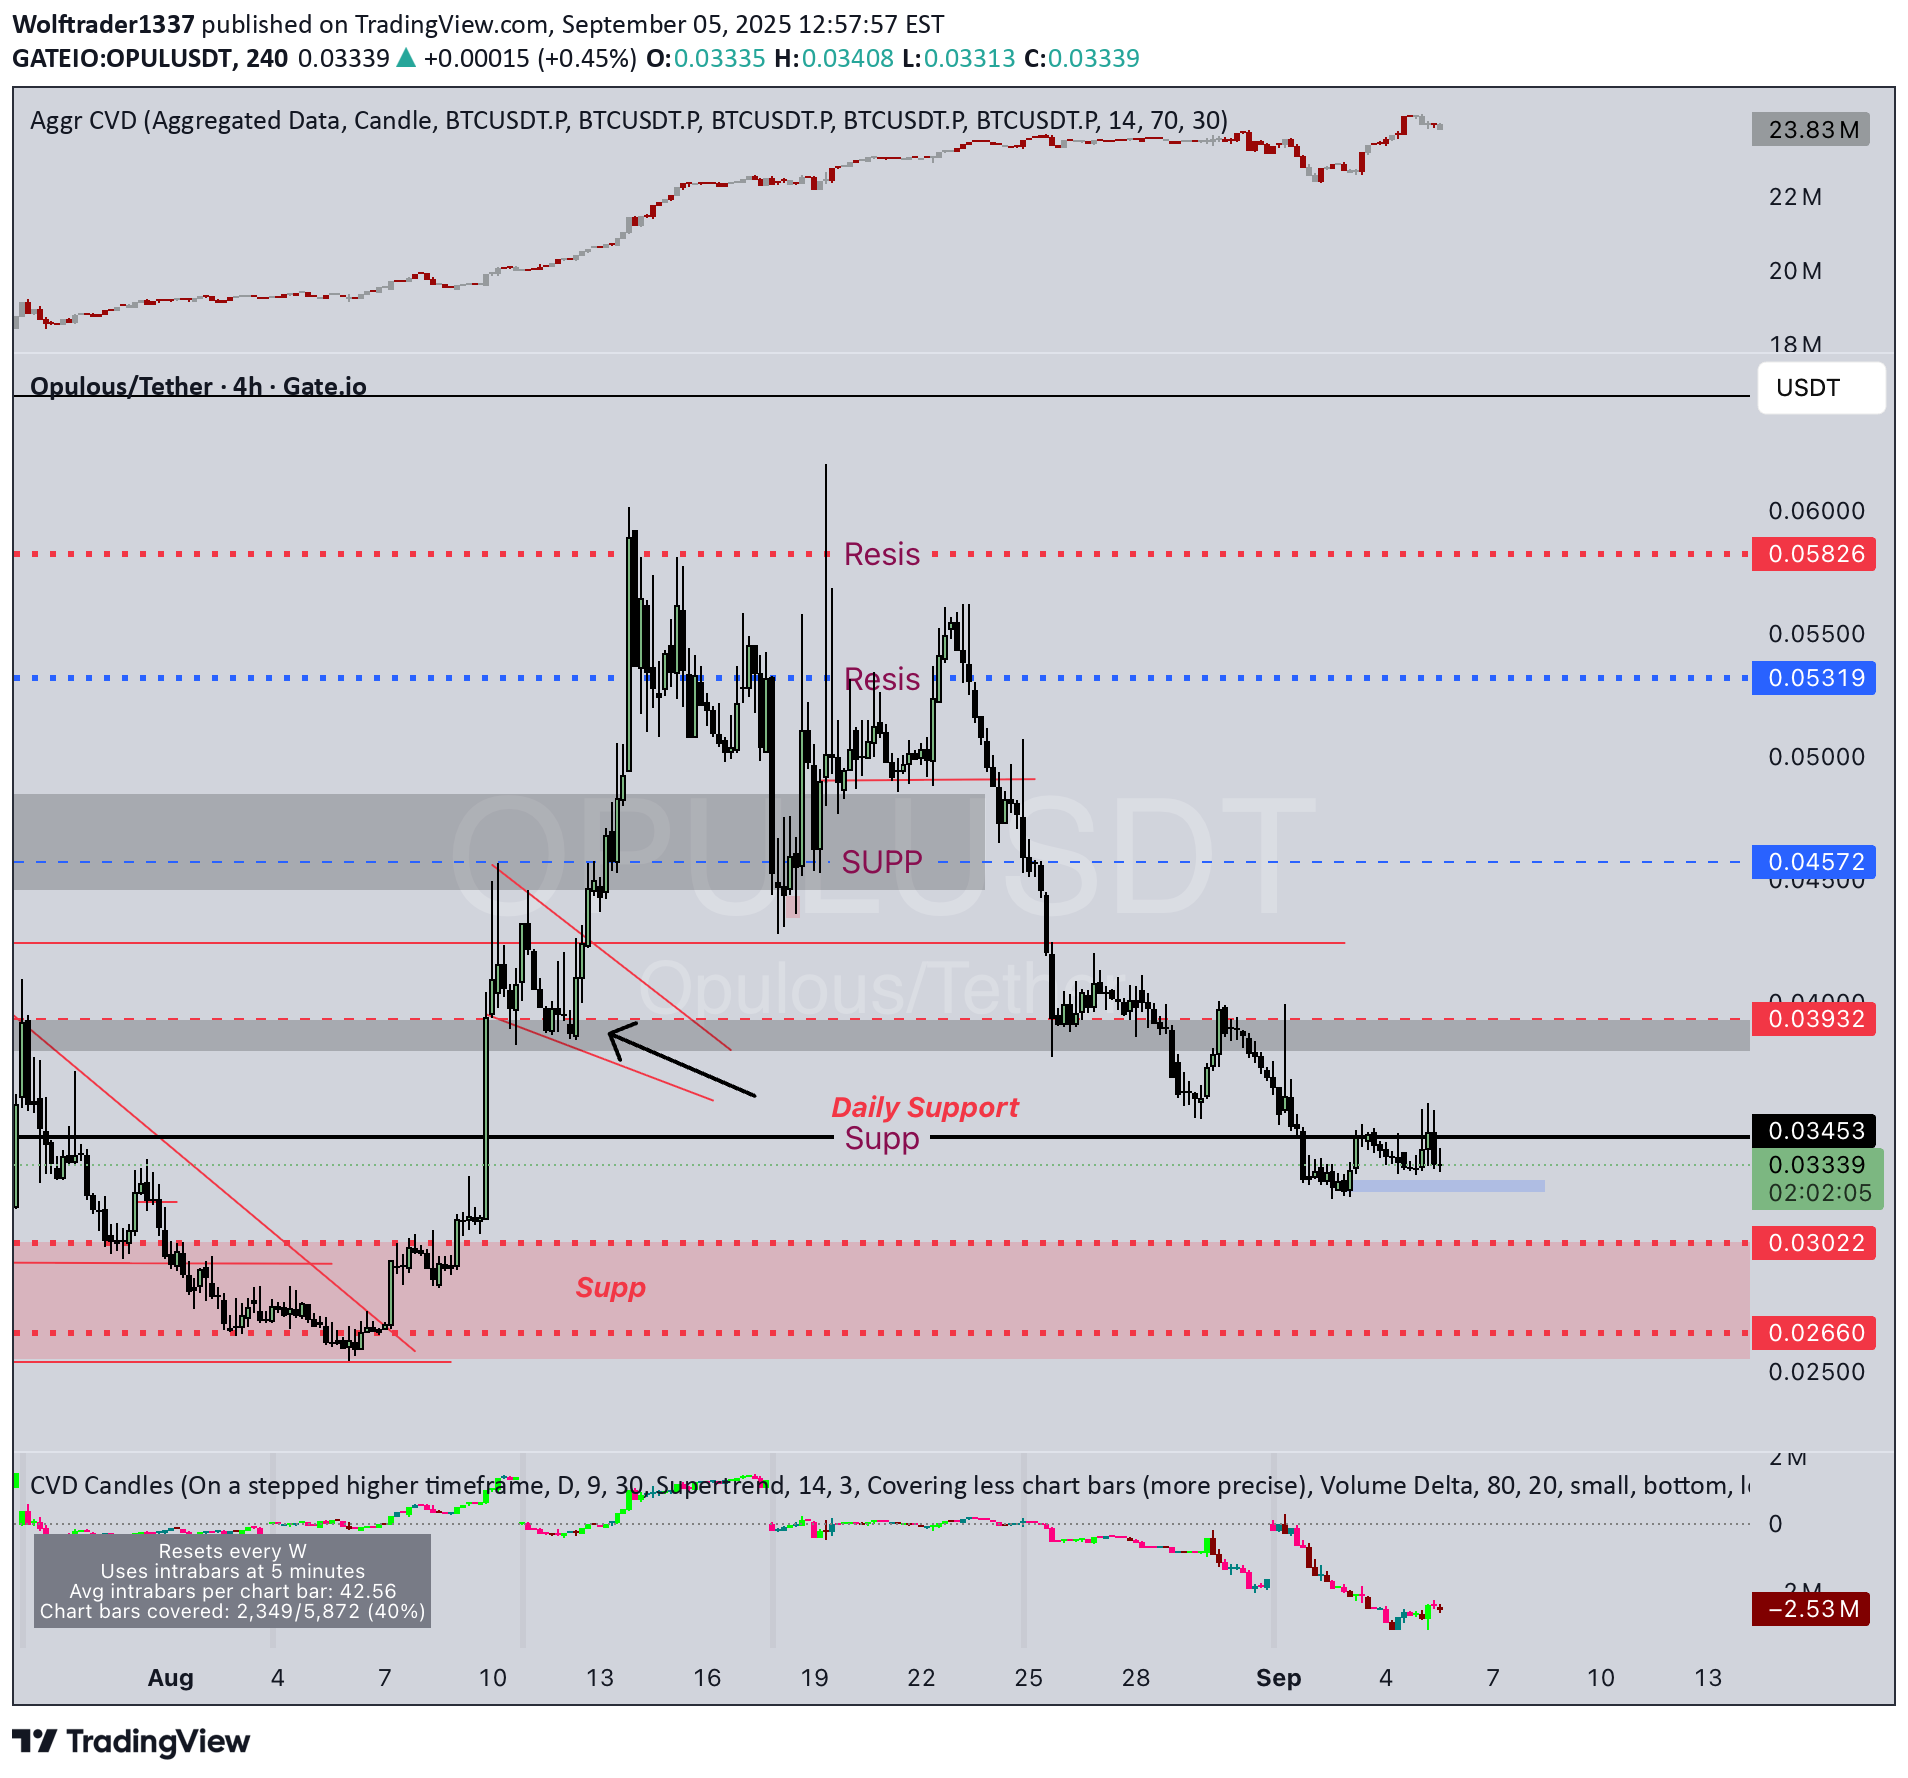
OPULUSDT Let's See if price Hold Our Support Lvl Disclaimer : Not Financial Advice
Wolftrader1337
Opul / Usdt

OPULUSDT Coin will Explode Soon. Disclaimer : Not Financial Advice
Wolftrader1337
Fartcoin / Usdt

FARTCOINUSDT "This chart’s heating up — price gonna cook soon 🚀🔥" Be careful market is heating zone. Disclaimer : Not Financial Advice.
Wolftrader1337
MDT / Usdt

MDTUSDT Just do it. Need to hold that area or we will ......... Disclaimer : Not Financial advice
Disclaimer
Any content and materials included in Sahmeto's website and official communication channels are a compilation of personal opinions and analyses and are not binding. They do not constitute any recommendation for buying, selling, entering or exiting the stock market and cryptocurrency market. Also, all news and analyses included in the website and channels are merely republished information from official and unofficial domestic and foreign sources, and it is obvious that users of the said content are responsible for following up and ensuring the authenticity and accuracy of the materials. Therefore, while disclaiming responsibility, it is declared that the responsibility for any decision-making, action, and potential profit and loss in the capital market and cryptocurrency market lies with the trader.