
Utopia-2025
@t_Utopia-2025

What symbols does the trader recommend buying?
Purchase History
پیام های تریدر
Filter
Signal Type
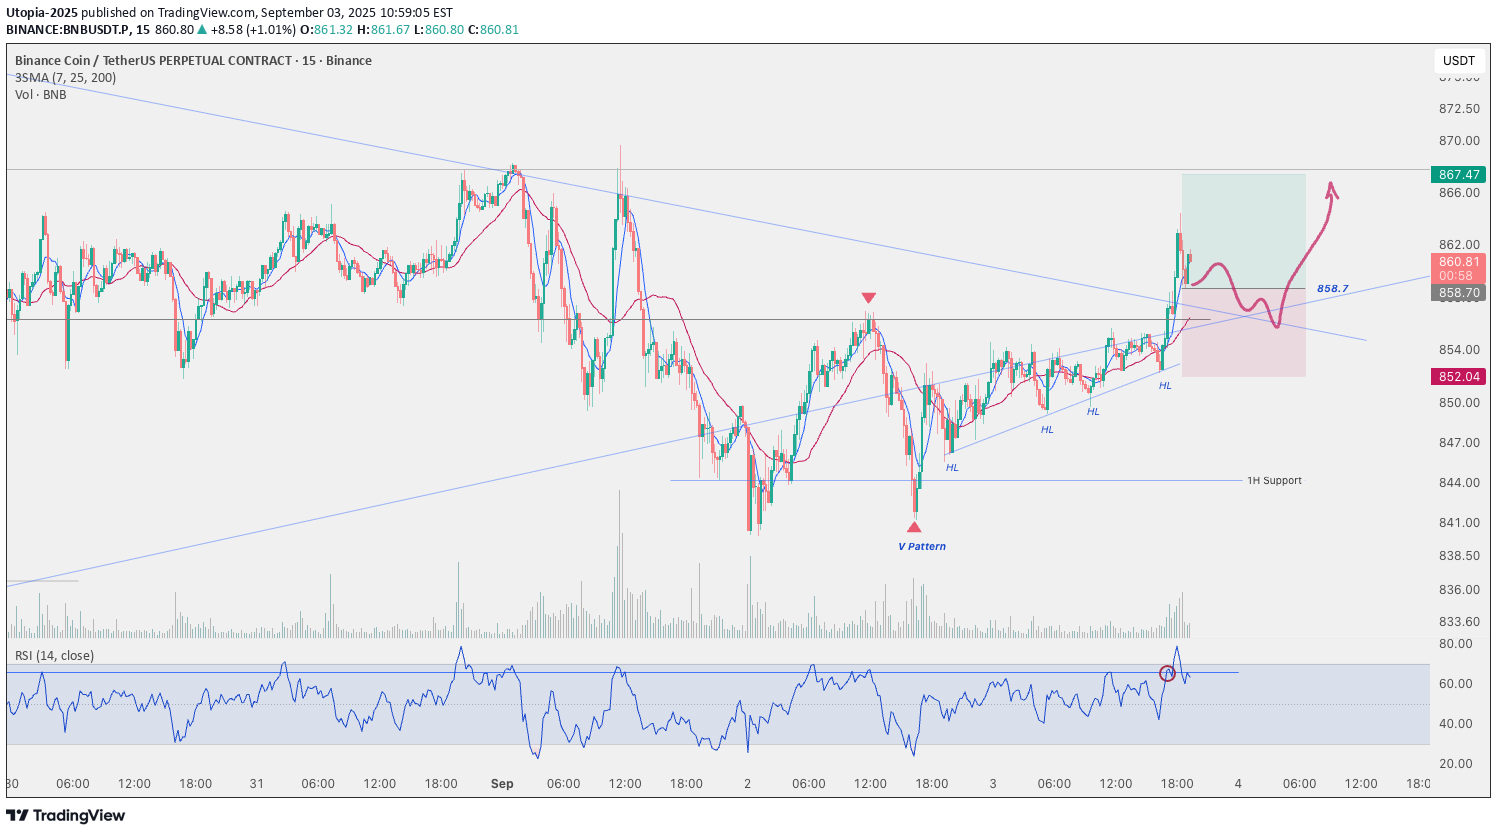
For my last position today, I opened a long trade on BNB . After the price touched and reacted to the daily ascending trendline, I set my entry trigger above the first 1H resistance at 856 . Similar to other coins, the V-pattern that formed before the breakout gave me additional confidence in the bullish move. Once the strong 1H candle closed above resistance, I placed a buy stop order above its wick at 858.7 for extra confirmation, which eventually triggered my entry. I must admit, this trade was a bit emotional — it would have been better to wait for a confirmed medium wave cycle bullish structure before entering. On top of that, the BNB/BTC chart doesn’t look very bullish, which suggests I might have found a better setup on other coins. The main reason I rushed was the opportunity to use relatively high leverage on this setup. 📌 Stop-Loss Strategy The main strength of this trade is the well-positioned stop-loss. Even if price decides to retest the broken descending trendline with a pullback, my stop would not be triggered prematurely. ⚠️ Overall, this is a risky position that is currently open. If I notice weakening bullish signals, I’ll likely exit early. BNBUSDT Highwave-Cycle on 4H Timeframe: BNB/BTC Chart:

Considering the daily uptrend, the touch of the ascending trendline provided a good opportunity for a long setup. On the 1H timeframe, after the formation of a range box with a fake breakdown to the downside, the first bullish signs appeared. As the range continued, the creation of higher lows confirmed stronger buying pressure. With the breakout of the box resistance, rising volume during the upward move, and the RSI entering the overbuy zone , conditions for a long entry became clear. However, I decided to act earlier — with the increase in volume and the RSI moving higher, I placed a buy stop order at 45.60 to catch any sharp breakout. This position is now active, and I’m waiting for the next targets to be assigned.

Considering the daily uptrend , the touch of the ascending trendline provided a good opportunity for a long setup. On the 1H timeframe, after the formation of a range box with a fake breakdown to the downside, the first bullish signs appeared. As the range continued, the creation of higher lows confirmed stronger buying pressure. With the breakout of the box resistance, rising volume during the upward move, and the RSI entering the overbuy zone , conditions for a long entry became clear. However, I decided to act earlier — with the increase in volume and the RSI moving higher, I placed a buy stop order at 45.60 to catch any sharp breakout. This position is now active, and I’m waiting for the next targets to be assigned. https://www.tradingview.com/x/3O6e8V2O/

Following up on yesterday’s analysis, with each reaction to the 204.34 level, I became more confident about the presence of sellers above this zone. At the same time, since every rejection off this level was also creating a higher low , I decided to treat it as a risky long trigger. After the breakout of this line and the 15m and 1H candle closing above it, I was still cautious, suspecting that the main sellers might be sitting around 206.24 . At that point, as the RSI also reached its resistance line, I placed a buy stop order at 207 , just above the highest previous wick. I intentionally set the buy stop at the highest possible point to ensure that both price and RSI had convincingly broken their resistances. This position is still open, and I’m now waiting for higher targets to be reached.
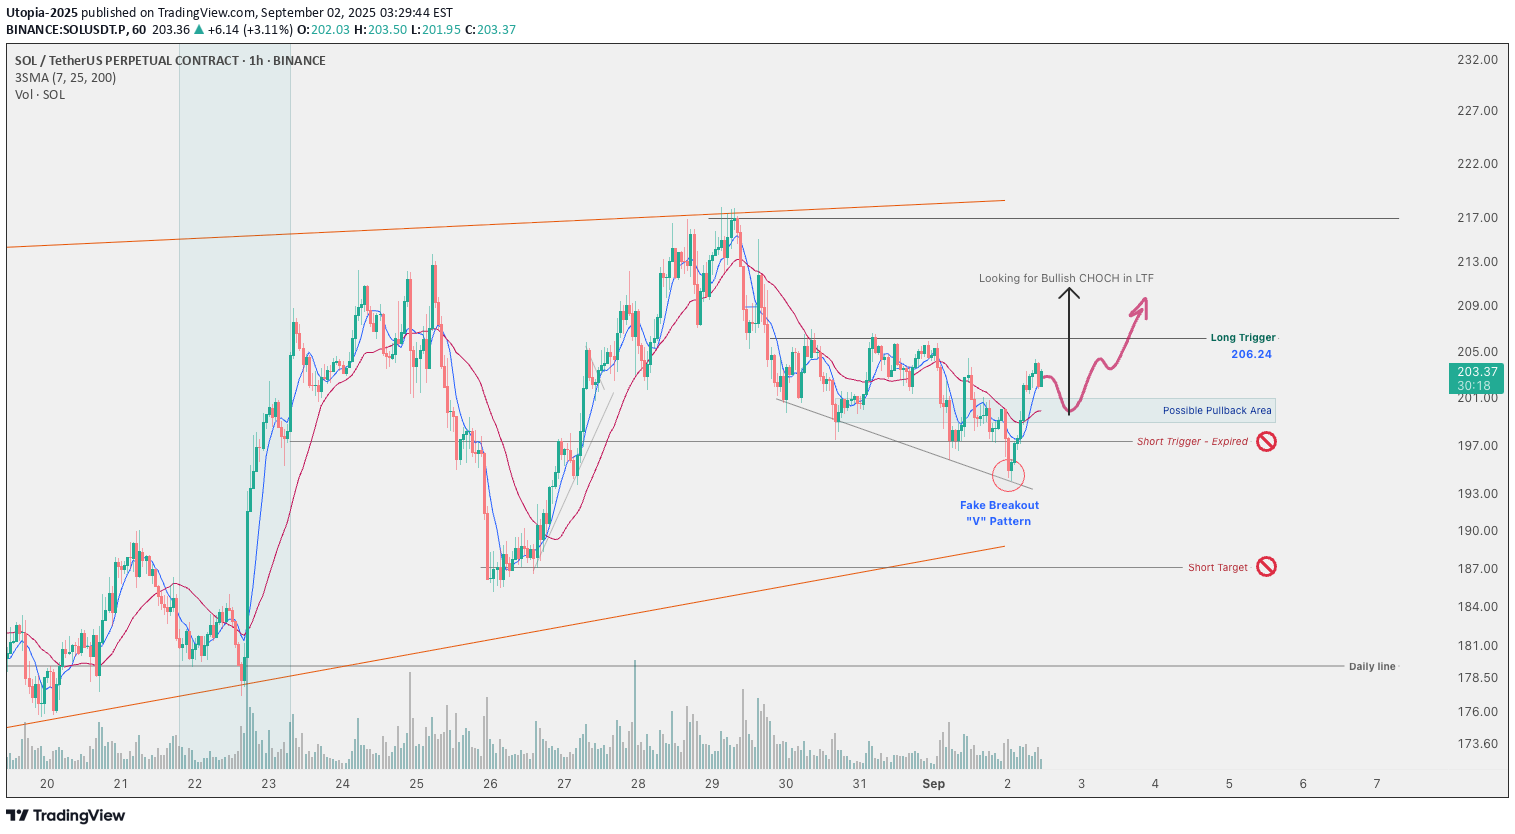
Despite the broader long-term uptrend in Solana, yesterday I was considering a risky short position on one of the altcoins and had already defined the triggers. Fortunately, the short trigger was broken while I wasn’t monitoring the chart, so no position was opened. The positive development is that we saw a fake breakdown of the 197.36 support zone. After collecting liquidity below this level, Solana initiated a strong bullish move. I’ve marked the long trigger at 206.24. However, for an early entry ، if I spot a market structure shift in the pullback zone, I’ll scale in with a partial position. Then, if the main level breaks, I’ll add more volume to the trade. I will also check my entries with the SOLBTC chart for more confirmation
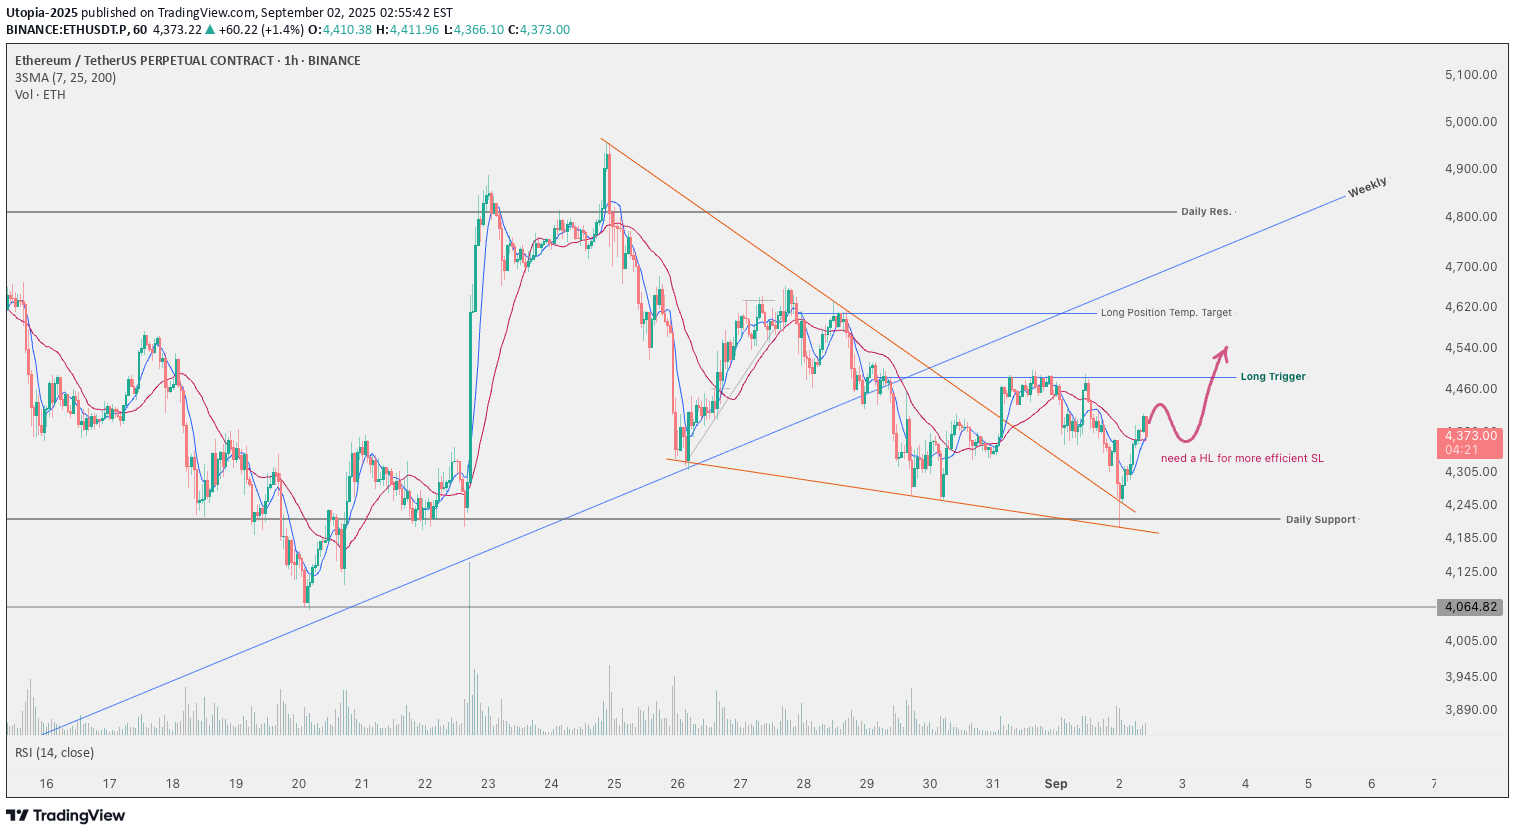
Yesterday, Ethereum printed another bearish leg, but after reacting to the daily support, it managed to reverse that move and form a " V-shaped ” pattern — a positive signal for those of us looking for long opportunities. Our entry trigger for ETH remains at 4,485.5 , and with this recent V-shaped recovery, our confidence in that trigger has increased. Currently, if the trigger activates, the only logical stop-loss would be around 4,220 , which isn’t ideal. It would be better if ETH could form a higher low on the 1H timeframe later today, giving us the chance to enter with a tighter stop-loss.
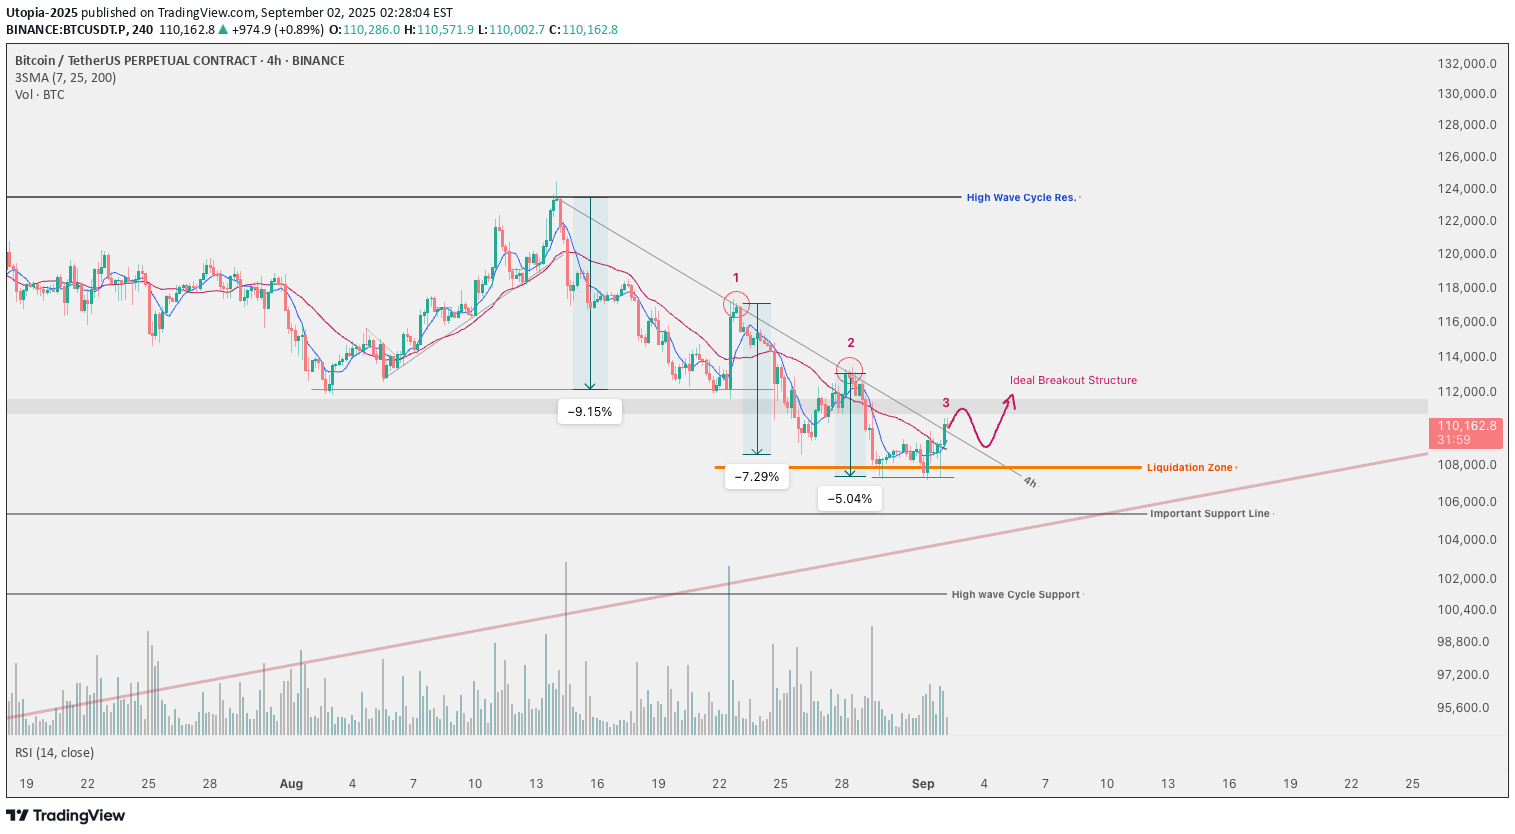
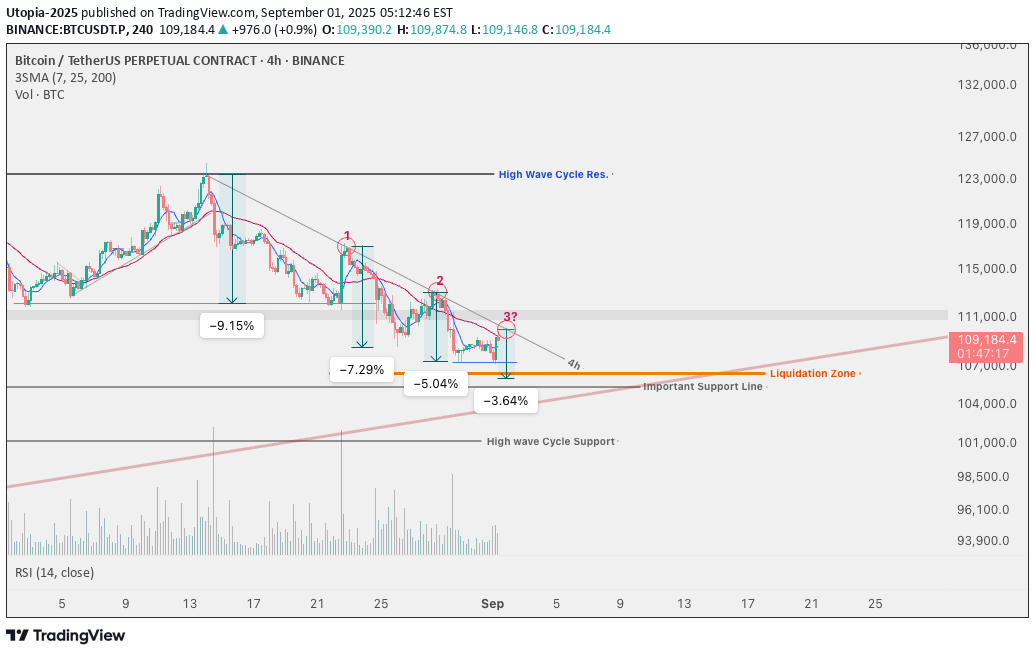
Following yesterday’s analysis, Bitcoin has now tested the mid-term descending trendline for the third time. It’s hard to say whether the last 4H candle has actually closed above this trendline. However, I don’t consider this as a confirmed breakout yet — for me, a breakout should be confirmed by market structure, not just by a single candle close. So today, I’ll be watching Bitcoin’s reaction to this trendline closely. If price gets rejected, I expect it to drop toward the **liquidity zone** I’ve marked, collect liquidity there, and then potentially continue its downward move. 📌 Summary * I will not take any long positions until I see a confirmed breakout in structure. * If Bitcoin gets rejected from the trendline, I’ll look into short setups on altcoins، depending on Bitcoin dominance.
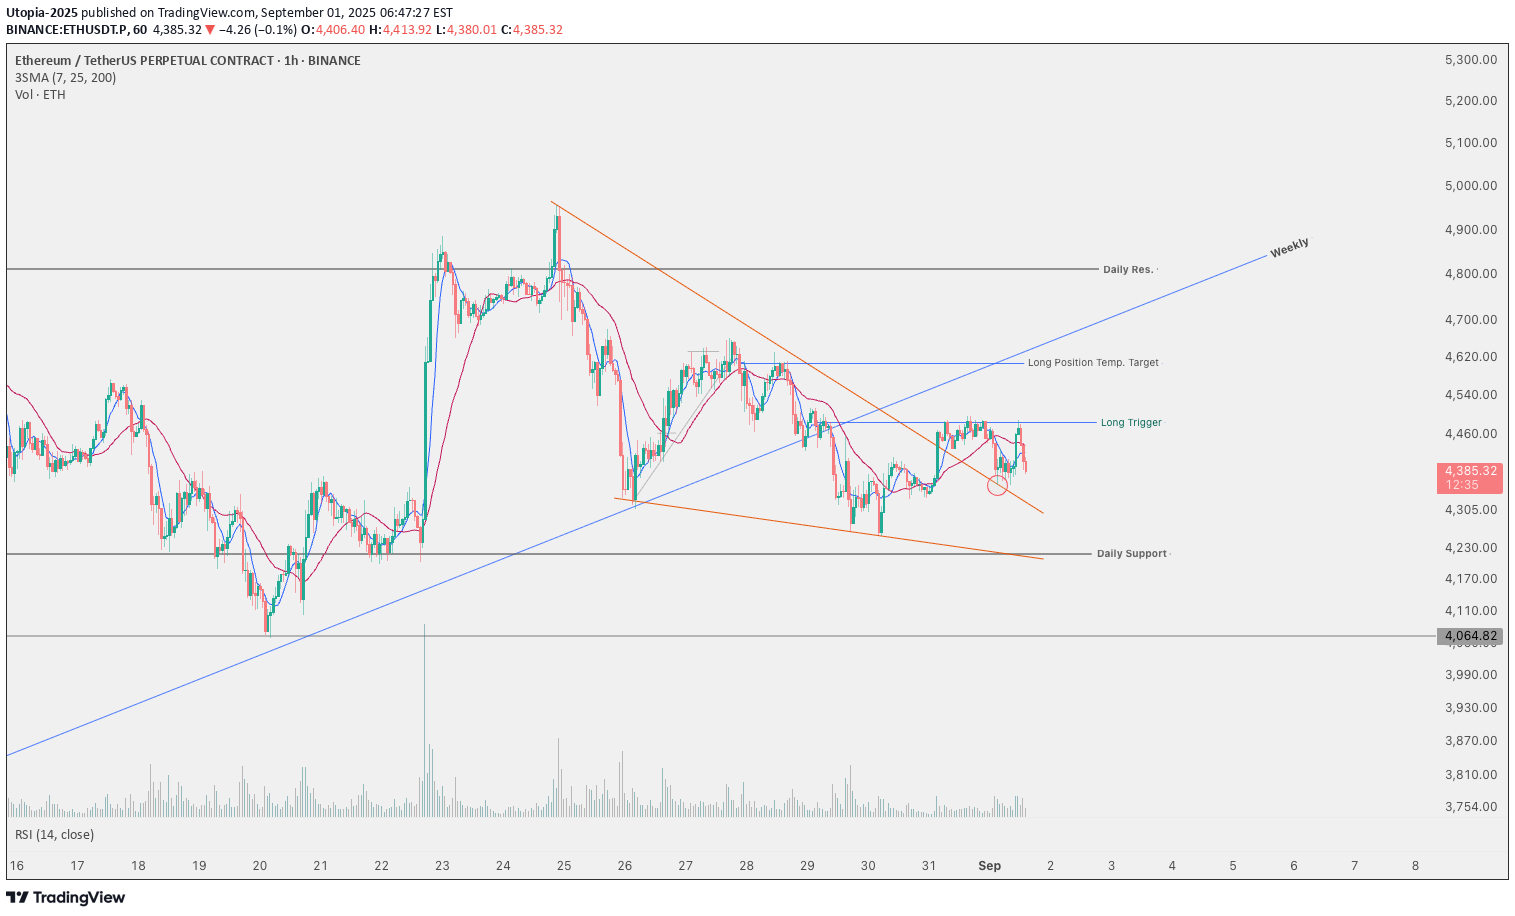
Intro For the first time in almost two months, Ethereum has broken below its ascending trendline. In addition, a flat top structure is clearly visible on the 4H chart. These signals make me less bullish on Ethereum compared to before. That said, there’s still no confirmation of a full trend reversal yet. However, I’ll be more cautious about opening long positions on ETH for now. The key level I’m watching is 4,078.56 — a breakdown below this level could change my long-term outlook on Ethereum and provide a potential short trigger. ⏳ 1H Outlook On the 1H timeframe, the first setup that caught my attention is a triangle pattern, which has recently broken to the upside. A pullback to the breakout area has also occurred. If price breaks above 4,483.86 after this pullback, it could present a good long opportunity. Still, I don’t plan to hold this long for the mid/long term — I will take profits at the nearest resistance levels. I’ll keep this approach until the upcoming U.S. unemployment data and other economic news set the broader market direction this week. 📉 Short-side View At the moment, I don’t see a clear short trigger on Ethereum, nor do I have a strong interest in taking short positions right now. From a broader perspective, Ethereum may be forming a large range (box) between 4,065.50 and 4,816.84 . Currently, the price sits roughly in the middle of this range, while potential short triggers are much closer to the bottom boundary of the box.
In the recent downtrend, each retest of the descending trendline has shown a slight weakening in bearish momentum. Currently, the price is approaching a key daily support at 105,500 . Since Bitcoin has already broken previous support levels and dropped to this point, a test of this final support zone seems likely. Therefore, once the price reaches the trendline, I will monitor its reaction on lower timeframes. If bearish continuation is confirmed, I will be expecting roughly a 3% downside move. For opening a position after Bitcoin reaches this area, I will also check Bitcoin dominance to decide whether to short Bitcoin directly or look for setups in altcoins. If BTC dominance rises, I will focus on short opportunities in altcoins. The next important reactions will be around 106,500 and 105,500 . As mentioned earlier, we are already seeing early signs of weakness in the current downtrend: 1. Each touch of the descending trendline shows reduced bearish momentum. 2. The bearish waves are getting smaller in size with each touch of the trendline. Thus, in these final support areas where buyers may step in, the probability of a trend reversal is now higher than at any previous point in this downtrend.
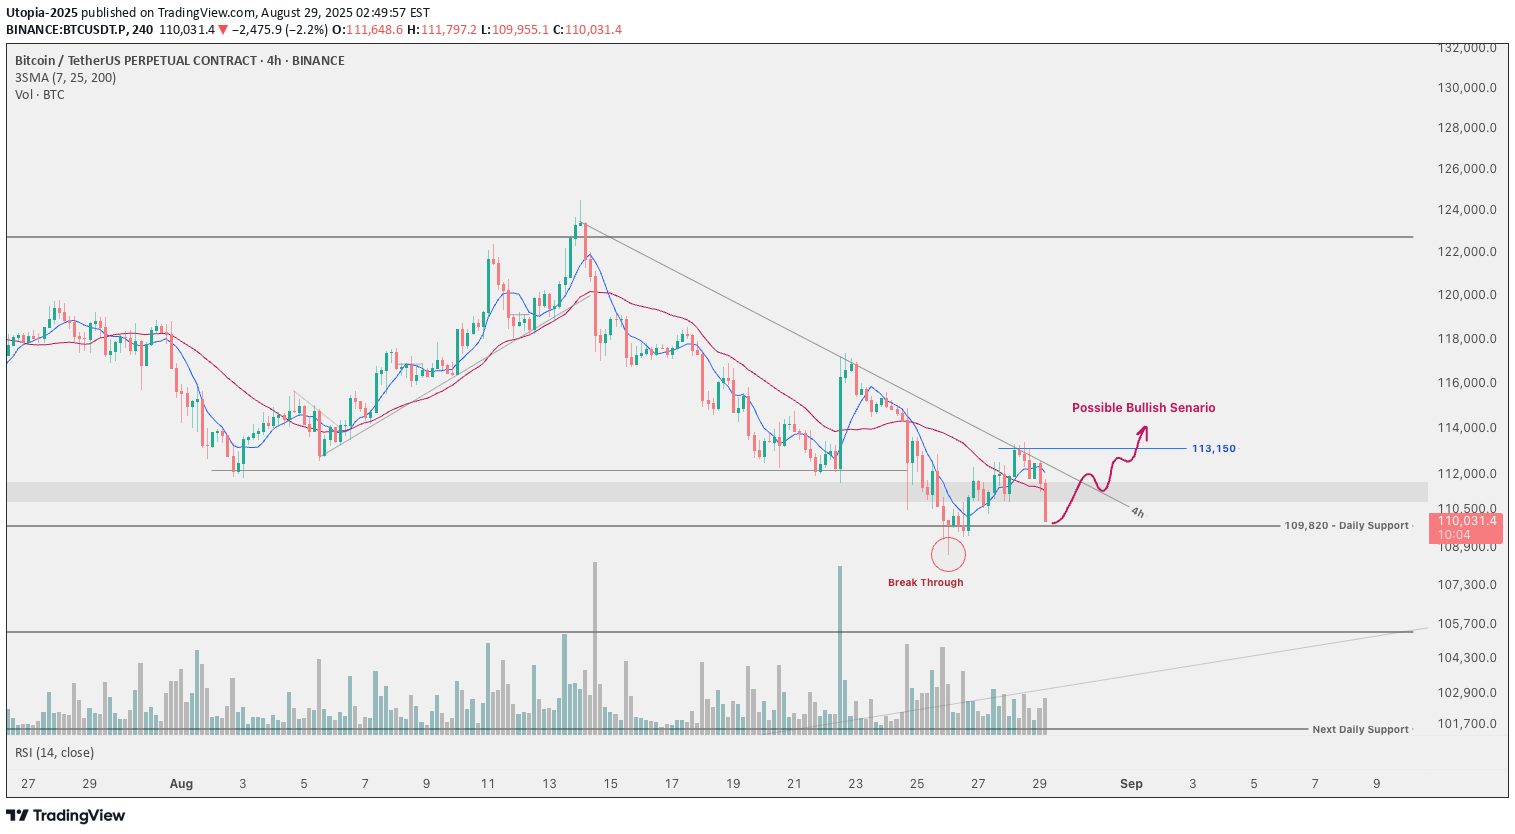
The daily support at 109,820 and the descending trendline on the 4H timeframe are key levels to watch. Bitcoin’s reaction to these zones will be crucial. A breakdown below this support could signal further downside, which seems more likely considering the previous bearish momentum. However, since Bitcoin has not yet confirmed a trend reversal on the daily timeframe and larger cycles, I prefer not to enter short positions at this stage. On the other hand, in the mid-cycle, a strong bearish trend is already in place, which means that a trendline breakout alone would not be a reliable confirmation of a reversal. For that reason, I don’t expect to take any position on Bitcoin today. Still, given the bullish leg in Bitcoin dominance, the situation could be different for some altcoins. --- 📌 Bullish Scenario Confirmation For me to consider a bullish reversal, the following conditions are required: 1. Price must not form a lower low below 109,820, and instead bounce from the current area. 2. After breaking the trendline, Bitcoin must establish higher lows (at least on the 1H timeframe) and also break above the 113,150 resistance. 3. During this move, rising volume is needed as confirmation of the reversal. In the best-case scenario, we could see these developments play out by Sunday.
Disclaimer
Any content and materials included in Sahmeto's website and official communication channels are a compilation of personal opinions and analyses and are not binding. They do not constitute any recommendation for buying, selling, entering or exiting the stock market and cryptocurrency market. Also, all news and analyses included in the website and channels are merely republished information from official and unofficial domestic and foreign sources, and it is obvious that users of the said content are responsible for following up and ensuring the authenticity and accuracy of the materials. Therefore, while disclaiming responsibility, it is declared that the responsibility for any decision-making, action, and potential profit and loss in the capital market and cryptocurrency market lies with the trader.