
GTC
Gitcoin
| تریدر | نوع سیگنال | حد سود/ضرر | زمان انتشار | مشاهده پیام |
|---|---|---|---|---|
No results found. | ||||
Price Chart of Gitcoin
سود 3 Months :
سیگنالهای Gitcoin
Filter
Sort messages by
Trader Type
Time Frame

AltcoinPiooners
Master the Surge: $GTC 4H Trading Guide with RSI Peak
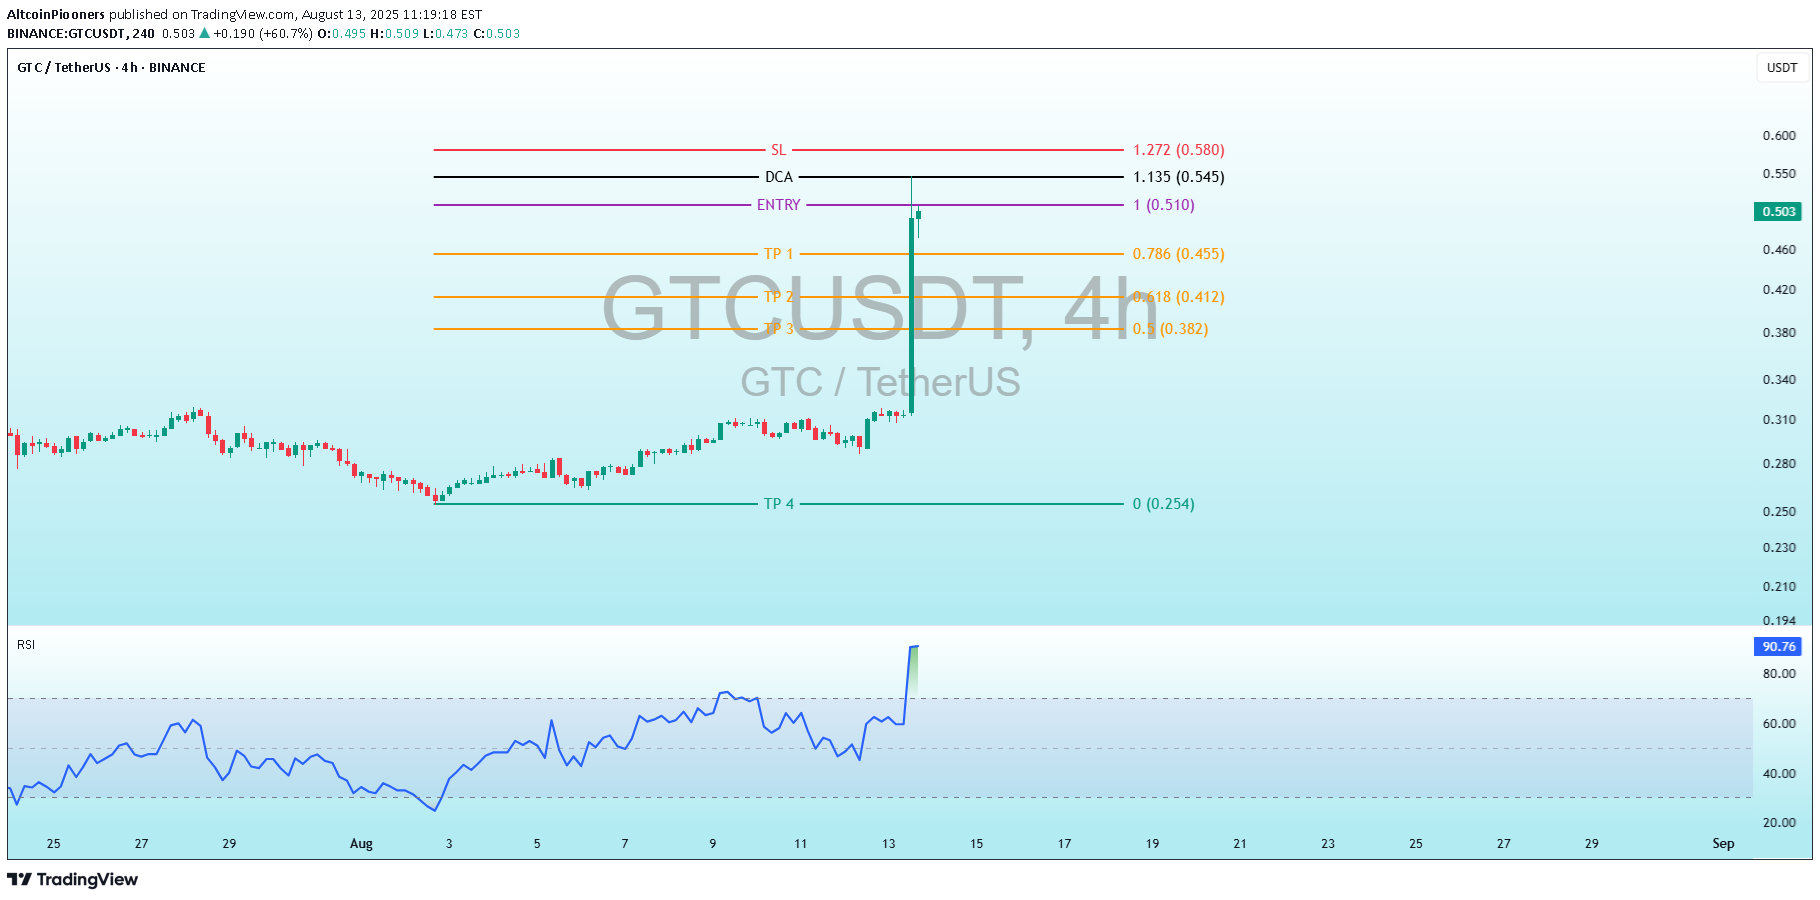
GTCUSDT Master the Surge: GTC 4H Trading Guide with RSI Peak Trading Levels: Entry: 1.00 (0.510 USDT) - The level where the initial purchase is planned. DCA (Dollar-Cost Averaging): 1.135 (0.549 USDT) - An additional buying point if the price rises (note: same value as Entry, possibly a typo). SL (Stop Loss): 1.272 (0.586 USDT) - The level where the loss would be limited. TP (Take Profit):TP1: 0.786 (0.455 USDT) TP2: 0.618 (0.412 USDT) TP3: 0.5 (0.382 USDT) TP4: 0.254 (0.254 USDT) - A significantly lower target, possibly a long-term goal. RSI (Relative Strength Index) Indicator: The current RSI value is 90.72, which is well into the overbought territory (above 70, and nearing 90). This suggests the price may be overextended, indicating a potential reversal or correction soon. Analysis and Interpretation:Strategy: The chart employs Fibonacci levels to set entry, exit, and loss points. The entry is planned at 0.549 USDT, with a DCA at the same level (which may be an error), and a stop loss at 0.586 USDT to protect capital. Profit Targets: TP1 to TP3 are based on Fibonacci retracement levels (0.786, 0.618, 0.5), indicating a technical approach to securing profits incrementally. TP4 at 0.254 USDT seems unusually low and might reflect a long-term target or an error. RSI: The extremely high RSI value (90.72) signals a strong overbought condition. This could imply an imminent pullback or consolidation, especially if the price fails to sustain its recent surge. Recommendation: Monitor the price closely around the entry level (0.549 USDT). Given the overbought RSI, consider caution with new entries or prepare for a potential sell-off.GTC TP 1 ✅ +12.13% PROFIT 🚀 The only limit to our realization of tomorrow is our doubts of today. Interested for Premium 👉 t.me/Altcoin_Piooners Follow for signals! 🔥 #Crypto #Stablecoin

CryptoAnalystSignal
#GTC/USDT Long Trade Plan
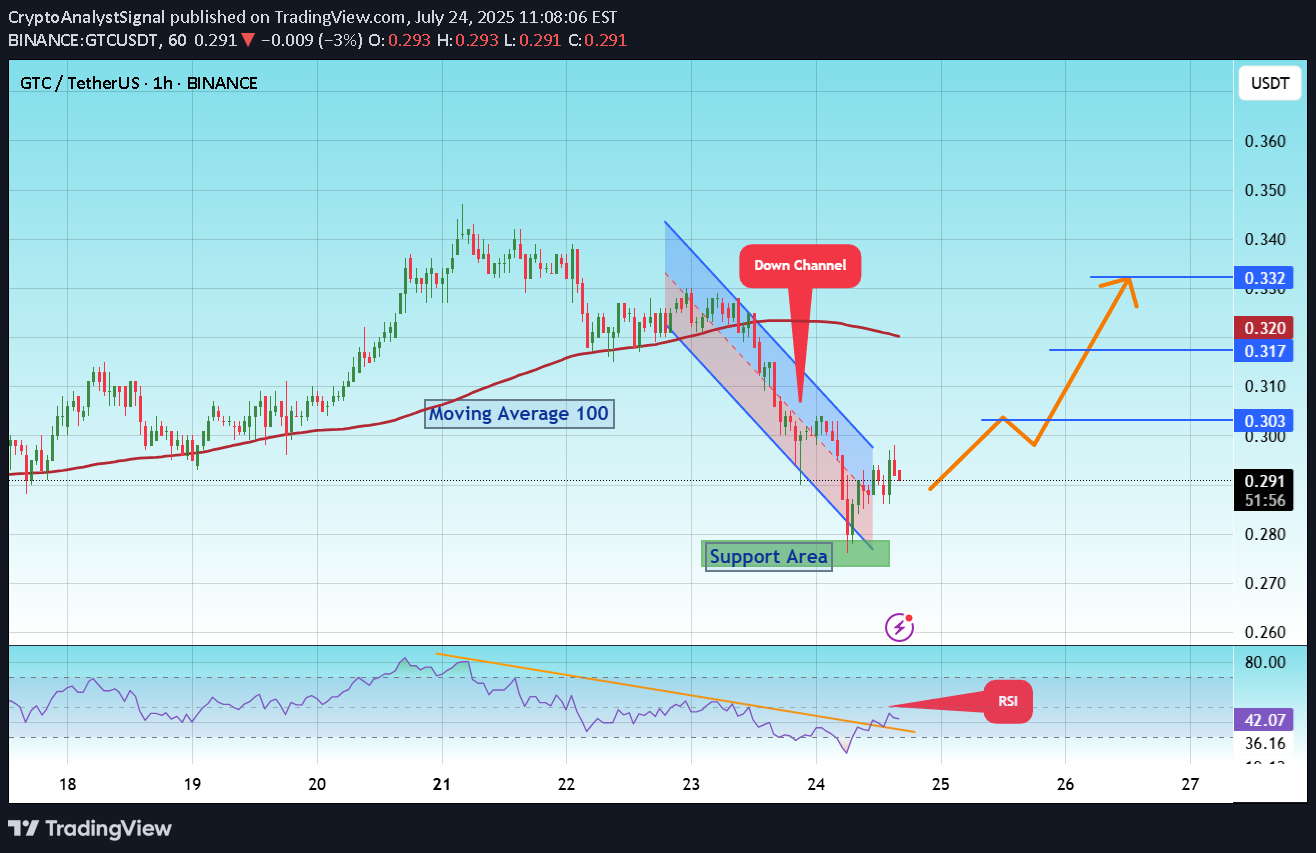
#GTC The price is moving within a descending channel on the 1-hour frame and is expected to break and continue upward. We have a trend to stabilize above the 100 moving average once again. We have a downtrend on the RSI indicator that supports the upward break. We have a support area at the lower boundary of the channel at 0.282, acting as strong support from which the price can rebound. We have a major support area in green that pushed the price upward at 0.275. Entry price: 0.293 First target: 0.303 Second target: 0.317 Third target: 0.332 To manage risk, don't forget stop loss and capital management. When you reach the first target, save some profits and then change the stop order to an entry order. For inquiries, please comment. Thank you.#GTC First target: 0.303 Reached Second target: 0.317 Reached Third target: 0.332 Reached
CryptoAnalystSignal
#GTC/USDT
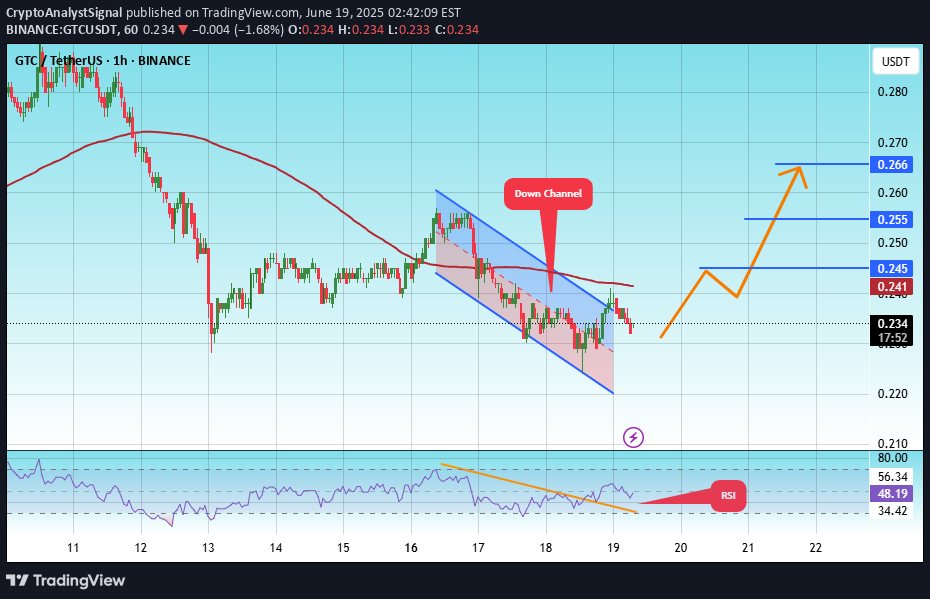
#GTC The price is moving within a descending channel on the 1-hour frame, adhering well to it, and is heading towards a strong breakout and retest. We are seeing a bounce from the lower boundary of the descending channel. This support is at 0.224. We have a downtrend on the RSI indicator that is about to be broken and retested, which supports the upward trend. We are looking for stability above the 100 moving average. Entry price: 0.234 First target: 0.245 Second target: 0.255 Third target: 0.266#GTC First target: 0.245 Reached Second target: 0.255 Reached Third target: 0.266 Reached

Kapitalist01
çalışma amaçlıdr

در نمودار 15 دقیقهای، کندلهای مربوط به ساعات مشخص شده میتوانند به عنوان سطوح حمایت یا مقاومت عمل کنند. معاملات خرید بالاتر از میانگین متحرک نمایی 8 دورهای (EMA) و معاملات فروش پایینتر از آن انجام شود. یادداشت شخصی برای معاملات کوتاه مدت (شناسایی زمان در نمودار 15 دقیقهای انجام شده است). این توصیه سرمایهگذاری نیست.

weslad
GTC Eyes Reversal from Accumulation Base

GTC/USDT is bouncing off a long-term descending channel’s base, showing possible signs of accumulation. A move toward the $0.55–$0.75 supply zone is expected, with a potential breakout targeting $2.23 if momentum sustains. We must pay a close attention to a breakdown below $0.248 which will open a downward move towards $0.074 as final and critical support.Nice reaction from the buy zone
CryptoAnalystSignal
#GTC/USDT

#GTC The price is moving in a descending channel on the 1-hour frame and is expected to continue upwards We have a trend to stabilize above the moving average 100 again We have a descending trend on the RSI indicator that supports the rise by breaking it upwards We have a support area at the lower limit of the channel at a price of 0.355 Entry price 0.373 First target 0.384 Second target 0.394 Third target 0.405#GTC First target 0.384 Reached Second target 0.394 Reached Third target 0.405 Reached

Black_Scorpions_Tr
GTC/USDT - SPOT - DCA

GTC/USDT - SPOT - DCA❗ This is not financial advice, and if you decide to enter, you are responsible for your decision.A signal on the Whale Catcher indicatorThis is not a recommendation to buy or sellWhale Catcher IndicatorThe Whale Catcher Indicator is an advanced technical analysis tool designed to detect the movements of major market players (whales) and identify zones likely to experience significant price activity. The indicator is based on complex mathematical calculations that combine moving averages with the analysis of high and low price levels over specific timeframes.

TypicalTraders
GTC will big pump

An identical chart can be seen with many lagging altcoins: -97%, tanked right after listing in 2021. Currently ranked #552 on CoinMarketCap, if that means anything to you. Overall, this is a low-liquidity asset, but it will pump eventually; a complete collapse is unlikely.Targets are marked on the chart. The potential is significant, but keep in mind that a pullback to $0.56 and $0.32 is possible. For an active phase, the asset needs to break out of the descending channel. You can set a trigger order to buy slightly higher or avoid overthinking and buy at market price, then accumulate more if it drops. Overall, it’s already a cheap asset.

Crypto_alphabit
#GTC (SPOT) entry ( 0.540- 0.840) T.(7.3 ) SL(0.528)

GTCUSDT entry range ( 0.540- 0.840)Targets ( 1.59 - 2.09 - 4.26 - 7.3 )1 Extra Targets(optional) in chart, if you like to continue in the trade with making stoploss very high.SL .4H close below (0.528)______________________________________________________________Golden Advices.********************* collect the coin slowly in the entry range.* Please calculate your losses before the entry.* Do not enter any trade you find it not suitable for you.* No FOMO - No Rush , it is a long journey.Useful Tags.****************My total poststradingview.com/ideas/crypto_alphabit/1Million Journeytradingview.com/ideas/1m_journey/tradingview.com/ideas/1_million_journey/**********************************************************************************************#Manta #OMNI #DYM #AI #IO #XAI #ACE #NFP #RAD #WLD #ORDI #BLUR #SUI #VOXEL #AEVO #VITE #APE #RDNT #FLUX #NMR #VANRY #TRB #HBAR #DGB #XEC #ERN #ALT #IO #ACA #HIVE #ASTR #ARDR #PIXEL #LTO #AERGO #SCRT #ATA #HOOK #FLOW #KSM #HFT #MINA #DATA #SC #JOE #RDNT #IQ #CFX #BICO #CTSI #KMD #FXS #DEGO #FORTH #AST #PORTAL #CYBER #RIF #ENJ #ZIL #APT #GALA #STEEM #ONE #LINK #NTRN #COTI #RENDER #ICX #IMX #ALICE #PYR #PORTAL #GRT #GMT #IDEX #NEAR #ICP #ETH #QTUM #VET #QNT #API3 #BURGER #MOVR #SKL #BAND #ETHFI #SAND #IOTX #T #GTCUpdating….1 December 2024 44% profit from the lowest point in entry range & 39% profit from the highest point in entry range

V-Bozkurt
Gitcoin Teknik Görünüm $gtc #gtc

channel bottom main support, channel exit stop loss. middle band 7 usd target.
Disclaimer
Any content and materials included in Sahmeto's website and official communication channels are a compilation of personal opinions and analyses and are not binding. They do not constitute any recommendation for buying, selling, entering or exiting the stock market and cryptocurrency market. Also, all news and analyses included in the website and channels are merely republished information from official and unofficial domestic and foreign sources, and it is obvious that users of the said content are responsible for following up and ensuring the authenticity and accuracy of the materials. Therefore, while disclaiming responsibility, it is declared that the responsibility for any decision-making, action, and potential profit and loss in the capital market and cryptocurrency market lies with the trader.