
weslad
@t_weslad

What symbols does the trader recommend buying?
Purchase History
پیام های تریدر
Filter
weslad
رالی نجات دوجکوین پیش از سقوط نهایی: آیا ۰.۱۲ دلار آخرین فرصت است؟
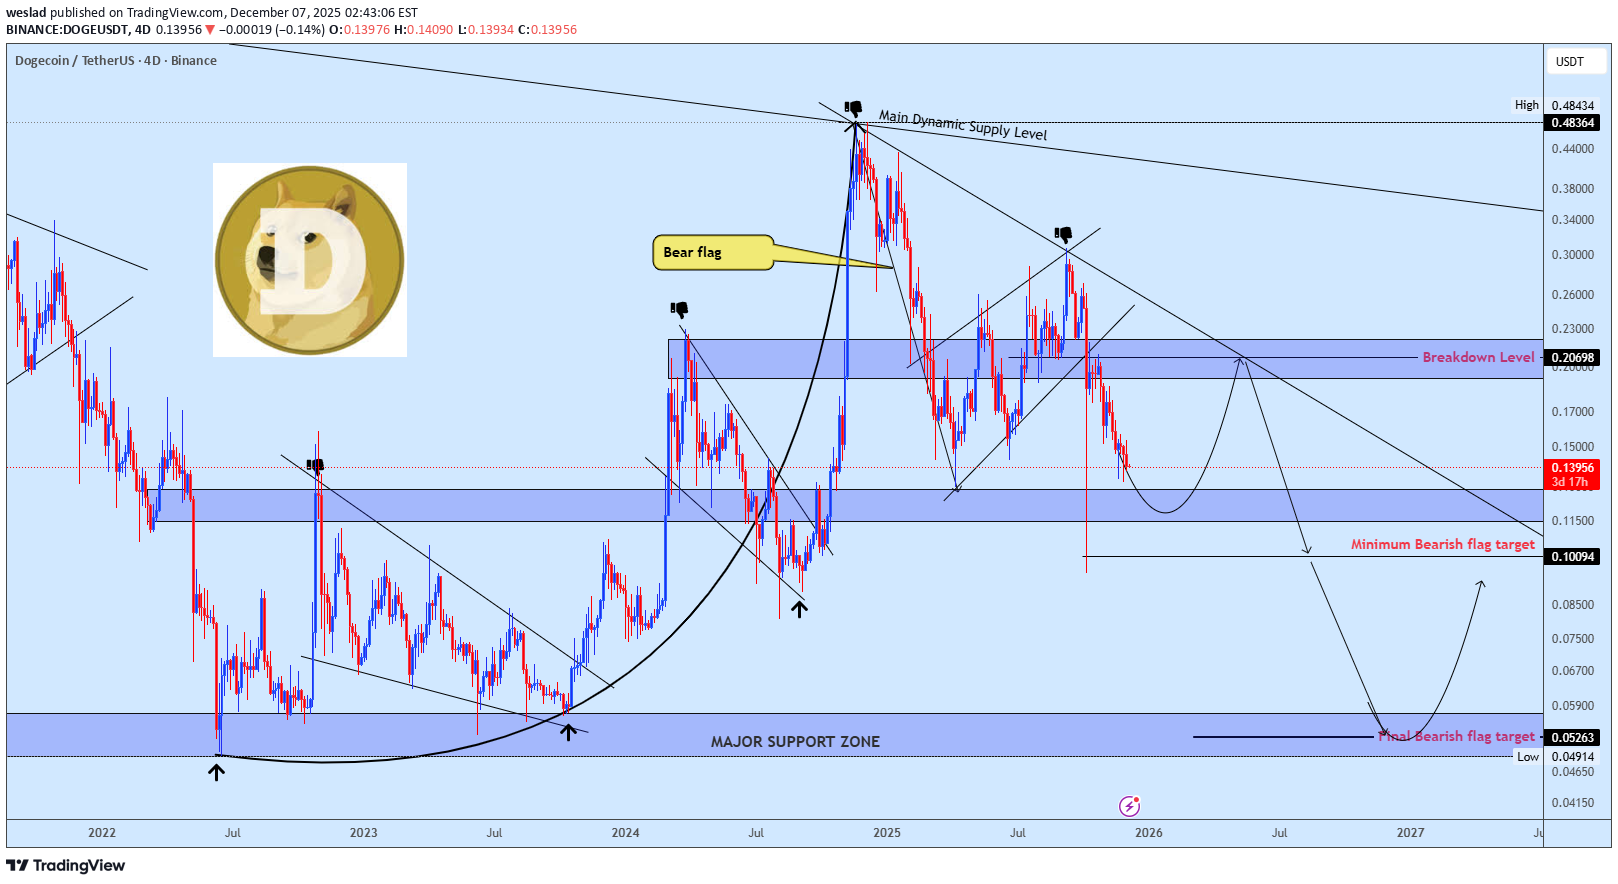
DOGEUSDT has initiated a clean corrective structure following the creation of a bearish flag. The breakdown from the flag triggered a strong downward leg, confirming the shift in momentum and validating the continuation pattern. At the moment, the market is trading below the breakout zone, and further price development is expected to unfold through a relief rally. The immediate plan is to monitor a pullback toward the minimum bearish flag targets around the $0.12 region, which aligns with the former structure support and breakout zone. This area is likely to serve as supply on the retest, where rejection is anticipated to resume the broader corrective move. The final downside target has been mapped on the chart, and the price action will remain bearish as long as market structure continues to respect the breakdown level.
weslad
سقوط قریبالوقوع فِت (FET)؟ تحلیل کلیدی قیمت و نقطه برگشت احتمالی
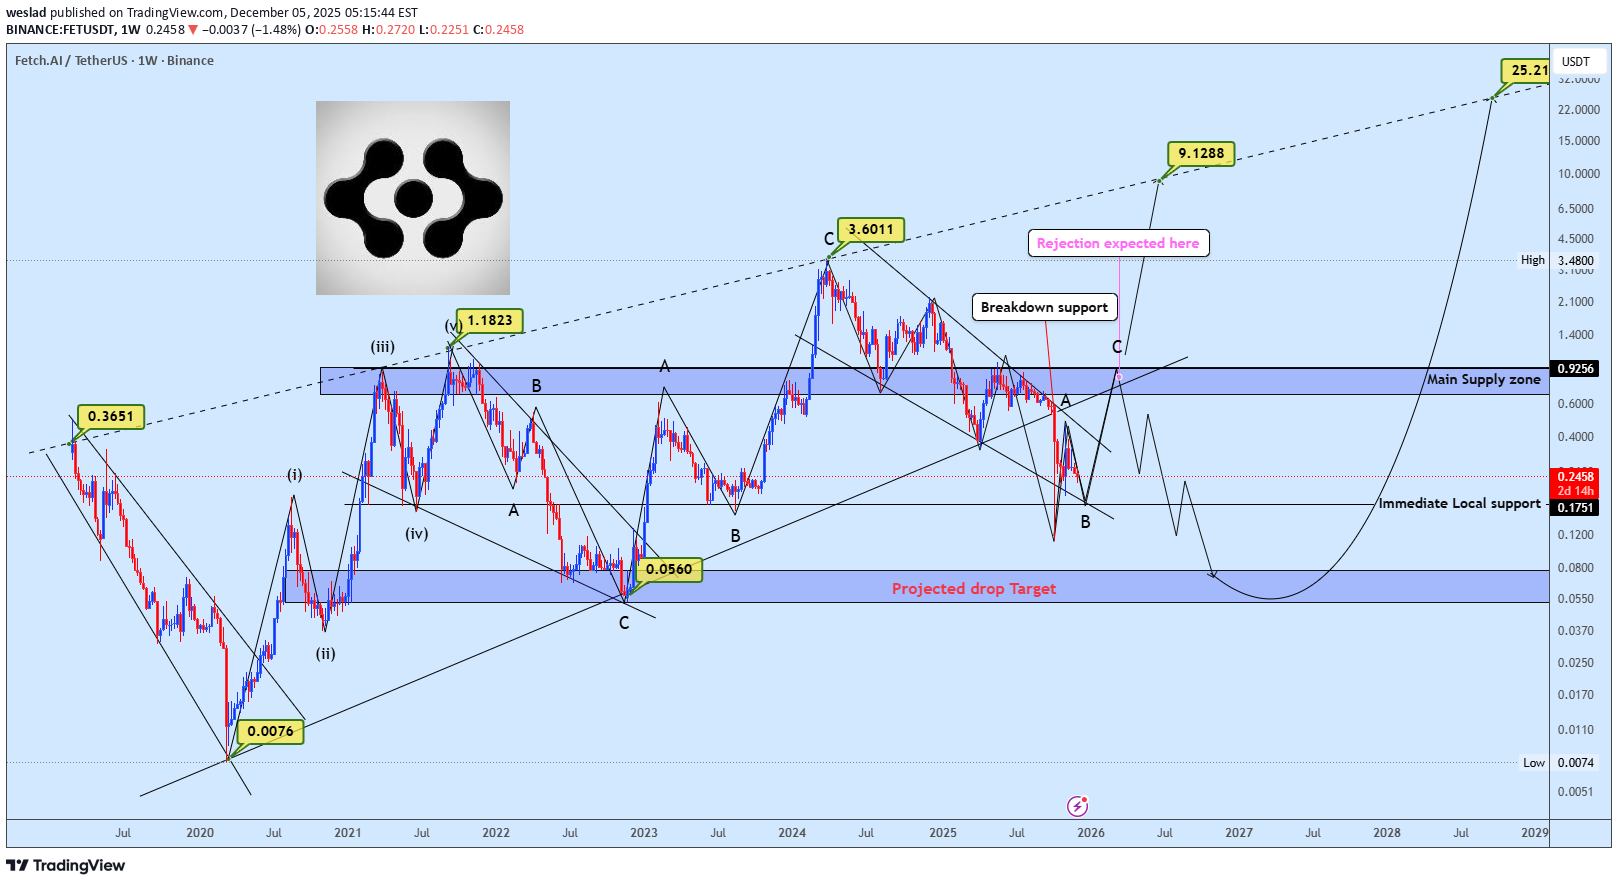
FETUSDT has completed a classical rising wedge distribution which triggered a clean breakdown into the $0.53 zone, shifting the short term structure from demand led momentum into corrective flow. Price is now trading beneath the major support that previously served as demand, turning it into an active supply zone. Current structure favors planning around the pullback any relief rally back into the supply area offers an ideal region to monitor for rejection and continuation of the corrective leg. However, a decisive breakout and acceptance above the supply zone would invalidate the immediate bearish thesis and open the door for bullish continuation, with the market attempting to resume trend as clearly outlined on the chart.
weslad
صعود سولانا (SOL) تا کجا ادامه دارد؟ منطقه حیاتی که جهت بازار را تعیین میکند!
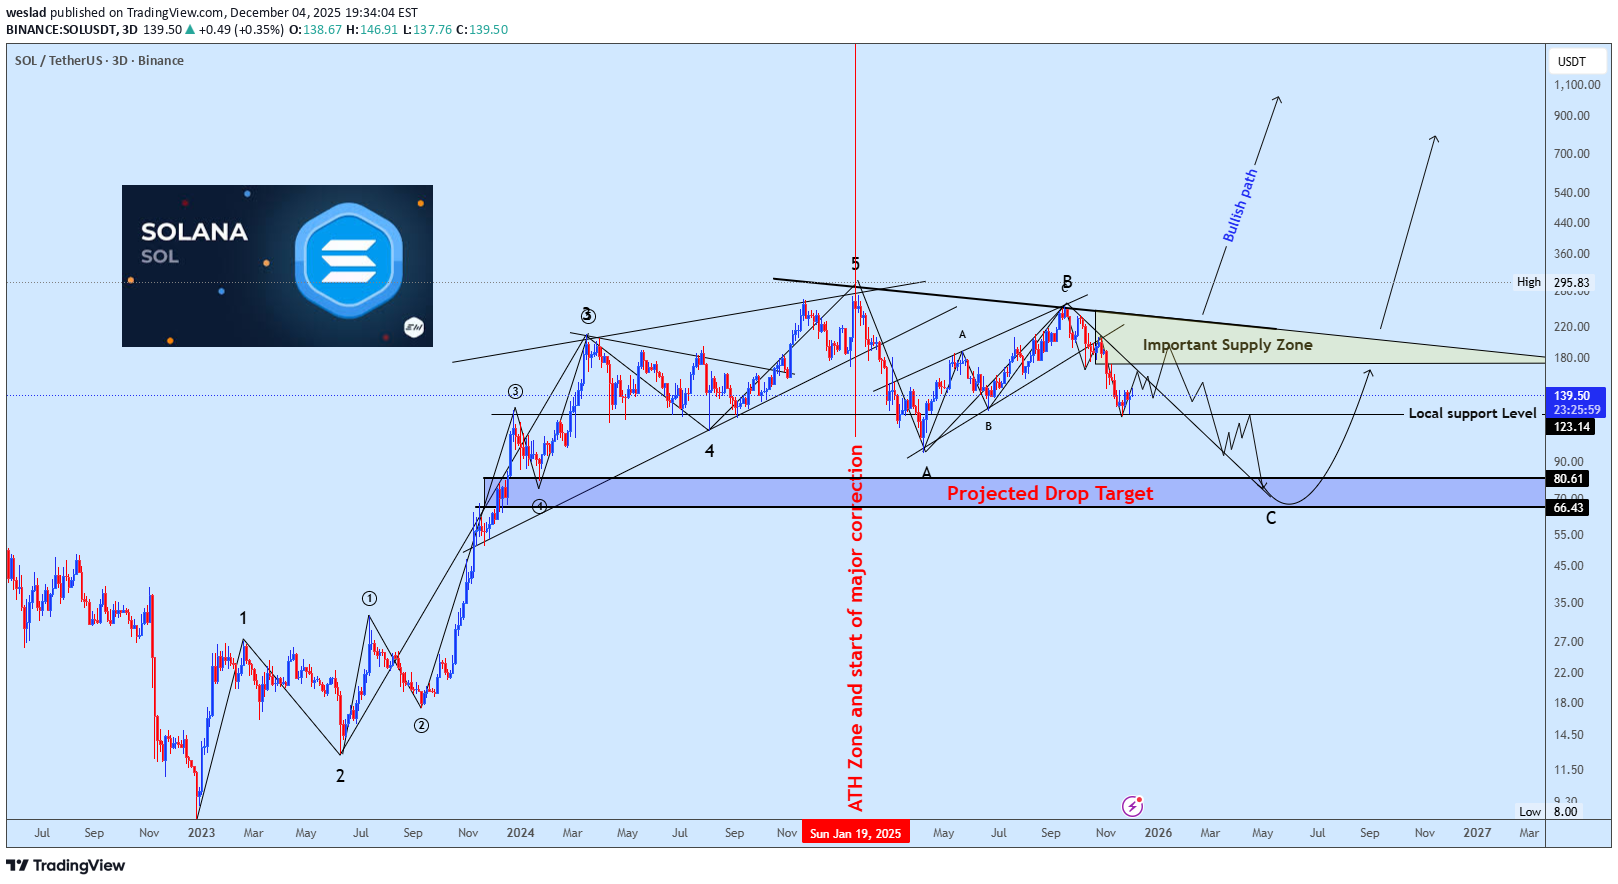
SOLUSDT has been grinding through a deep corrective phase since the January 2025 ATH. Wave A established the base, and price action is now developing the final leg of the structure. If the pattern completes fully, the extension could stretch toward the $80 zone before true recovery begins. For now, the market is attempting a relief rally from the $123 support. Price is heading straight into a key supply block, and this zone will decide everything: 🔺 Break and hold above = bullish shift resumes 🔻 Rejection = deeper correction, wave C continues This is the moment where trend direction becomes clear. Any breakout from this supply area will ignite strong momentum and could change the narrative completely. The structure remains clean, and volatility is building. The thread will be updated as the move develops. Drop your thoughts below, are you watching the same zone?
weslad
بیت کوین آماده پرش پارابولیک بعدی: صبر کلید رسیدن به ۱۰۰ هزار دلار و فراتر!
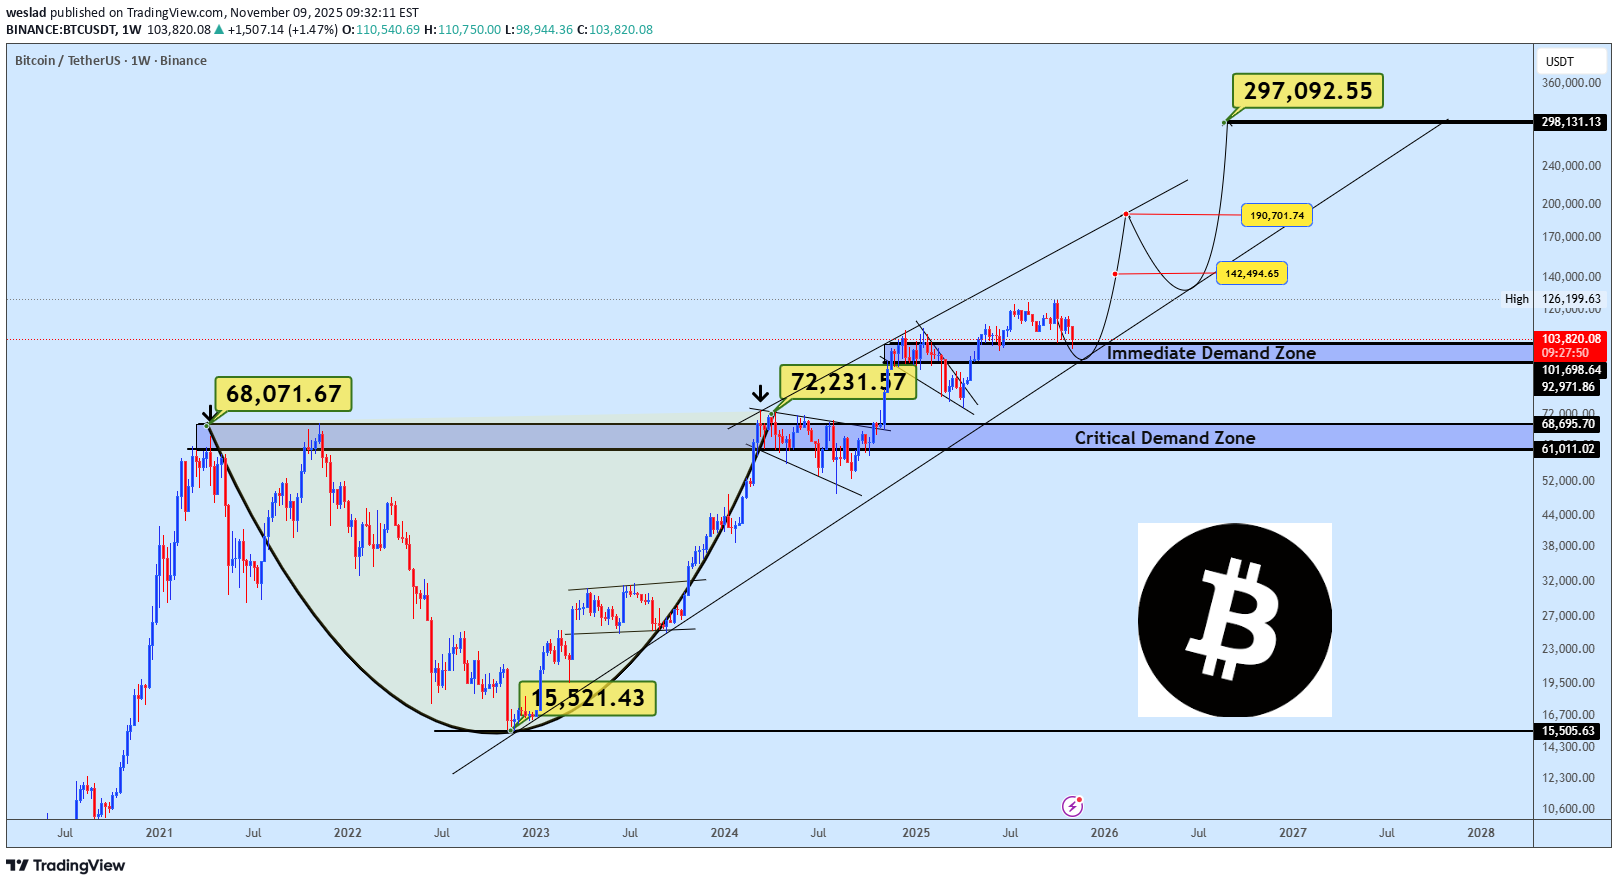
Bitcoin continues to respect its macro bullish structure, maintaining a firm stance above both the Critical and Immediate Demand Zones. The recent consolidation is acting as a natural pause within the broader uptrend a healthy retest phase rather than a reversal. The $92k–$101k zone remains the immediate area of interest, where we expect buyers to regain dominance if tested. Sustaining above this structure keeps the market aligned for another expansion wave targeting $142k–$190k, with the final projection extending toward the $297k region in the next major bullish leg. As long as price holds above the defined demand areas, the long-term outlook remains decisively bullish. Corrections within this channel are accumulation opportunities, not signs of weakness.Bitcoin’s recovery is unfolding gradually as anticipated. For now, focus remains on the immediate demand zone, a key area for potential reloading before targeting the falling wedge resistance near $110k. A rejection from this level could trigger another lower low, as outlined by the red path, while a clean breakout would confirm renewed bullish momentum with targets extending toward $127k. Key support to watch: $103,500 zone, holding above it keeps the broader bullish structure intact.
weslad
جمع شدن غول ارز دیجیتال DYDX: آیا شاهد رالی سه رقمی خواهیم بود؟

DYDXUSDT has shown remarkable resilience after bouncing from the extreme demand area, where strong buyers stepped in to absorb the final phase of the decline. Since then, price has been shaping a clean rounding bottom, a classic structure that often signals the beginning of a long-term reversal. Our plan remains to accumulate within the defined accumulation zone, which technically represents a solid base for the upcoming bullish leg. The immediate target is the key supply zone highlighted on the chart a level likely to trigger the first major reaction. From a structural perspective, that reaction could lead to a controlled pullback, potentially carving out an Inverse Head and Shoulders (ISHS) formation. Such a setup would serve as a powerful bullish continuation structure one that could propel DYDX into the 3-digit territory in the broader cycle. Patience and positioning will define this phase. Smart money builds quietly before the crowd notices.
weslad
رمزگشایی بیت کوین: آیا شکست ۱۱۶ هزار دلار، مسیر رسیدن به ۱۳۰ هزار دلار را باز میکند؟
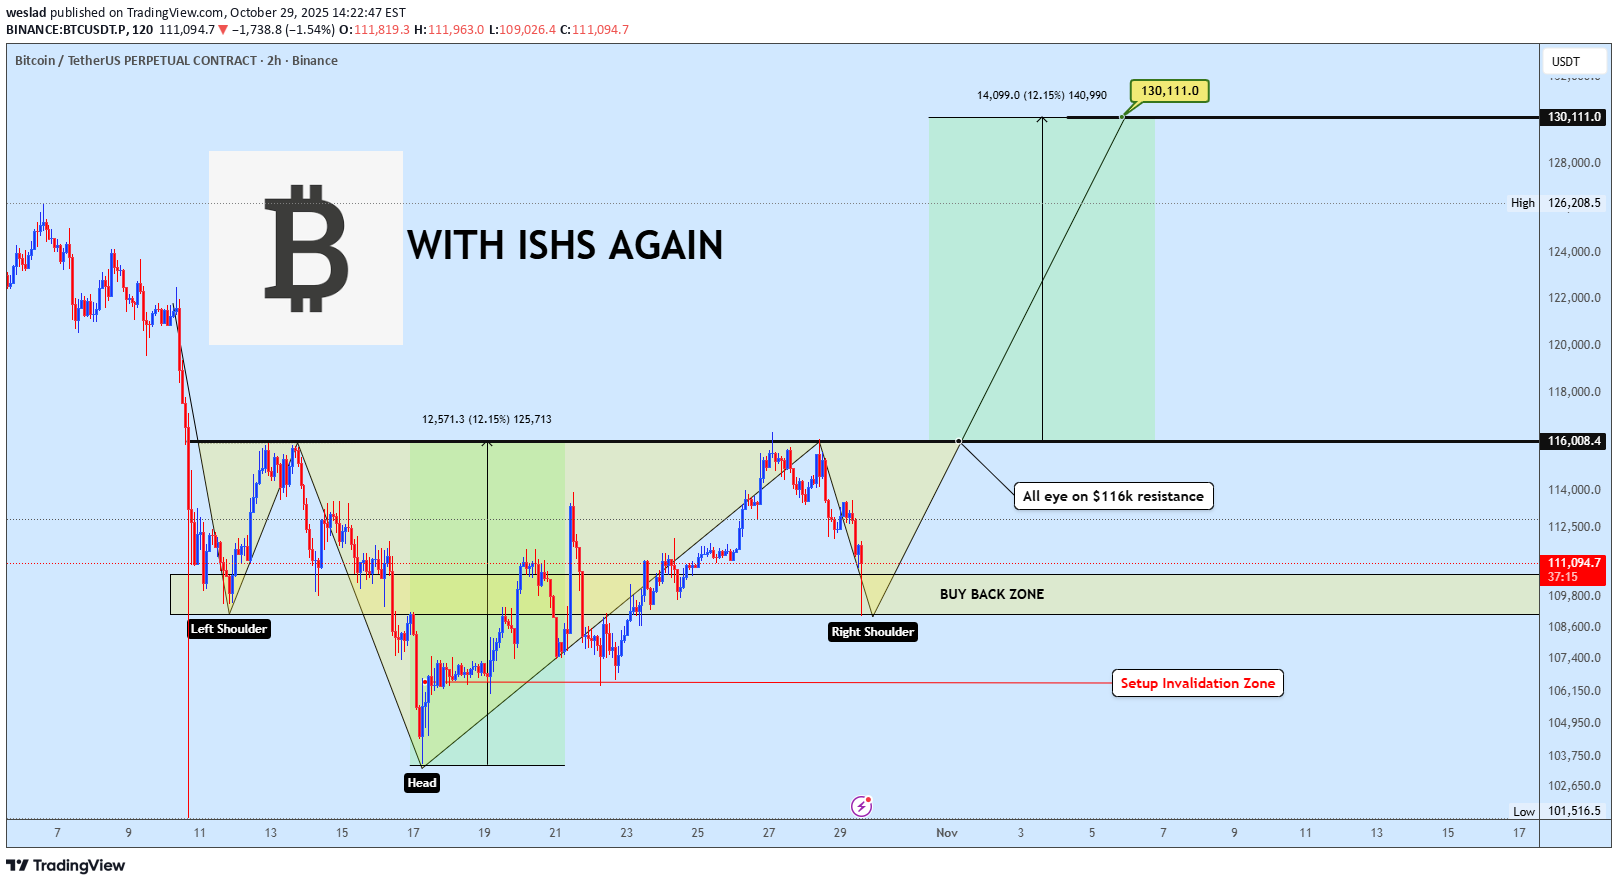
Bitcoin is once again shaping a clean Inverse Head and Shoulders (ISHS) structure — a classical bullish reversal pattern. Price is currently trading within the Buy Back Zone, forming the right shoulder of the setup. As long as the structure holds above the setup invalidation zone, this pattern remains valid. All eyes are now on the $116K neckline, which represents the critical breakout level. A decisive close above this resistance should confirm the ISHS completion, unlocking a potential measured move target toward $130K. Until the neckline breaks, expect short-term fluctuations within the shoulder zone but structure wise, bulls still hold the advantage. What’s your take? Do you think BTC can clear $116K and reach $130K next? Share your thoughts and views in the comments below!The shakeout seems to be over now, the structure still looking very much same and likely for ISHS to cleanly play out.At same time this can also be ascending triangle structure. The target also pointing above $130kAll hope isn’t lost yet for the bulls. The wick from October 10th gave market makers plenty of room for manipulation and liquidity sweeps, but despite that, we still got a strong bullish close on the 8-hour timeframe and that’s hard to ignore. We may be preparing for another re-test towards $116k again.I still very much believe in this
weslad
تحلیل طلا: ریزش قاطع سقف دوگانه و پرچم نزولی؛ آیا قیمت به ۳۷۰۰ دلار میرسد؟
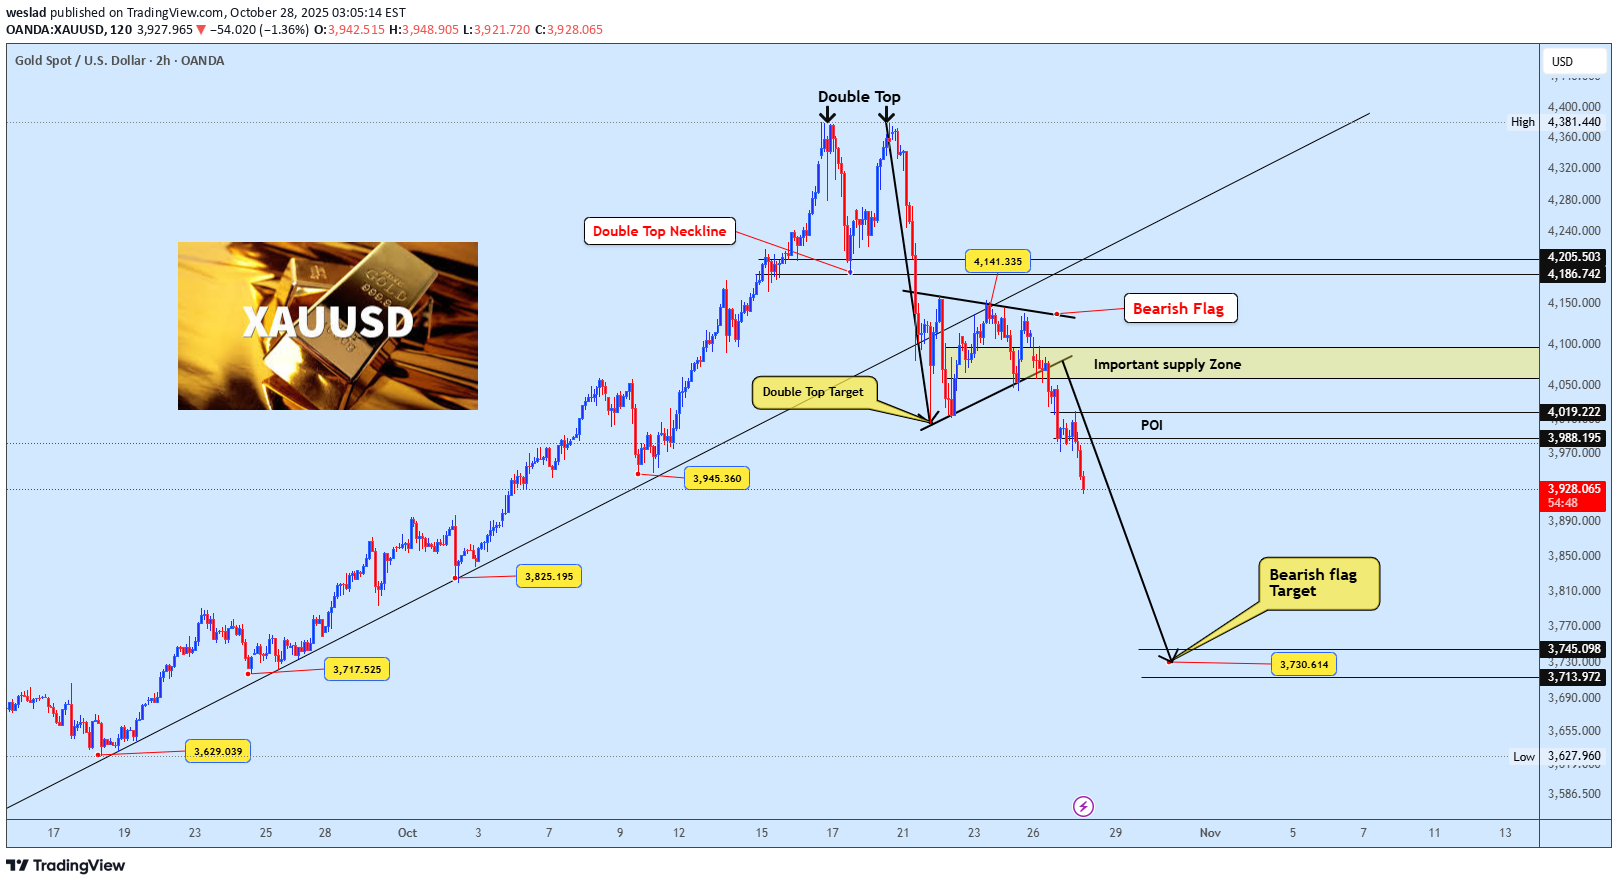
Gold has completed a double top reversal, hitting its measured target before forming a bearish flag under the key supply zone. As price remains capped below $4,050–$4,200, bearish momentum could continue toward the $3,700 region, aligning with the flag target. We should watch the $4,020 POI zone closely any retest and rejection from that area could confirm continuation to the downside. 💬 Share your thoughts below and don’t forget to like & share if this analysis adds value!Gold rejected from the point of interest zone
weslad
بیت کوین در آستانه صعود به ۱۶۰ هزار دلار: تحلیل الگو و فرصت خرید هیجانانگیز!
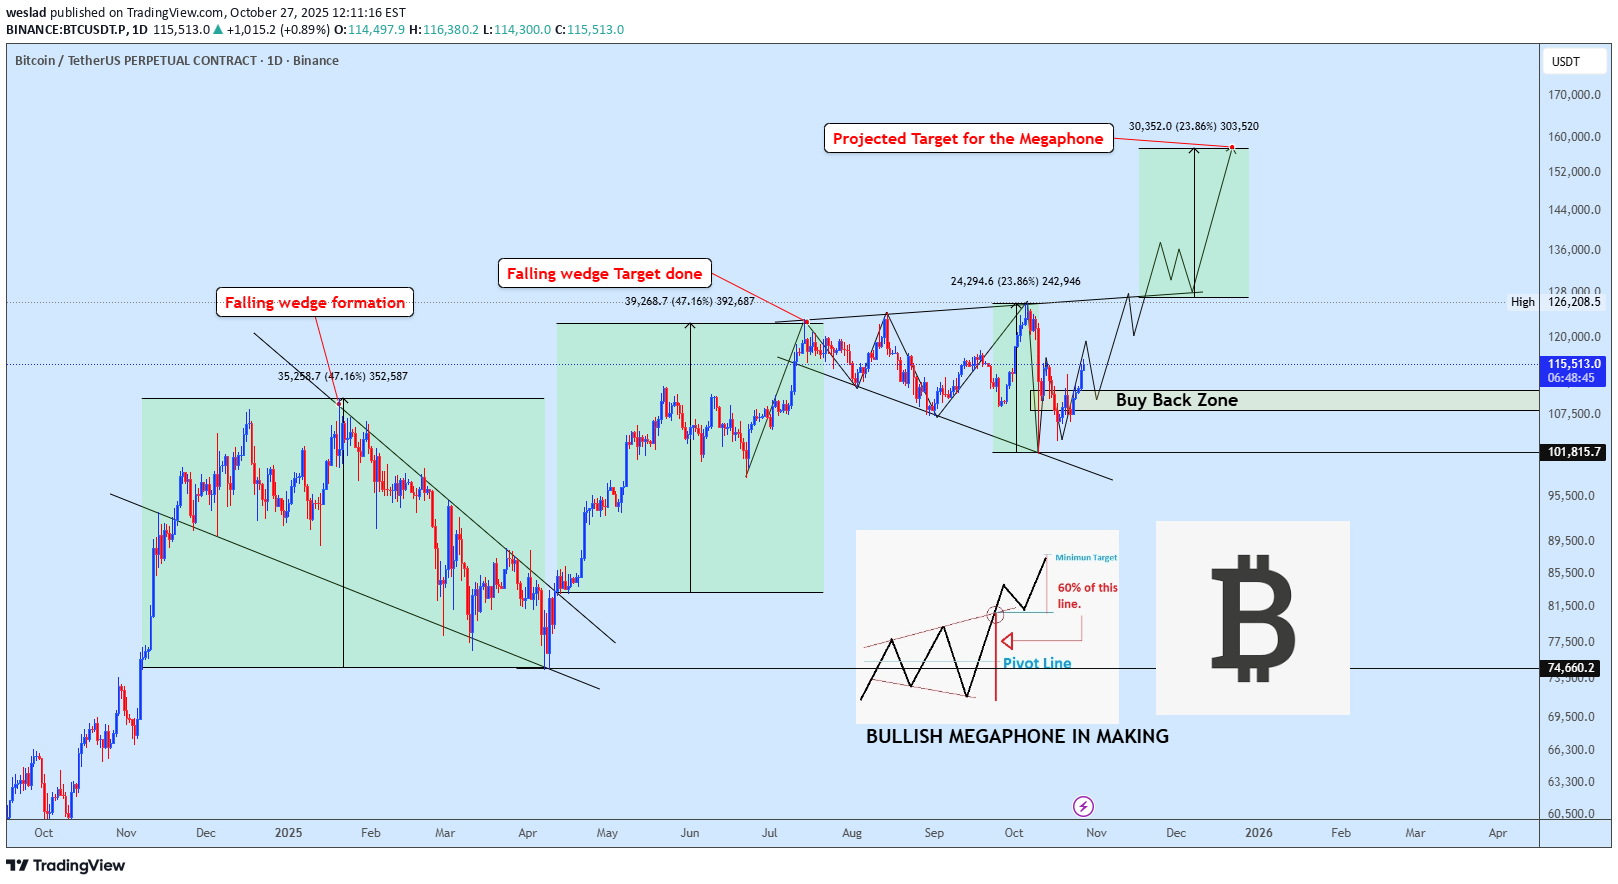
BTCUSDT has completed its previous falling wedge pattern, fully reaching its projected target. Price is now consolidating within a developing bullish megaphone structure, suggesting continued expansion and volatility. If structure holds, the next projected upside target points toward the $160K zone over the medium term. Meanwhile, there’s a CME gap around the $110K level, which could attract a sharp move toward that zone aligning with our buy-back region. If price revisits this area, it could present a strong buying opportunity before the next major upside leg. Share your thoughts in the comments don’t forget to like and share if you find this analysis helpful. Drop your altcoins below, and I’ll review and analyze them for you!BITCOIN Update: ISHS Setup in Play! BTC's Make or Break Zone: Will $101K Hold? BITCOIN Market Resilience Amid the Bloodbath Bitcoin’s Bloodbath Was a Setup Smart Money Knows It BITCOIN The Super Cycle Still Unfolding Wave 3 in Motion! The Final Ascent: BTC's $165K Launchpad Before the Great ResetDrop your altcoins below, and I’ll review and analyze them for you!Anticipating a solid price move to finalize the setup.This is not the time to be panic, BTC is very bullish, we just need to clear that silly CME Gap and BOOM🚀🚀🚀#BTC Repainted classic ISHS BTC with ISHS again, could this one give the major upside moves. What’s your take? Do you think BTC can clear $116K and reach $130K next? ♻️♻️ Share your thoughts and views in the comments!
weslad
CRUUSDT به حمایت قوی نزدیک میشود: فرصت خرید در انتظار است؟
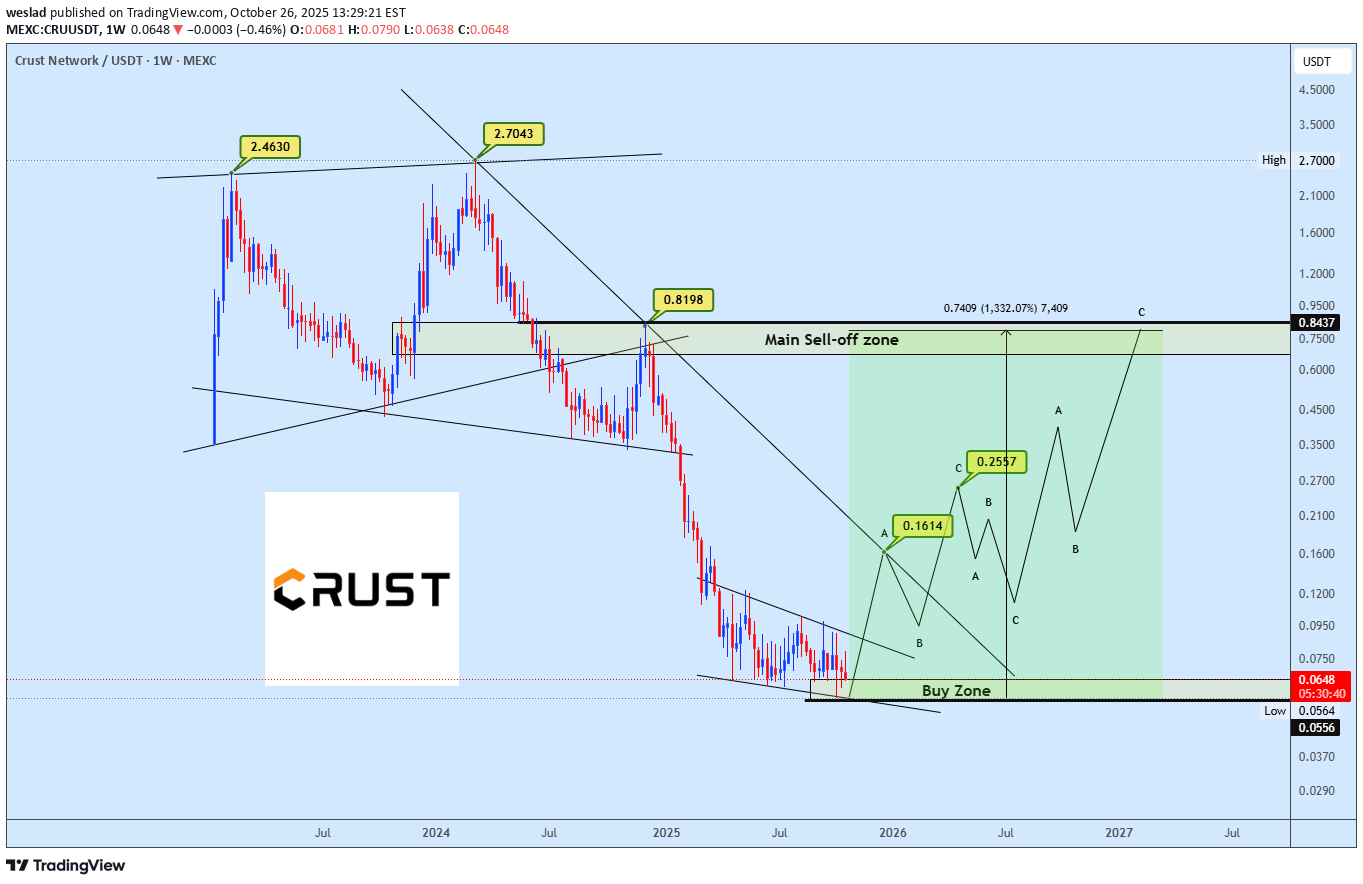
CRUUSDT is approaching a strong support zone, with price action hinting at a possible ending diagonal to complete the broader WXY corrective structure. Plan: watch for confirmation within the buy zone and look to follow the move toward the main sell-off area once momentum shifts.
weslad
تحلیل بیت کوین: آیا الگوی سروشانهی وارونه در راه است؟ (هدف ۱۲۴ هزار دلار)
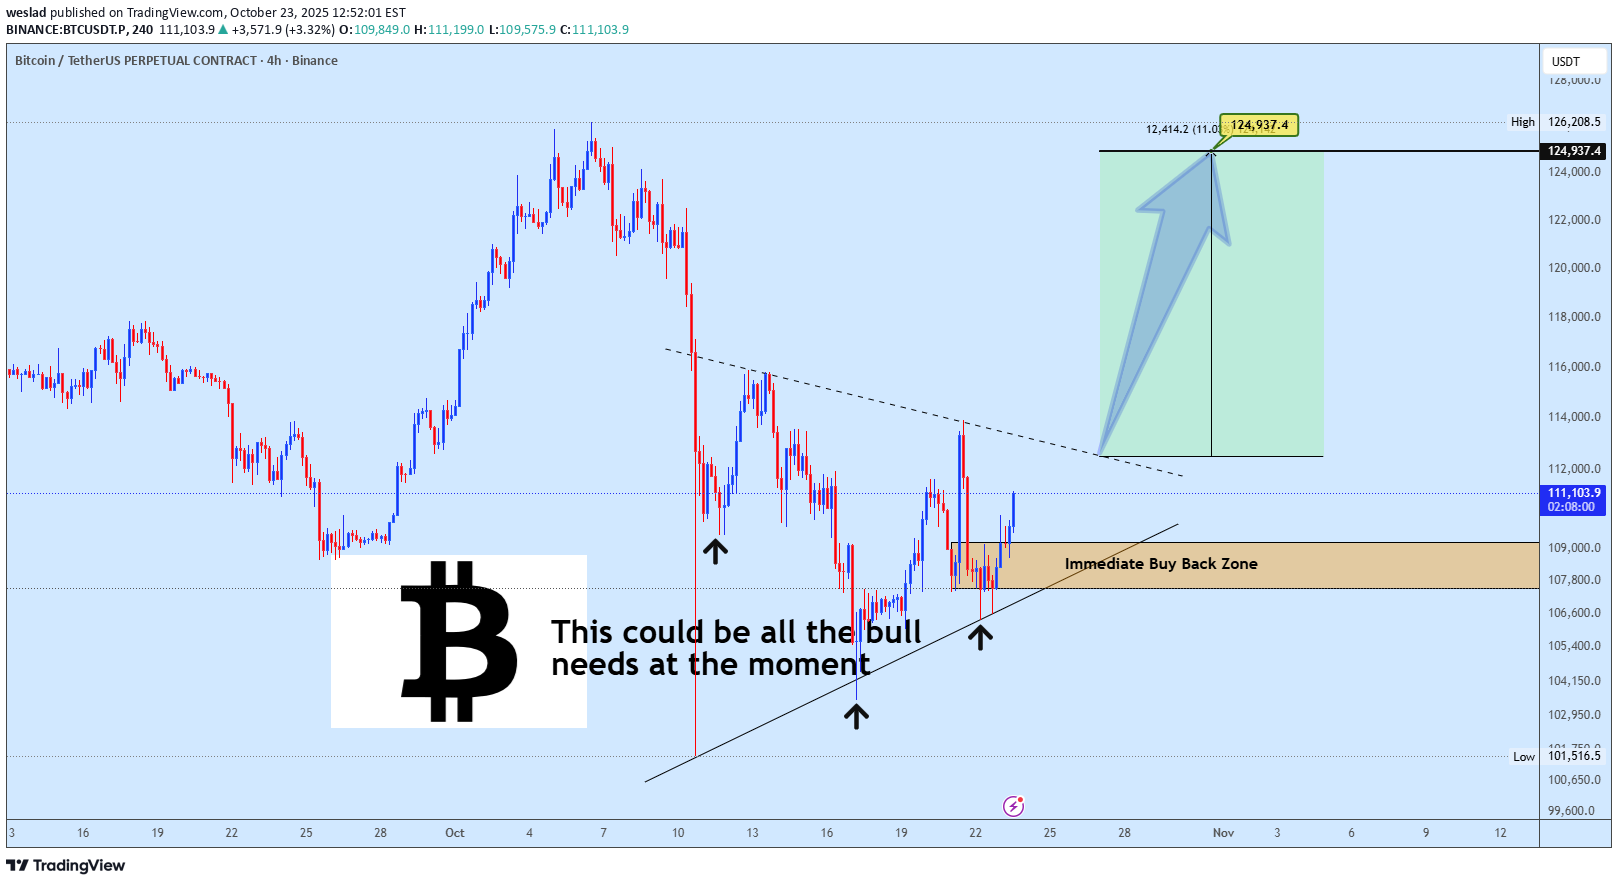
Bitcoin continues to respect the ascending structure with a potential Inverse Head & Shoulders forming along the Immediate Buy Back Zone (107k–109k). The current bounce aligns perfectly with the neckline projection towards $124,937, which also sits near the previous resistance zone. As long as price holds above the short-term trendline, bullish continuation remains valid. Any rejection around $113k may still retest the zone before the next impulsive leg. 📈 This could be all the bulls need at the moment. Share what you think about this short play.We are still watching this closely.The setup still developing
Disclaimer
Any content and materials included in Sahmeto's website and official communication channels are a compilation of personal opinions and analyses and are not binding. They do not constitute any recommendation for buying, selling, entering or exiting the stock market and cryptocurrency market. Also, all news and analyses included in the website and channels are merely republished information from official and unofficial domestic and foreign sources, and it is obvious that users of the said content are responsible for following up and ensuring the authenticity and accuracy of the materials. Therefore, while disclaiming responsibility, it is declared that the responsibility for any decision-making, action, and potential profit and loss in the capital market and cryptocurrency market lies with the trader.