
GLMR
Moonbeam
| تریدر | نوع سیگنال | حد سود/ضرر | زمان انتشار | مشاهده پیام |
|---|---|---|---|---|
No results found. | ||||
Price Chart of Moonbeam
سود 3 Months :
سیگنالهای Moonbeam
Filter
Sort messages by
Trader Type
Time Frame

سقوط دوباره گلمیم (GLMR): آیا قیمت به زیر ۰.۲ دلار میرسد؟

Look break down again, short GLMR may takes long term to 0.2 or under.

MohamedSewid
تحلیل تکنیکال GLMR: آیا موج صعودی تاریخی در راه است؟
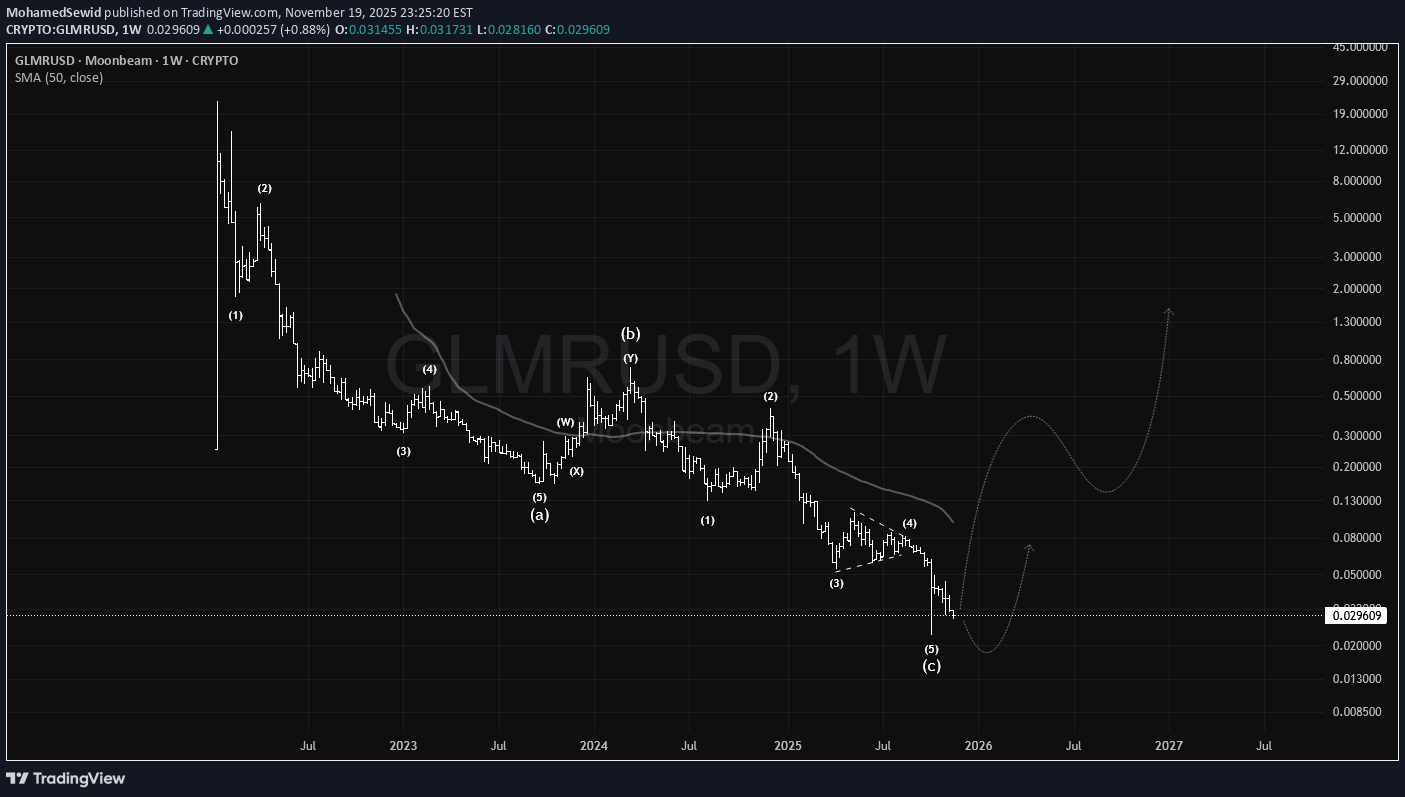
#GLMR is a low–mid market cap token that has been falling since issuance and now appears to be completing a historical zigzag pattern, typically followed by a motive wave. Whether it rises from here or after a final dip, it remains a strong long-term opportunity. #Moonbeam

آینده مبهم مونبیم (Moonbeam): آیا این آخرین سقوط قبل از جهش بزرگ است؟
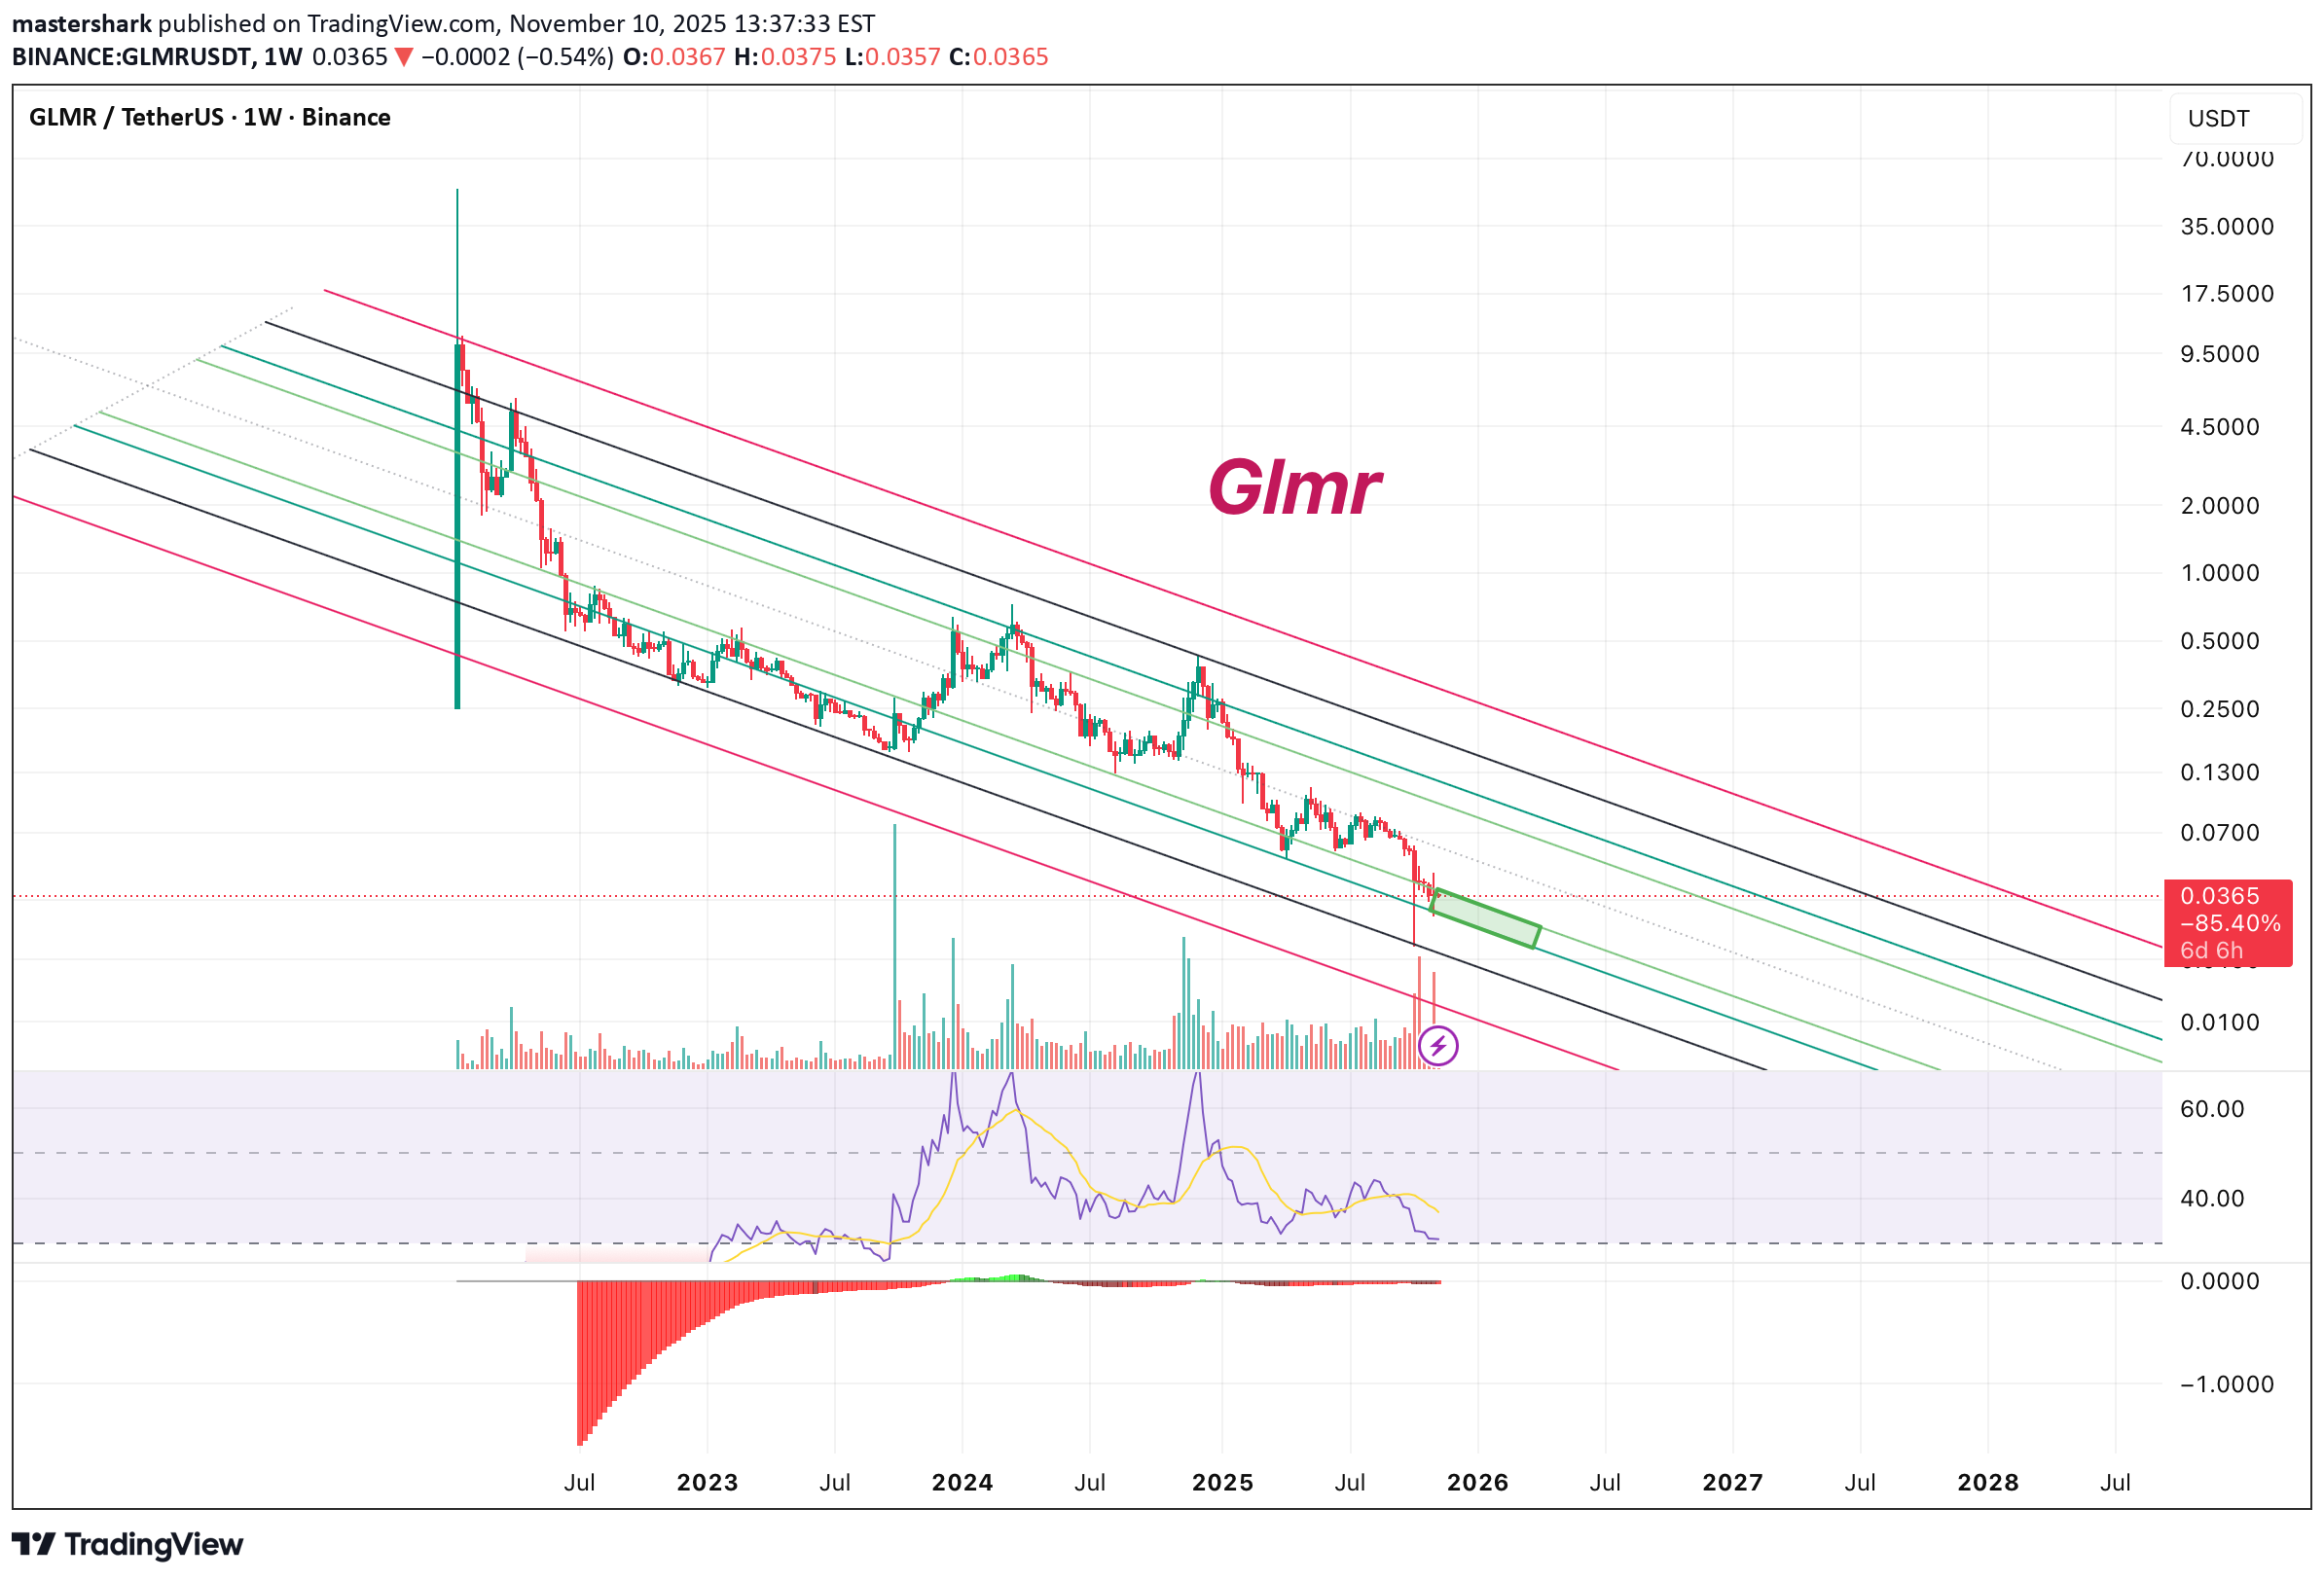
Now I admit Idk what the hell is wrong with some projects, one of them is moonbeam which is headed down without stop ( price wise, don’t know much about the actual work ) it reacts nicely to the pitch fork with some adjustments , I really hope it starts to bounce from this point ngl if it doesn’t it’ll be nasty and worse than what is it now , it has a small market while it’s a pioneer in Polkadot ecosystem which should be the reason for not being delisted yet , with all the background work from Polkadot I won’t be surprised if we see polkadot season and glmr as one of the top gainers , like many other projects it launched in bad timing and holding it should be devastating up till now , I really hope it’s the last dip as I hope it for the whole Alt market.

weslad
افت شدید قیمت GLMR: سطوح حیاتی حمایت و مقاومت برای نجات بازار!
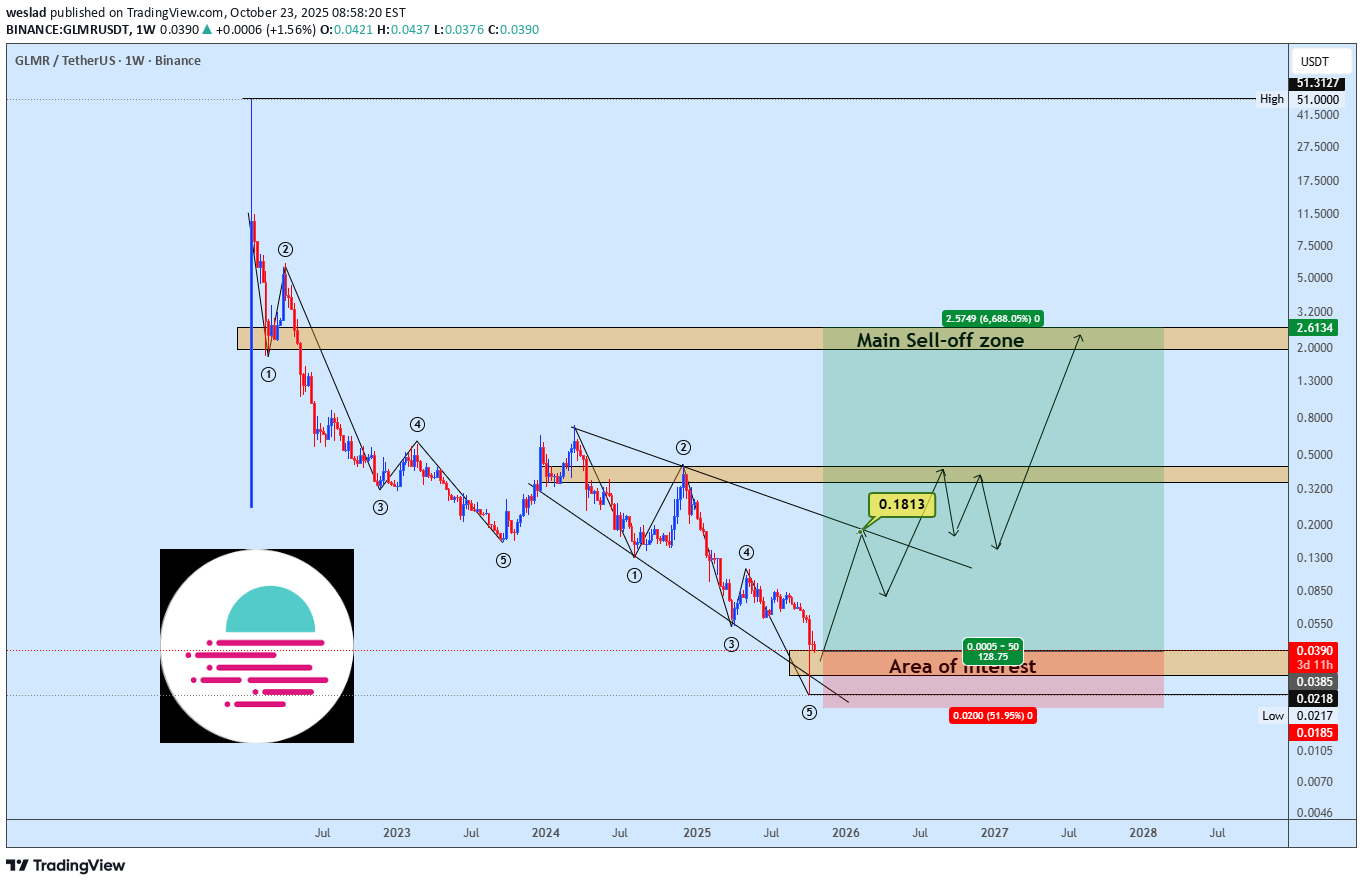
GLMRUSDT remains in a firm macro downtrend. The key Main Sell-off zone ($2-$2.61) is the primary resistance to watch for any short to mid-term rallies. Until that area is broken, the path of least resistance is down. The Area of Interest for a potential long-term bottom lies between $0.0.0219 to $0.039 watch for a confirmed bullish reversal there. A break below $0.0185 signals a continuation of the downtrend.

Zorroreny


MasterAnanda
Moonbeam All-Time Low & Bullish Reversal—Trading 101 (PP: 1250%)

GLMR (Moonbeam) has been trading at bottom prices and you know once we hit bottom, there is no other place left to go but up. The all-time low happened in April 2025 and then we have a reversal pattern. The pattern is composed of lower highs and higher lows, the action converging and becoming compressed until finally a strong breakout happens. We know the breakout will be bullish because of marketwide action. Ethereum (Ether) is trading at its highest price since December 2021. Bitcoin and XRP are trading at all-time highs and many of the strong projects are doing great. As the big projects grow, the smaller projects will follow. It is the natural sequence and how it always works. GLMRUSDT has huge potential for growth as we are looking at true bottom prices. A ~1,250% target can be hit easily in the coming months. Another one around $0.66 gives 777%. There is no need to use a stop-loss with this type of trade setup. Only one action is required here and that is to buy. After you buy, waiting comes naturally as nothing else can be done. When our target is reached; sell, collect profits and move on. Cryptocurrency Trading 101. Namaste.

coin_mastermind
GLMR – Coiling Up for a Move!

📆 On the Daily timeframe, G GLMR is trading inside a symmetrical triangle, with price compressing toward the apex 🔺 This kind of structure often leads to strong breakouts once momentum builds. 👀 Breakout or breakdown ahead? Stay sharp — big move incoming! Not financial advice.

Spark_king
Glmr 15X soon


CryptoAnalystSignal
#GLMR/USDT
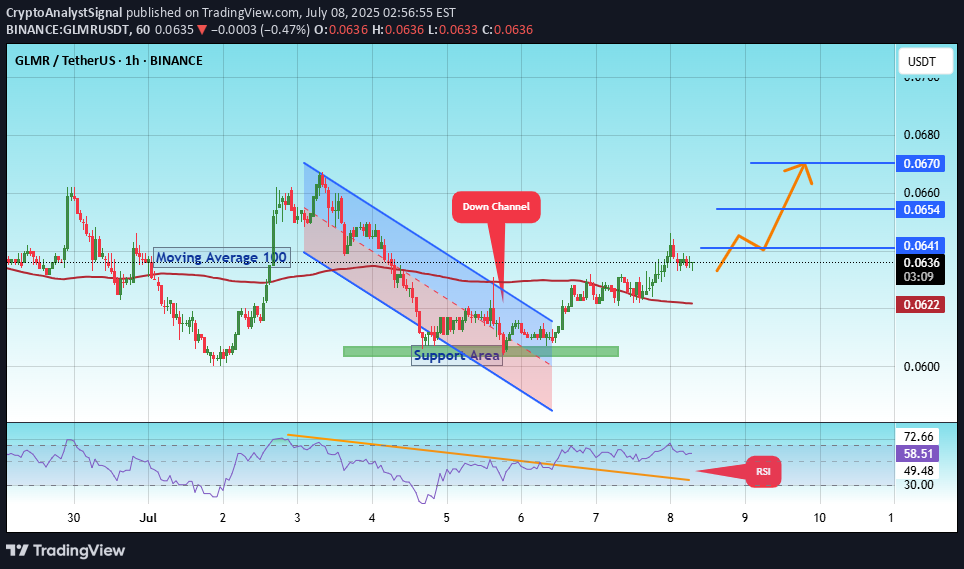
#GLMRThe price is moving within a descending channel on the 1-hour frame, adhering well to it, and is heading for a strong breakout and retest.We have a bounce from the lower boundary of the descending channel. This support is at 0.0593.We have a downtrend on the RSI indicator that is about to be broken and retested, supporting the upside.There is a major support area in green at 0.0600, which represents a strong basis for the upside.Don't forget a simple thing: ease and capital.When you reach the first target, save some money and then change your stop-loss order to an entry order.For inquiries, please leave a comment.We have a trend to hold above the 100 Moving Average.Entry price: 0.0634First target: 0.0641Second target: 0.0654Third target: 0.0670Don't forget a simple thing: ease and capital.When you reach the first target, save some money and then change your stop-loss order to an entry order.For inquiries, please leave a comment.Thank you.
CryptoAnalystSignal
#GLMR/USDT - Buyers Are Here!
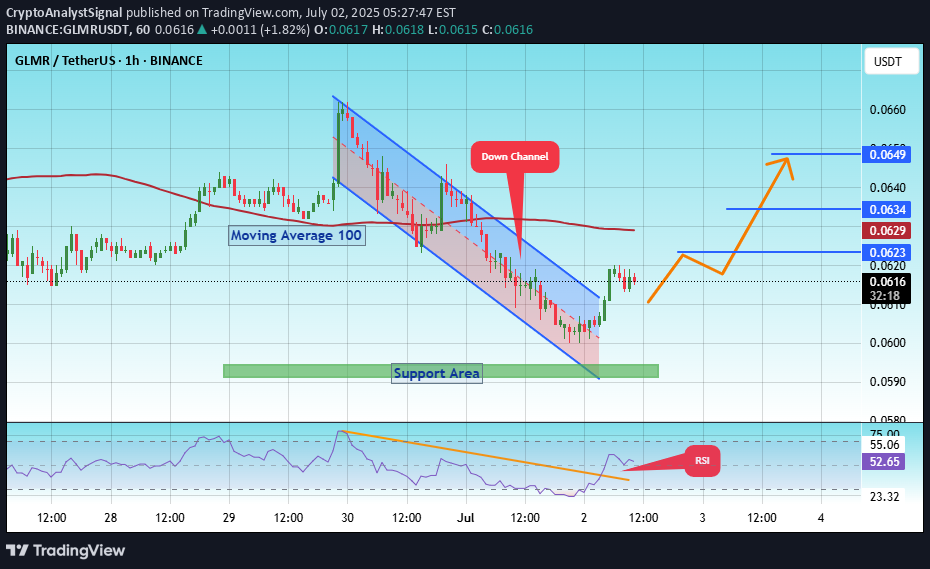
#GLMRThe price is moving within a descending channel on the 1-hour frame, adhering well to it, and is heading for a strong breakout and retest.We have a bounce from the lower boundary of the descending channel, this support at 0.0600.We have a downtrend on the RSI indicator that is about to be broken and retested, supporting the upside.There is a major support area in green at 0.0592, which represents a strong basis for the upside.Don't forget a simple thing: ease and capital.When you reach the first target, save some money and then change your stop-loss order to an entry order.For inquiries, please leave a comment.We have a trend to hold above the 100 Moving Average.Entry price: 0.0615First target: 0.0623Second target: 0.0634Third target: 0.0650Don't forget a simple thing: ease and capital.When you reach your first target, save some money and then change your stop-loss order to an entry order.For inquiries, please leave a comment.Thank you.#GLMRFirst target: 0.0623 ReachedSecond target: 0.0634 ReachedThird target: 0.0650 Reached
Disclaimer
Any content and materials included in Sahmeto's website and official communication channels are a compilation of personal opinions and analyses and are not binding. They do not constitute any recommendation for buying, selling, entering or exiting the stock market and cryptocurrency market. Also, all news and analyses included in the website and channels are merely republished information from official and unofficial domestic and foreign sources, and it is obvious that users of the said content are responsible for following up and ensuring the authenticity and accuracy of the materials. Therefore, while disclaiming responsibility, it is declared that the responsibility for any decision-making, action, and potential profit and loss in the capital market and cryptocurrency market lies with the trader.