
coin_mastermind
@t_coin_mastermind

What symbols does the trader recommend buying?
Purchase History
پیام های تریدر
Filter
coin_mastermind
بیت کوین در نقطه عطف: آیا خط میانی کانال صعودی مقاومت میکند؟

📆 On the Daily timeframe, BTC is pressing against the midline resistance of the ascending channel 🚨. This same level previously triggered a sharp rejection, sending price down toward 109,000. A decisive move here could determine short-term direction — either a clean breakout above or another pullback toward channel support. 👀 Critical test zone to monitor closely! Not financial advice.
coin_mastermind
NEAR – Testing Descending Triangle Support
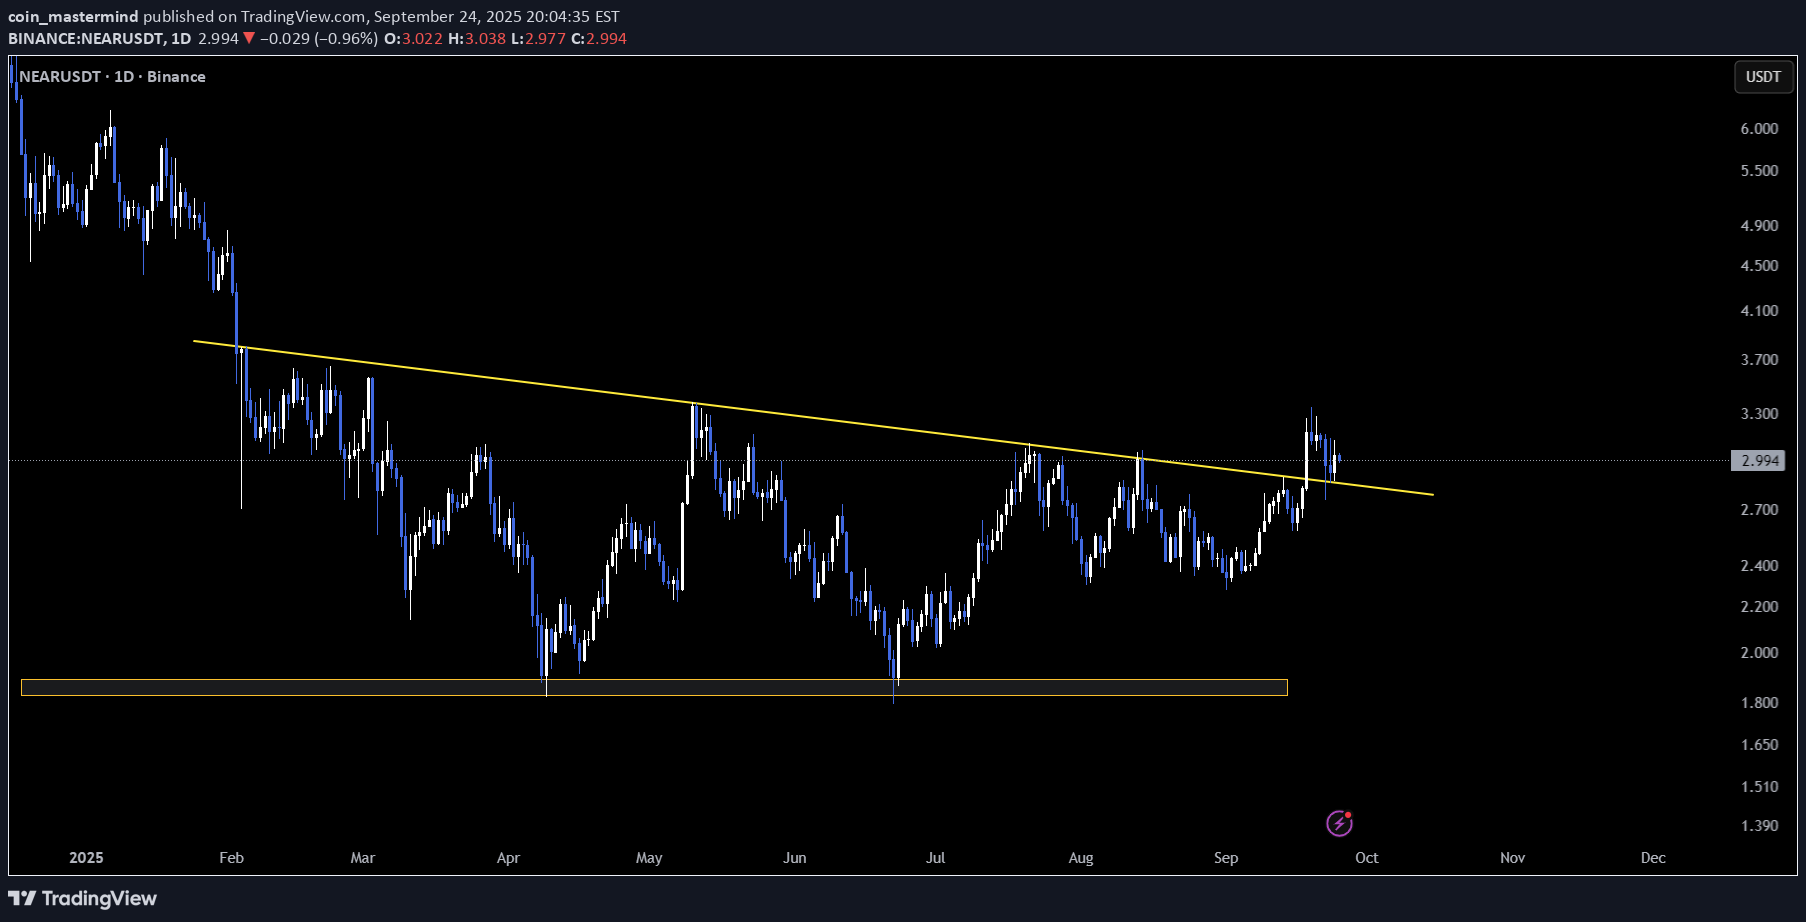
📆 On the Daily timeframe, NEAR is holding the support of the previously broken descending triangle 🛡️ This is a critical zone — if support holds, price could bounce higher, while a breakdown may lead to further downside. Monitoring this level can help anticipate the next directional move. 👀 Keep a close eye on this structure for confirmation. Not financial advice.
coin_mastermind
PUMP – Resting at Descending Triangle Support
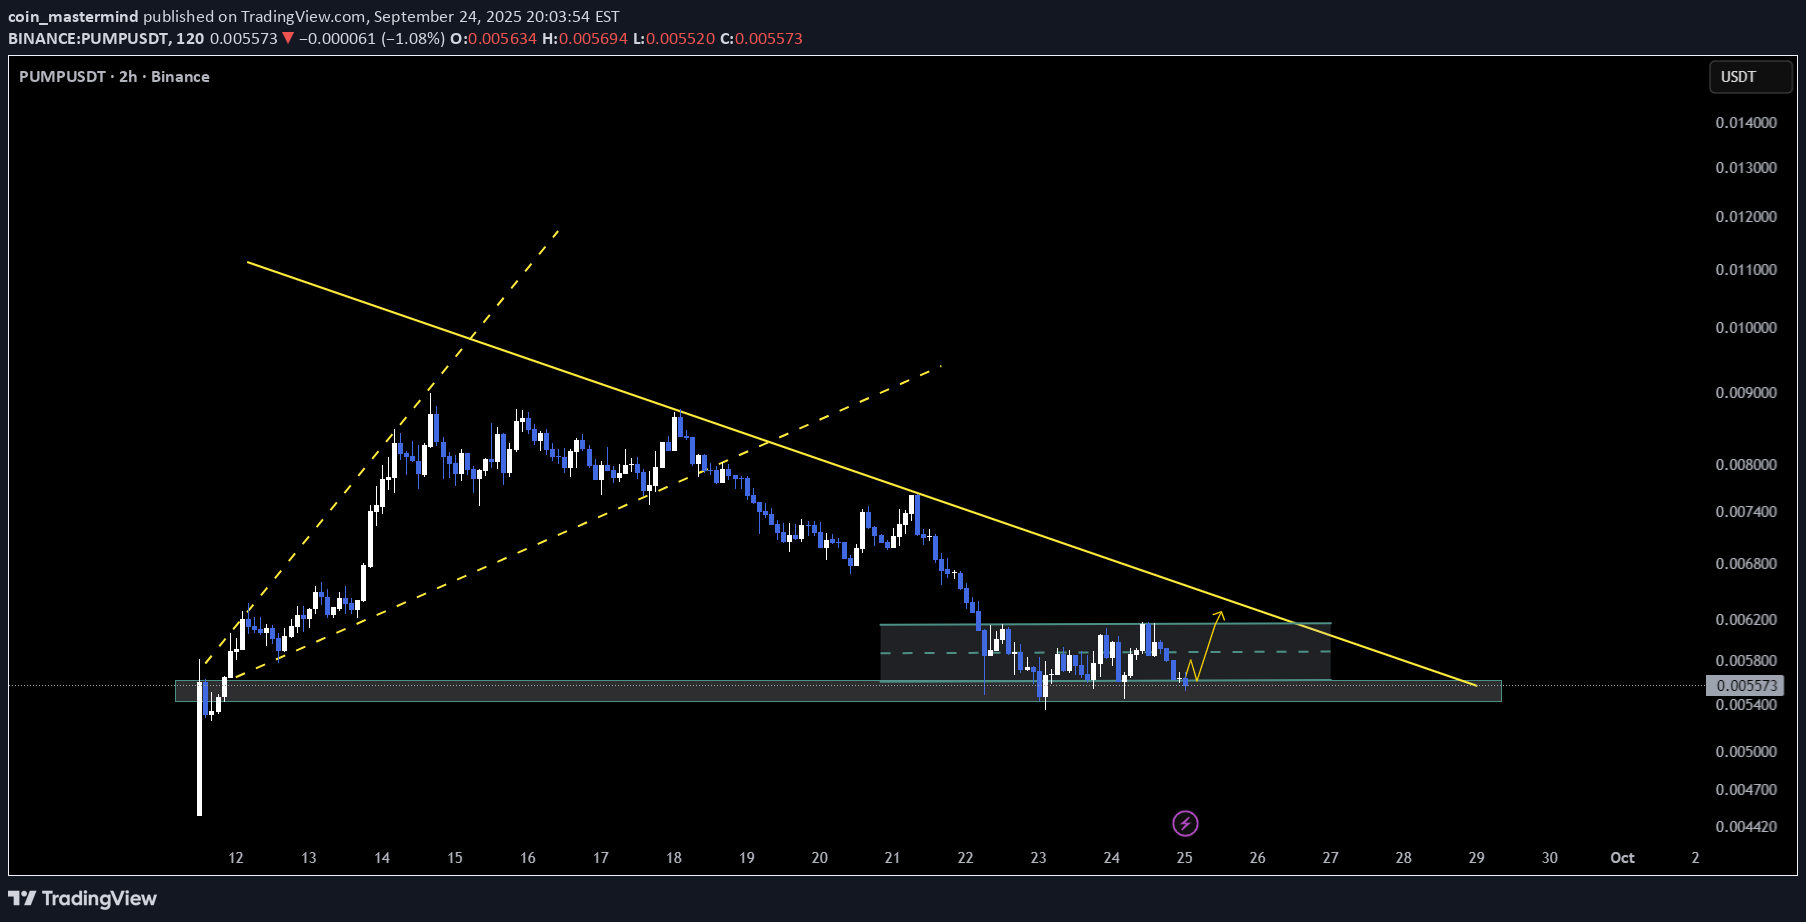
📆 On the 4H timeframe, PUMP is moving inside a descending triangle and currently holding at horizontal support 🛡️ This zone is pivotal — a bounce could trigger a breakout, while a breakdown may lead to further downside. Observing price reaction here will be key to the next move. 👀 Watch this level closely for confirmation. Not financial advice.
coin_mastermind
BONK – Bullish Flag in Play
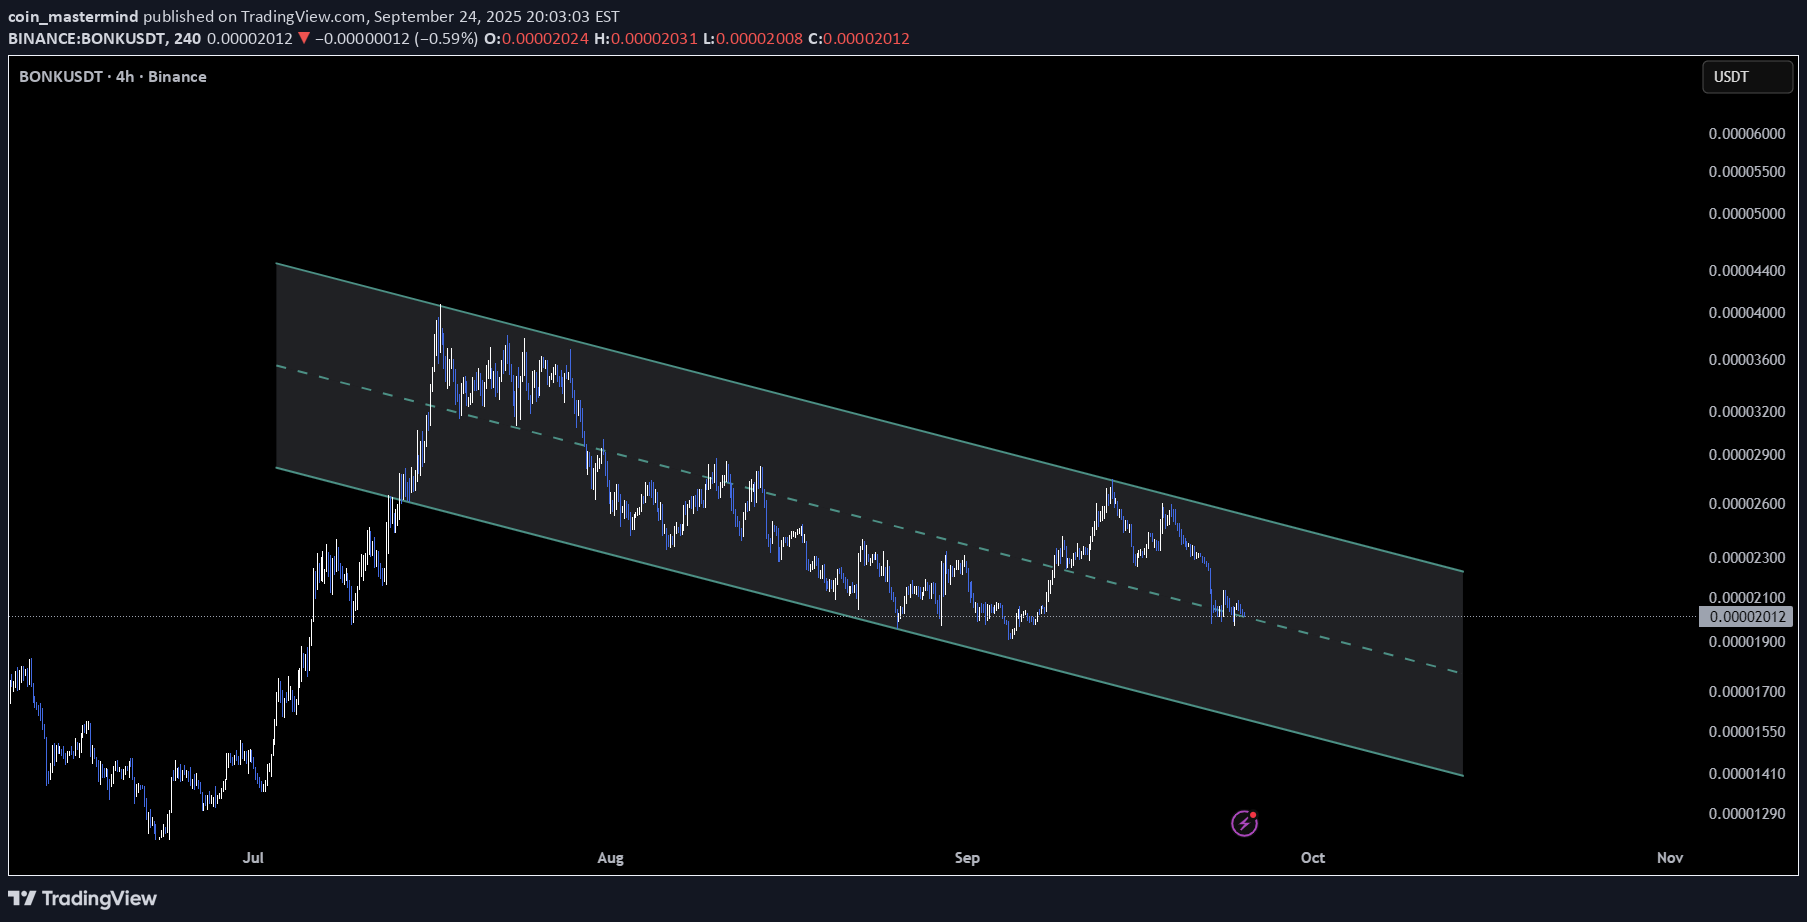
📆 On the Daily timeframe, B BONK is moving inside a bullish flag and currently testing the midline support 🛡️ This level is key — price could either re-test the lower trendline or push toward the upper boundary ⚡. A breakout from the flag would likely signal strong continuation, while a breakdown may stall momentum. 👀 Watch this structure closely for the next move. Not financial advice.
coin_mastermind
BTC – Sharp Reaction at Triangle Support
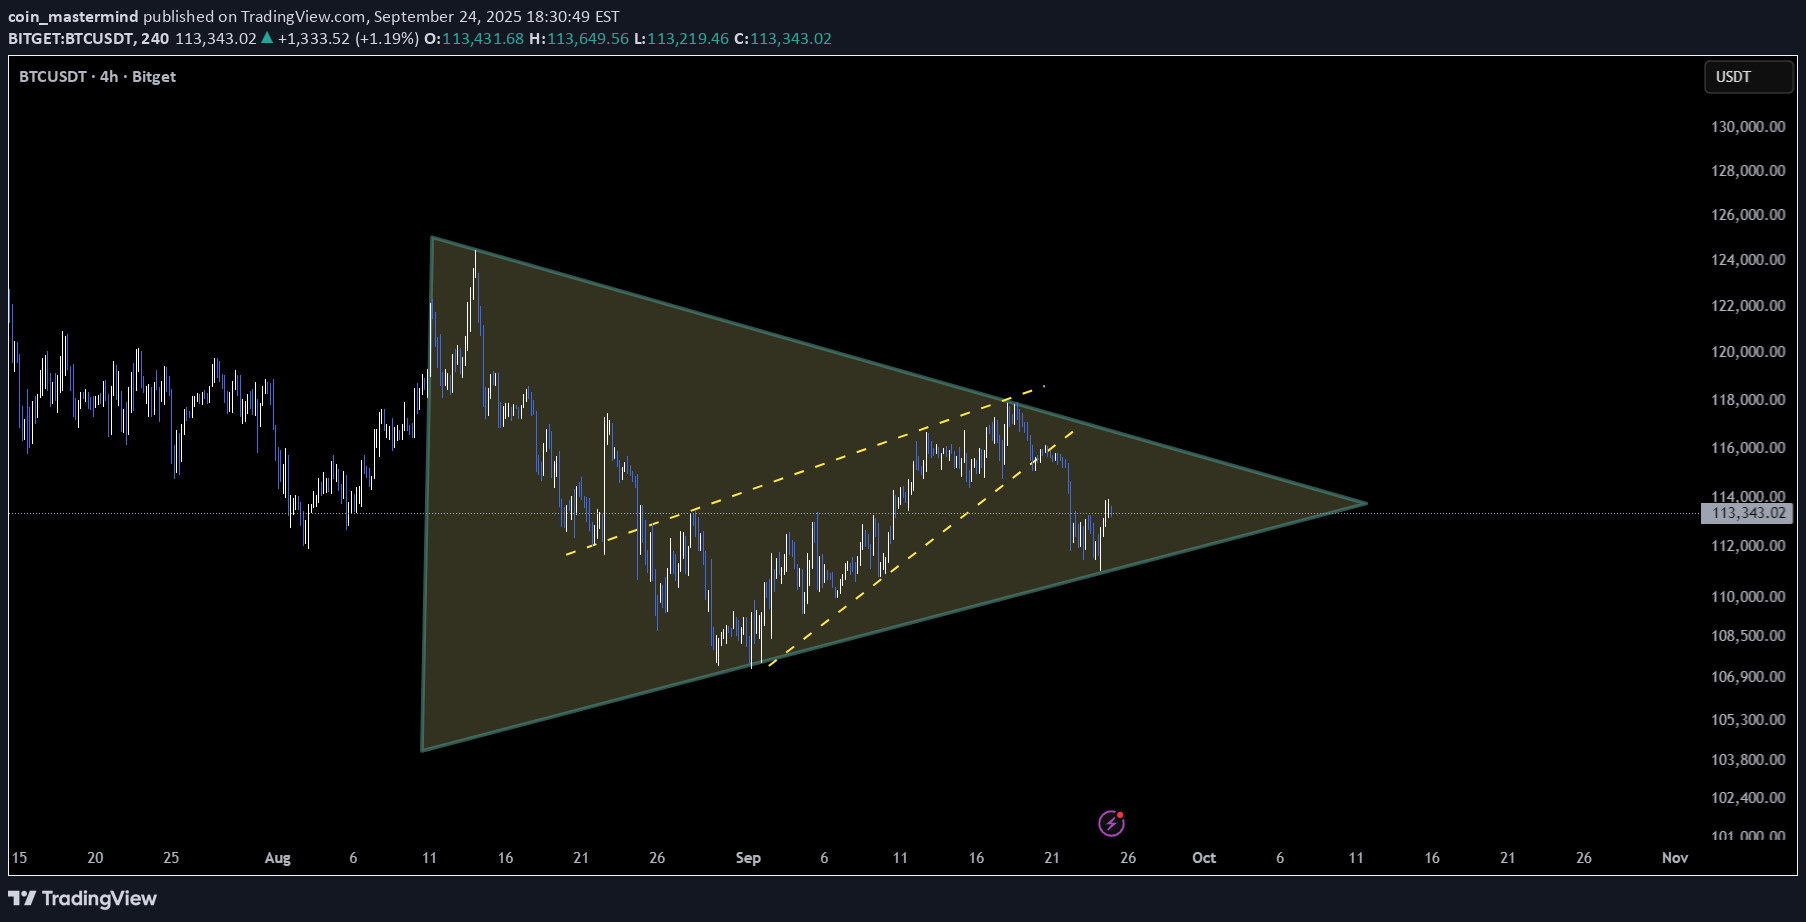
📆 On the 4H timeframe, BTC is holding the support of its symmetrical triangle, resulting in a quick pullback ⚡ This zone is crucial — watch how price behaves at the next resistance. A continuation could extend the bounce, while a rejection may bring it back into the range. 👀 Keep a close eye on this structure for the next move. Not financial advice.
coin_mastermind
FIL – Testing Post-Breakout Support
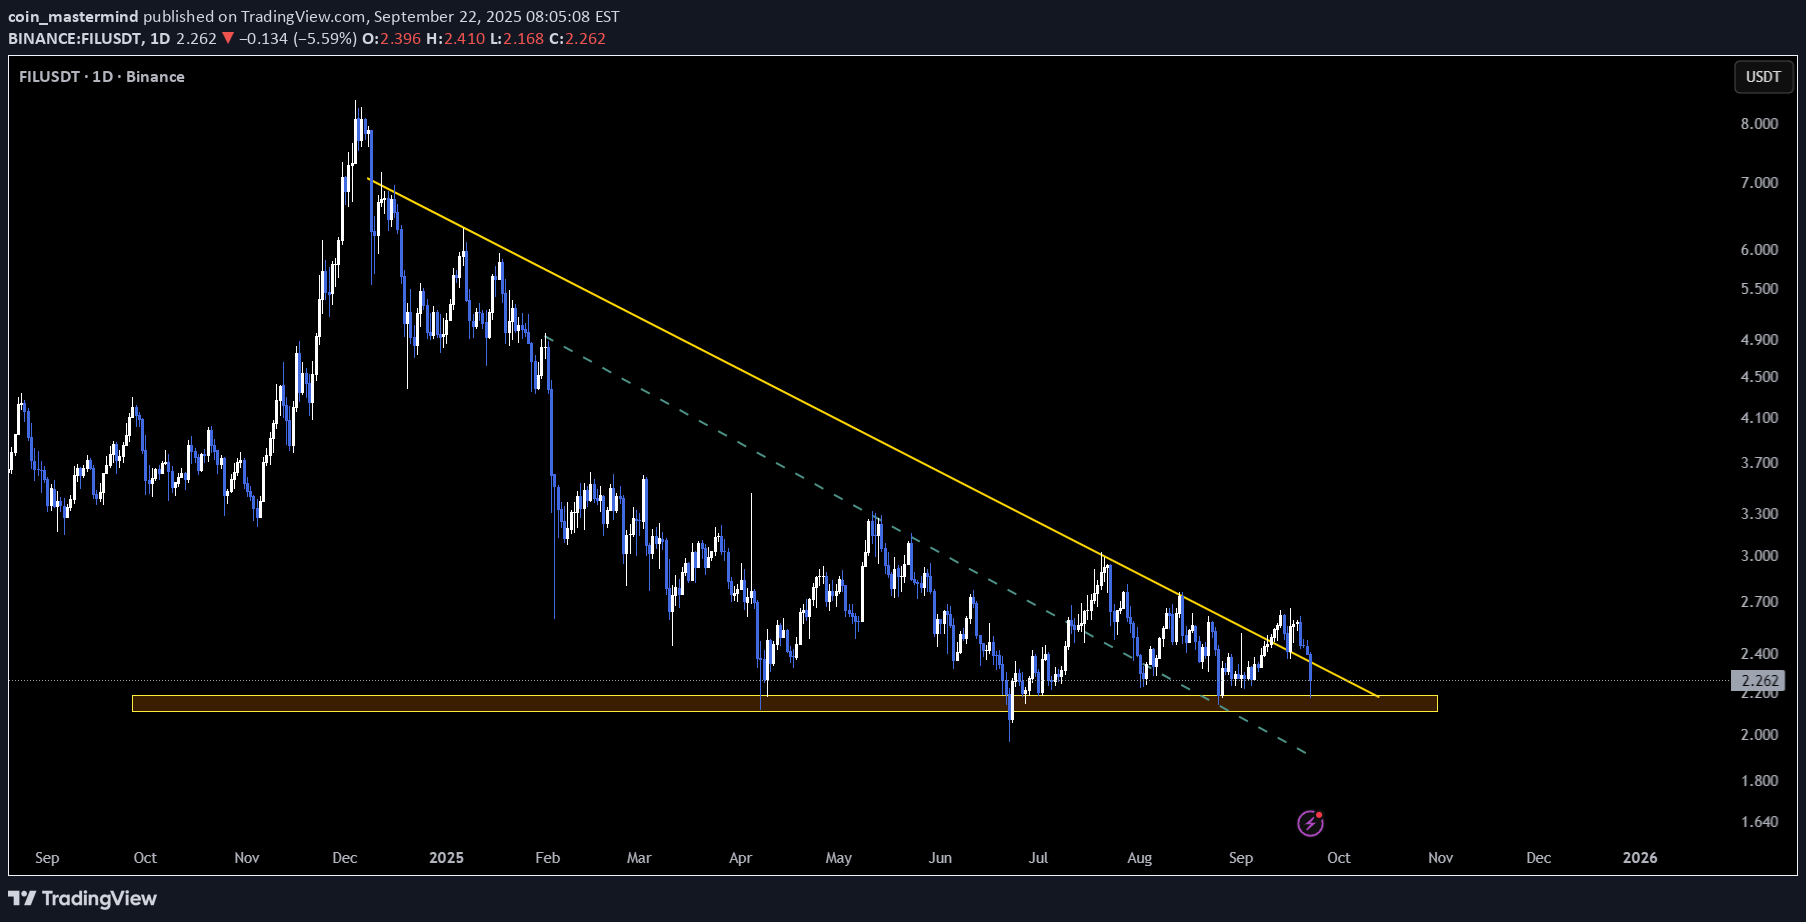
📆 On the 3D timeframe, FIL broke out of a descending triangle but failed to sustain its upward momentum ⚠️. Price is now testing the lower horizontal support 🛡️. This level is critical — holding here could stabilize the structure for another move up, while a break below may signal deeper downside pressure. 👀 Watch this zone closely for confirmation before acting. Not financial advice.
coin_mastermind
ETH – Symmetrical Triangle Compression
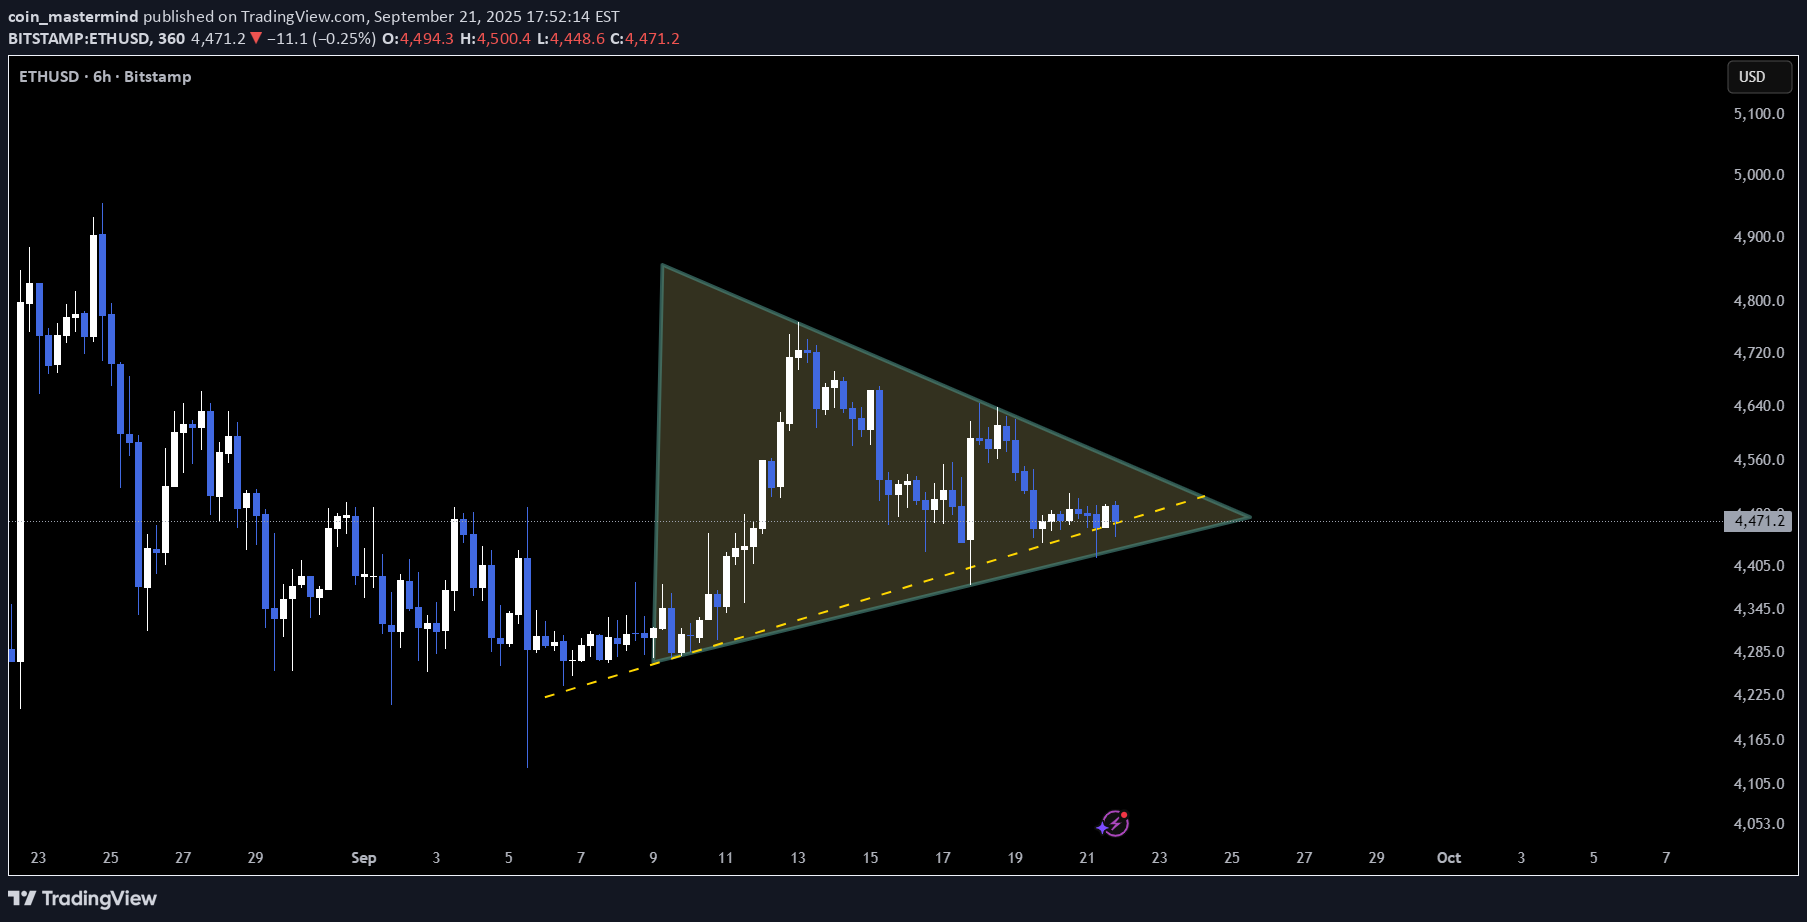
📆 On the 6H timeframe, ETH is consolidating inside a symmetrical triangle 🛡️ This compression phase often precedes a sharp directional move — either a breakout to the upside or a breakdown if support gives way ⚡. Traders typically watch these setups closely as volatility tends to expand after the squeeze. 👀 Keep an eye on this structure — the next move could be significant. Not financial advice.
coin_mastermind
BTC – Ascending Channel in Play
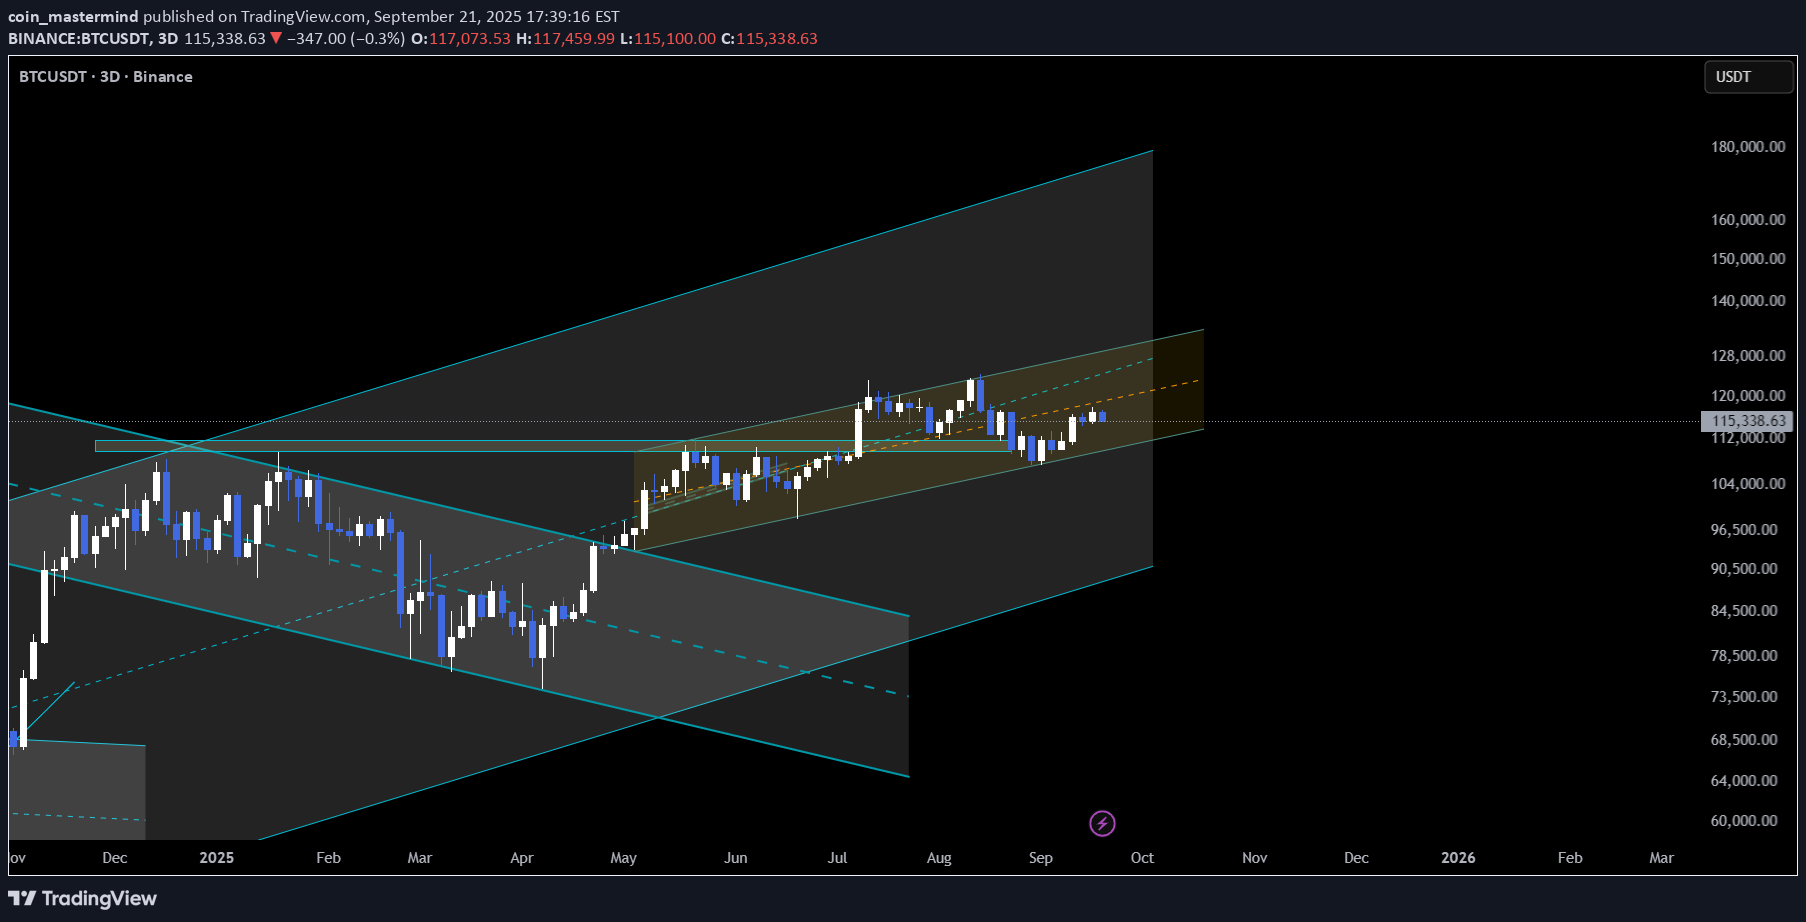
📆 On the Daily timeframe, BTC is moving inside an ascending channel between 109,600 – 117,800 – 125,000+ 📈 Price is currently facing rejection at the midline resistance — a common area where momentum often pauses before either resuming upward or rotating back to support. Holding this zone or breaking through it will likely define the next directional move. 👀 Watch this level closely — confirmation here can set the tone for BTC’s next swing. Not financial advice. BTCUSD
coin_mastermind
TAO – Breaking Out of Descending Resistance
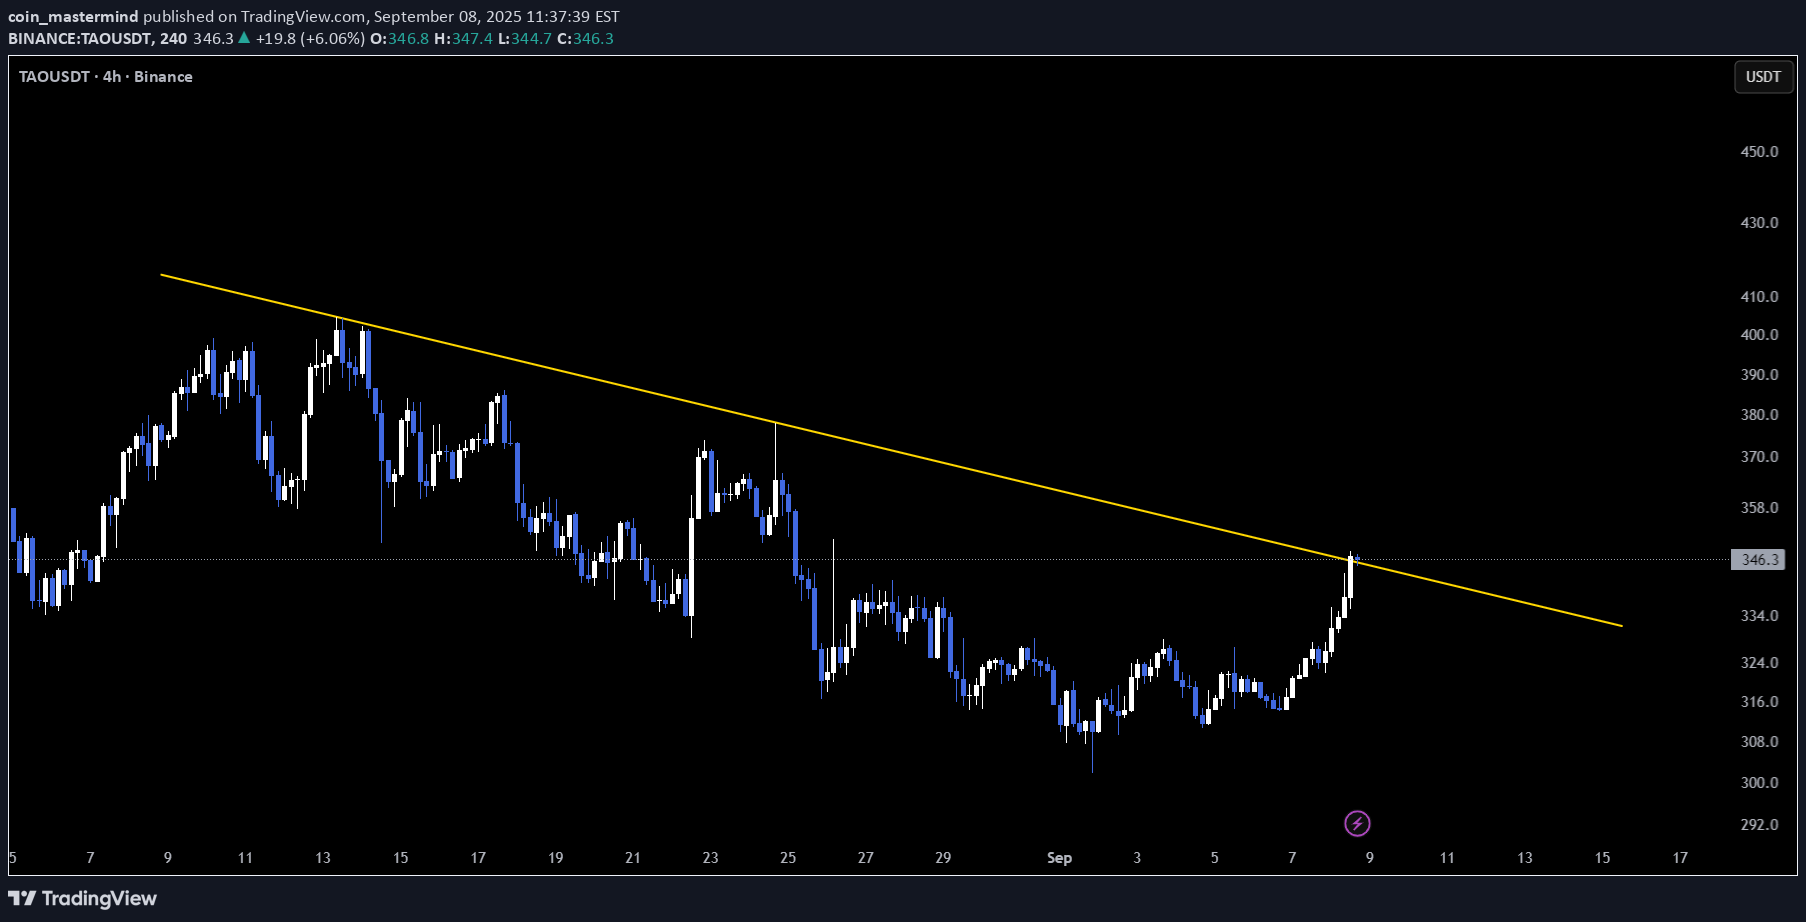
📆 On the 4H timeframe, TAO is breaking through a descending trendline resistance 🔓. This type of breakout often signals a potential shift in trend, especially if price can sustain above the breakout level. From 7 years of trading experience, early confirmation with volume follow-through is usually the key to validating momentum. A clean hold here could invite stronger bullish flows ⚡, while a rejection would trap late buyers. 👀 Critical spot — watch for confirmation before calling the next leg. Not financial advice.
coin_mastermind
TIA – Falling Wedge Compression Near Apex
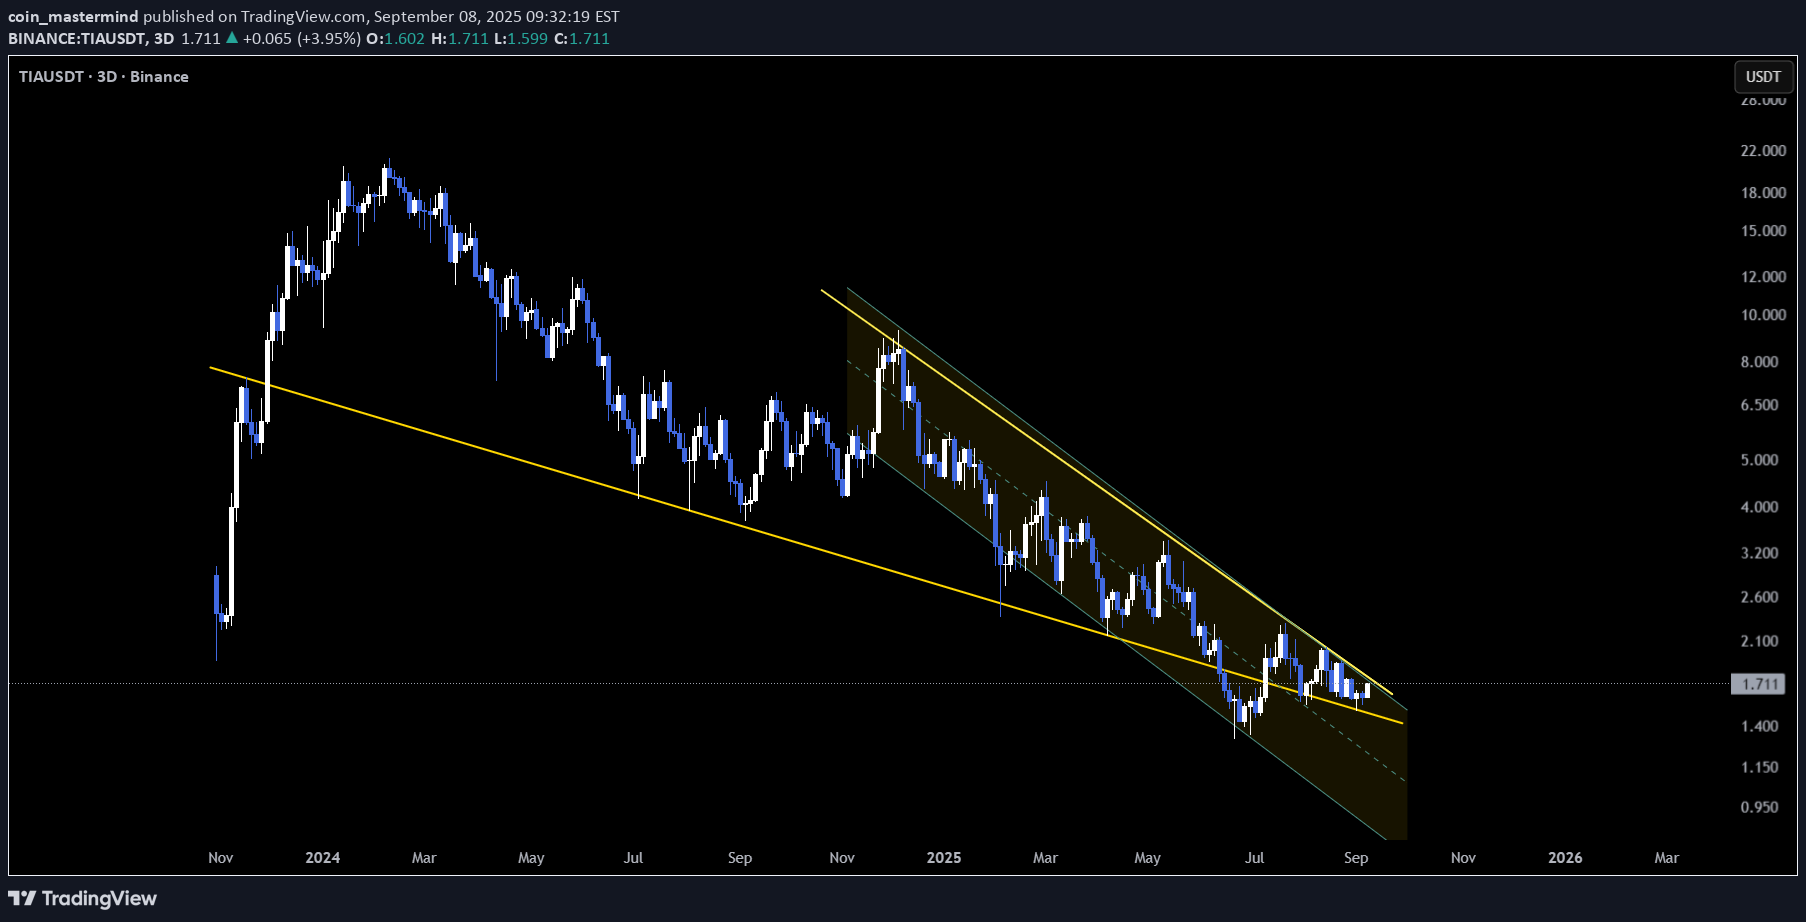
📆 On the 3D timeframe, TIA is consolidating inside a falling wedge, with price action now pressing closer to the apex 📐. This type of structure usually signals exhaustion of selling pressure. From my trading experience, wedges often resolve with strong directional moves once price tightens — either a breakout to the upside or one more dip into support before momentum shifts. 👀 Structure is reaching decision point — breakout or another retest? Not financial advice. TIAUSDT TIAUSDT.P
Disclaimer
Any content and materials included in Sahmeto's website and official communication channels are a compilation of personal opinions and analyses and are not binding. They do not constitute any recommendation for buying, selling, entering or exiting the stock market and cryptocurrency market. Also, all news and analyses included in the website and channels are merely republished information from official and unofficial domestic and foreign sources, and it is obvious that users of the said content are responsible for following up and ensuring the authenticity and accuracy of the materials. Therefore, while disclaiming responsibility, it is declared that the responsibility for any decision-making, action, and potential profit and loss in the capital market and cryptocurrency market lies with the trader.