
ETH
Ethereum
| تریدر | نوع سیگنال | حد سود/ضرر | زمان انتشار | مشاهده پیام |
|---|---|---|---|---|
خرید | حد سود: ۳٬۴۰۰ حد ضرر: تعیین نشده | 12/11/2025 | ||
خرید | حد سود: ۳٬۵۰۰ حد ضرر: تعیین نشده | 12/11/2025 | ||
خرید | حد سود: ۳٬۶۰۰ حد ضرر: تعیین نشده | 12/11/2025 | ||
خرید | حد سود: ۳٬۶۸۰ حد ضرر: تعیین نشده | 12/11/2025 | ||
خرید | حد سود: ۳٬۸۰۰ حد ضرر: تعیین نشده | 12/10/2025 |


Price Chart of Ethereum
سود 3 Months :
خلاصه سیگنالهای Ethereum
سیگنالهای Ethereum
Filter
Sort messages by
Trader Type
Time Frame
ETH/USD – Bearish Shift After Distribution
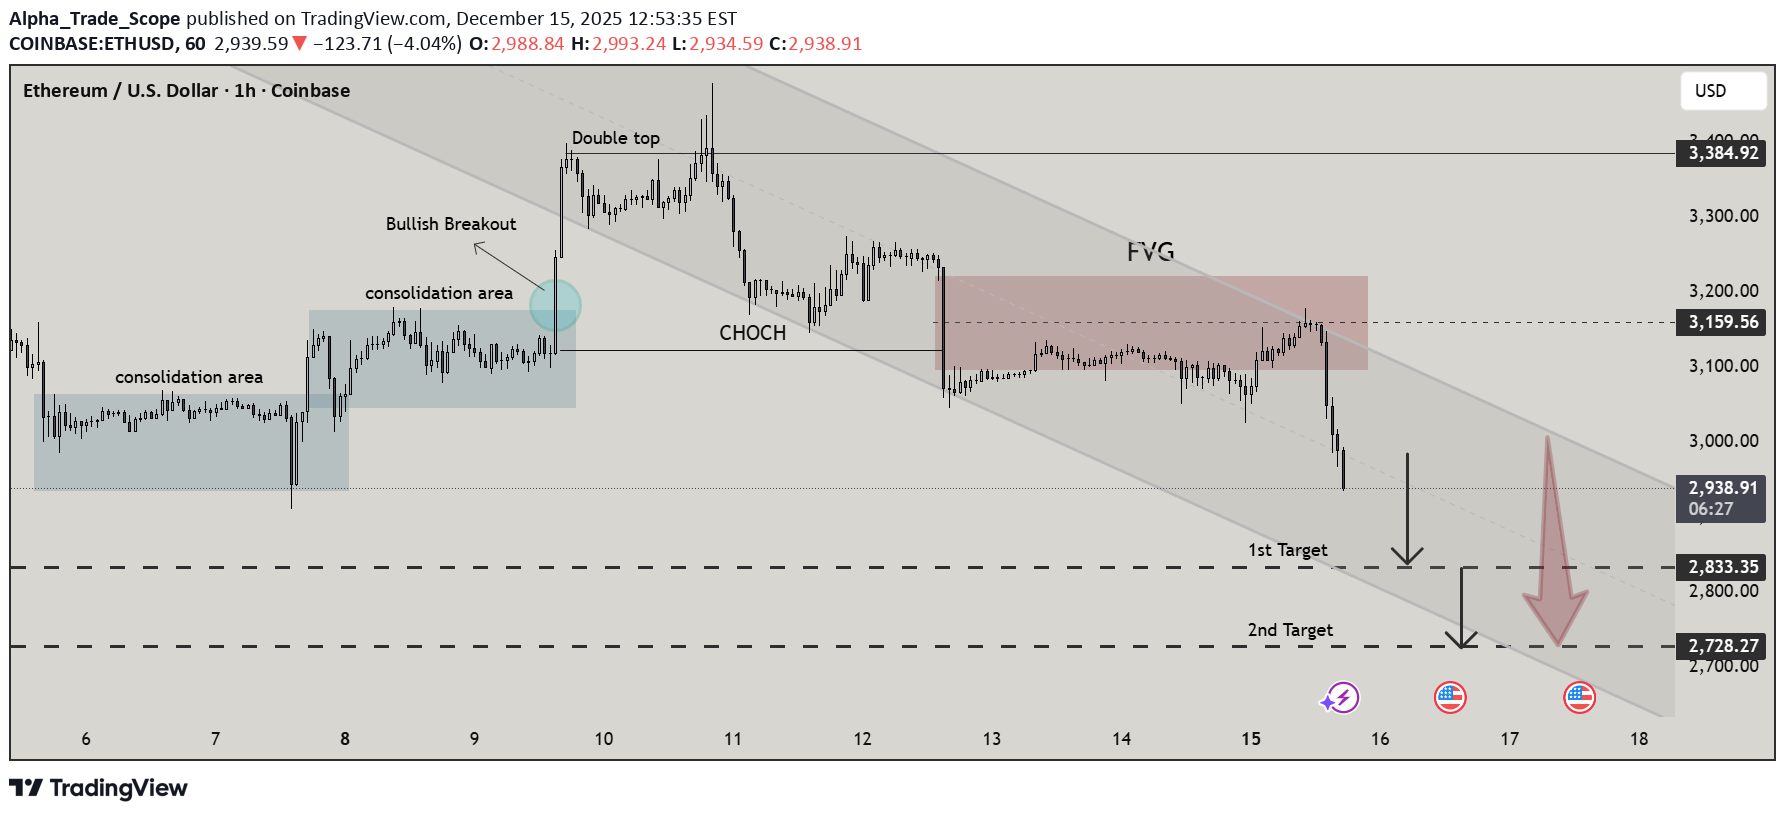
This 1H ETH/USD chart highlights a clear transition from consolidation to distribution and then into a bearish trend. Price first ranged in tight consolidation zones before a bullish breakout that ultimately failed, forming a double top near the highs. A confirmed CHoCH (Change of Character) signaled bearish control, followed by rejection from a Fair Value Gap (FVG) within a descending channel. With downside momentum increasing, price is now targeting lower liquidity levels, with $2,833 as the first target and $2,728 as the second. Overall structure favors continuation to the downside unless price reclaims the channel and invalidates the bearish bias.

ROY_TRADER_007
ETHUSD TRADE SATUP READ CAPTION
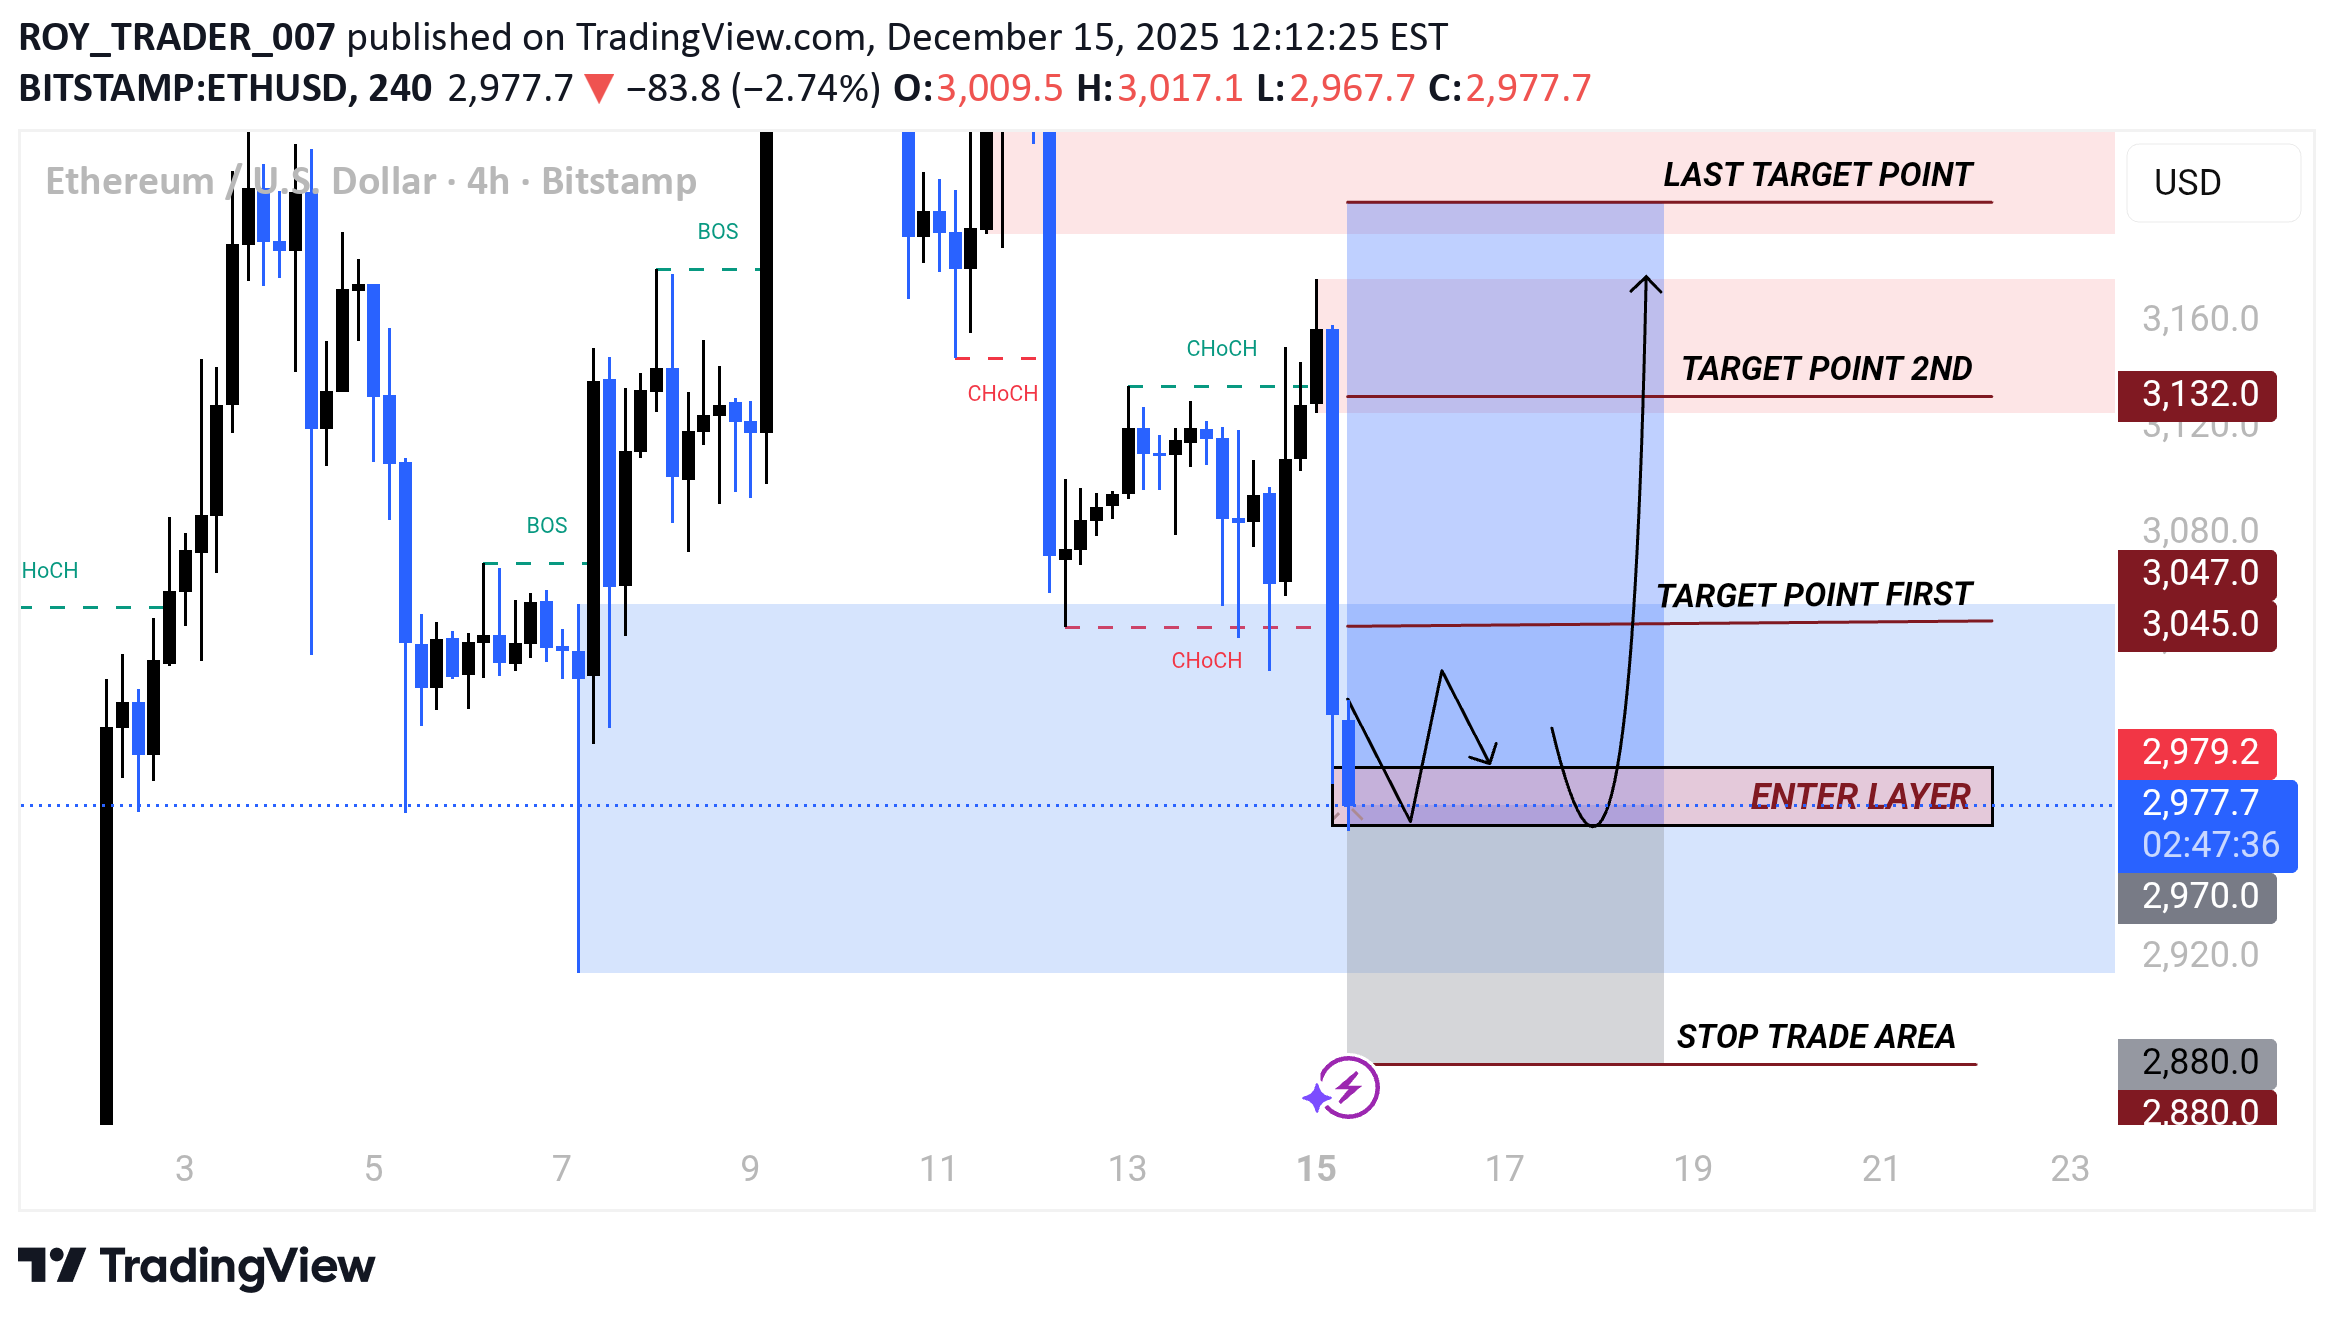
Enter Layer (Buy Zone) The purple “ENTER LAYER” box (~2990 area) is the optimal entry zone. The black arrows show: Small consolidation / fake moves Then strong bullish expansion upward Stop Trade Area (Risk Control) The gray zone below (~2880) is the stop-loss area. If price reaches here: Structure is invalidated Bullish idea is wrong Target Point First (~3045–3047) Conservative target Previous resistance Partial profit recommended 🎯 Target Point 2nd (~3132) Stronger resistance zone High-probability reaction area 🎯 Last Target Point (~3160+) Final bullish expansion target Where smart money likely distributesTrade active now 2978
ETHUSD Potential Long After Liquidity Sweep (1H)
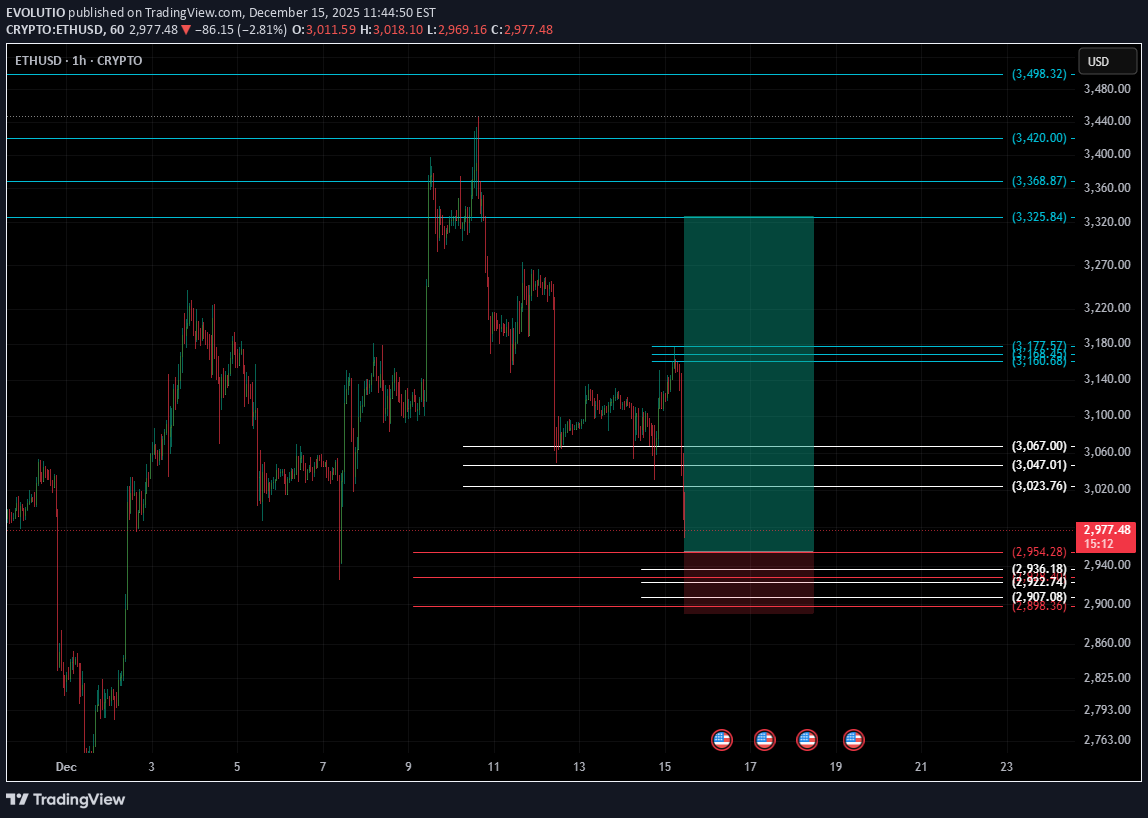
ETH swept sell-side liquidity and showed a strong reaction from demand. Price is currently setting up for a potential bullish continuation if structure holds. 🔹 Entry: 2,954.74 🔹 Stop Loss: 2,891.06 🔹 Take Profit: 3,327.00 📊 Risk / Reward: ~1:5.85 📈 Target Move: +12.59% 📌 Confluences: Sell-side liquidity sweep Strong displacement from demand Clear invalidation level Clean RR profile ⚠️ Setup invalidated if price closes below 2,891.06. 🤡 Disclaimer: Not financial advice. I’m just a random person on the internet drawing colorful boxes on a chart. Trade at your own risk.
#ETHUSDT 4H Chart
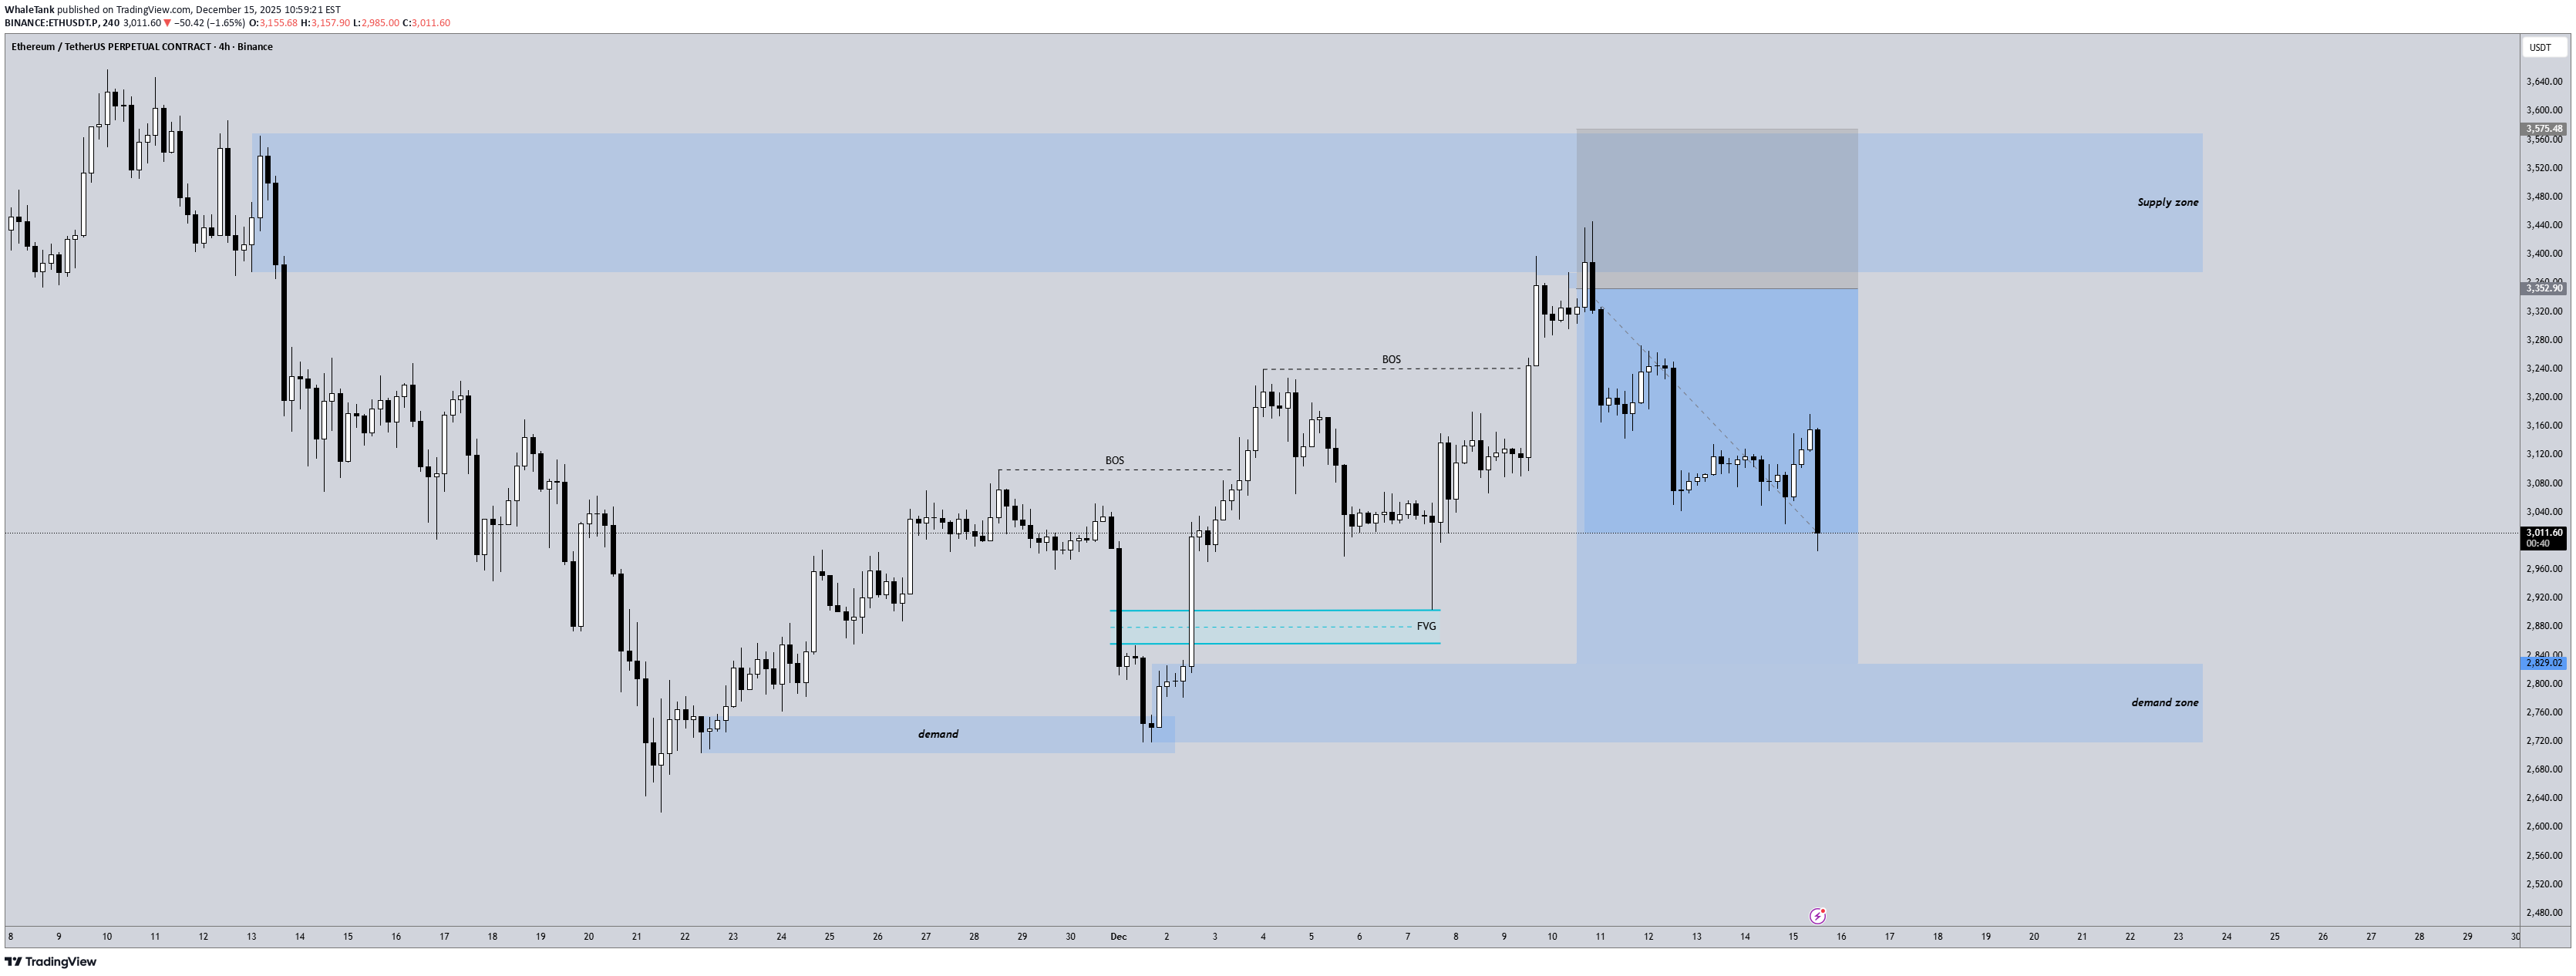
Amazing trade caught on #ETH. Price is still ranging in our favored direction however i decided to secure all the profits now as we might see lower liquidity going onto year-end.

invertirenpatrimonio
ETH/USD
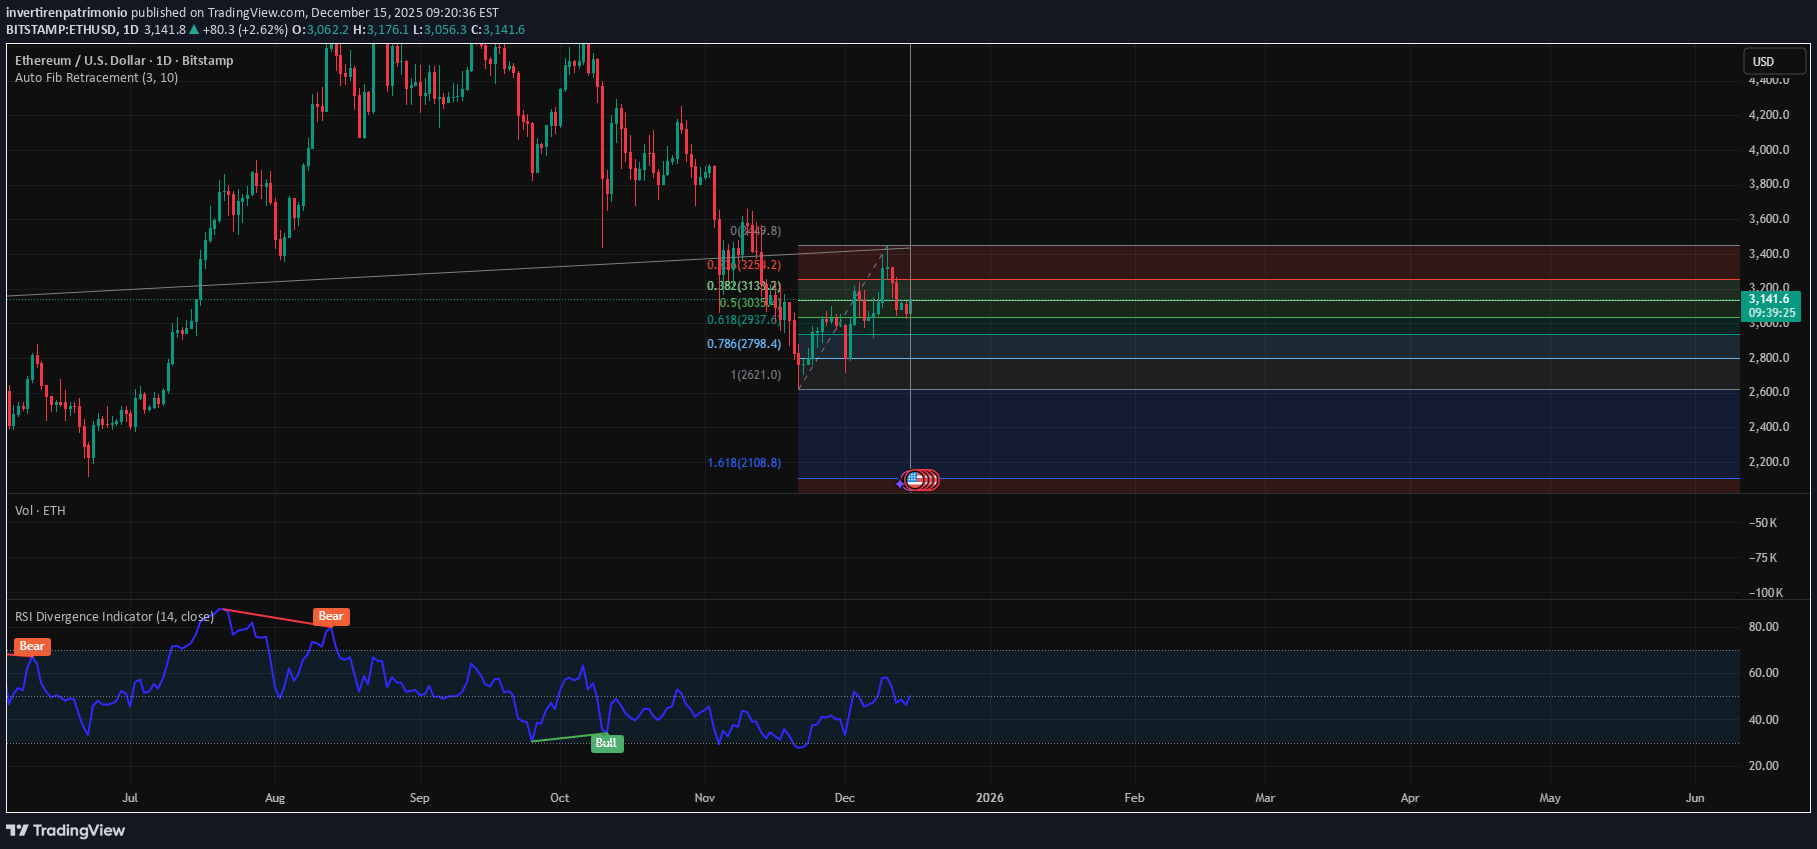
ETH/USD Technical Analysis: The price is currently in a key area after a pullback from previous highs. Using Fibonacci shows important support and resistance levels, with possible consolidation around 0.382 and 0.5. The RSI indicates recovery after the previous divergence, which could anticipate a bullish move if it stays above the green zone. Monitoring range breakout to confirm trend.

CryptoCheckGroup
ETH -20% Drop Coming!
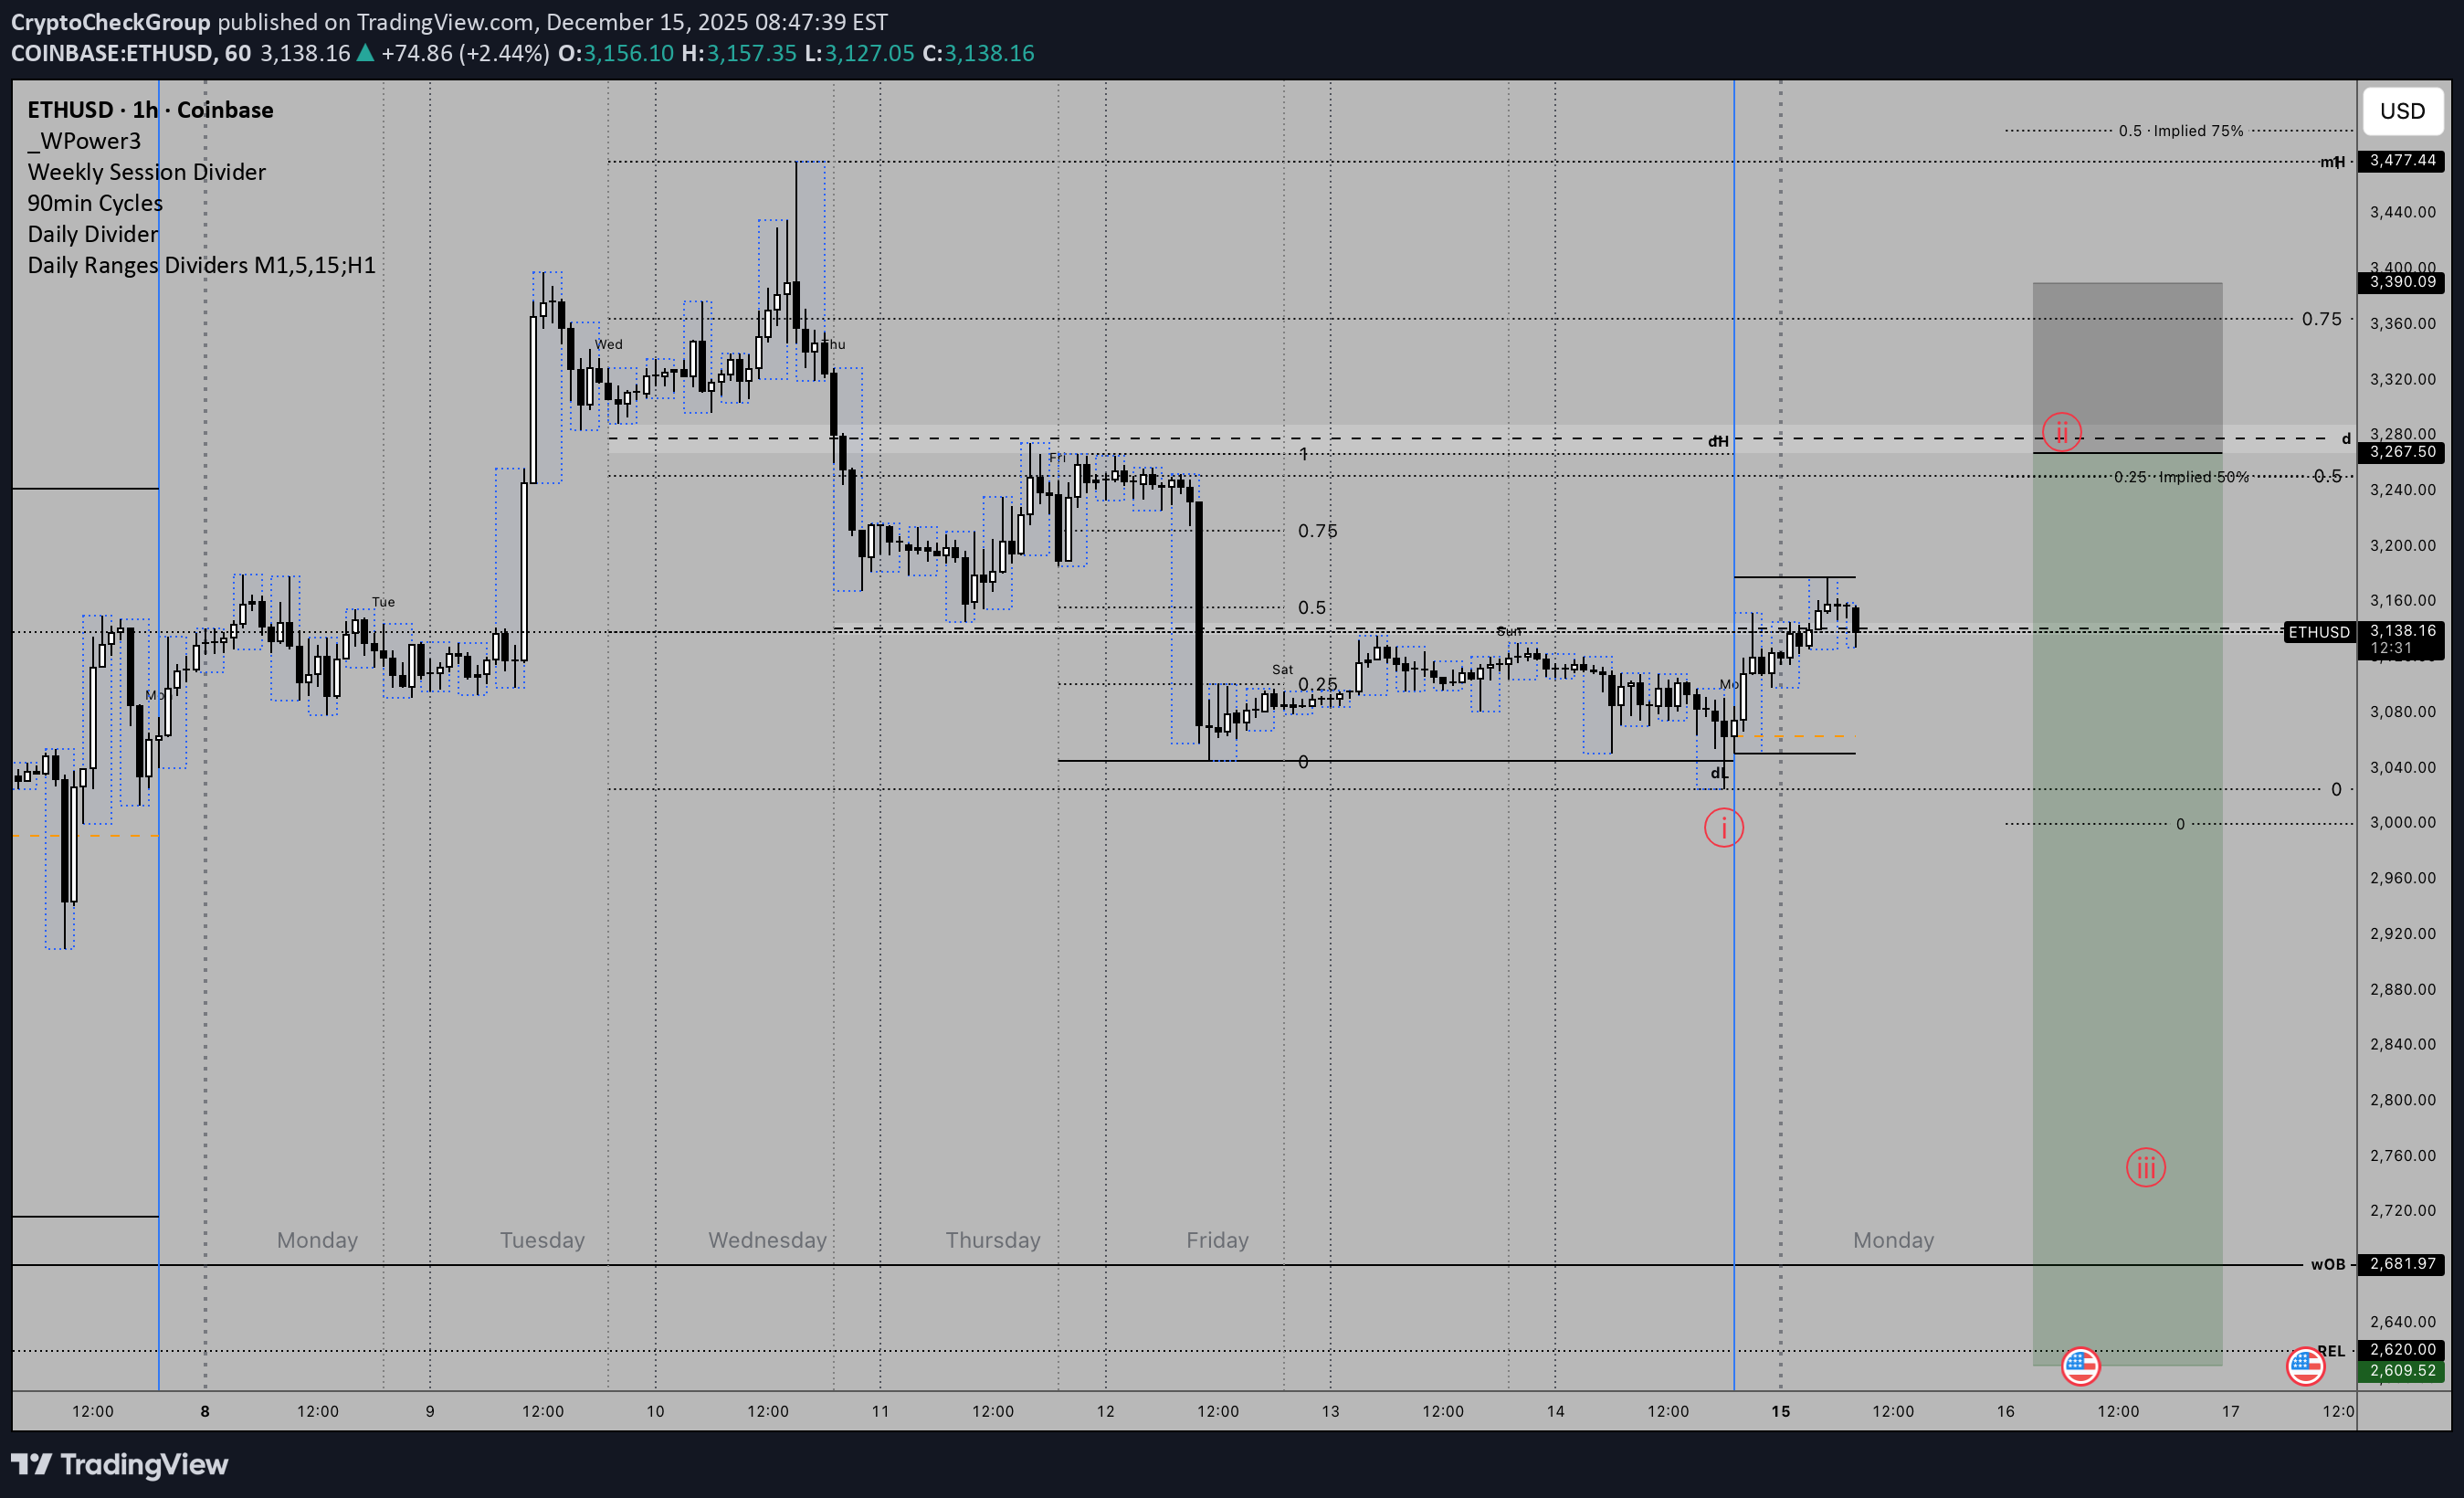
ETHUSD - ETH finished its Re-accumulation phase in a form of Wave 4 the past week. - We are now, most likely, in the last phase of the first bearish sequence down- Wave 5. - Over night Asia finished the first part of the last move down. - We're now seeing retrace(Wave 2), what follows that is Wave 3, what means we should see the best shorting opportunity of December at some point this week.This drop was not anticipated. I may need to look for short opportunities in this current swing...As new data unfolds, I have to consider another potential possibility... and that is, that ETH is ending its 1st Wave down now. With Wave 2 to still come.

mrsignalll
ETH Short Setup
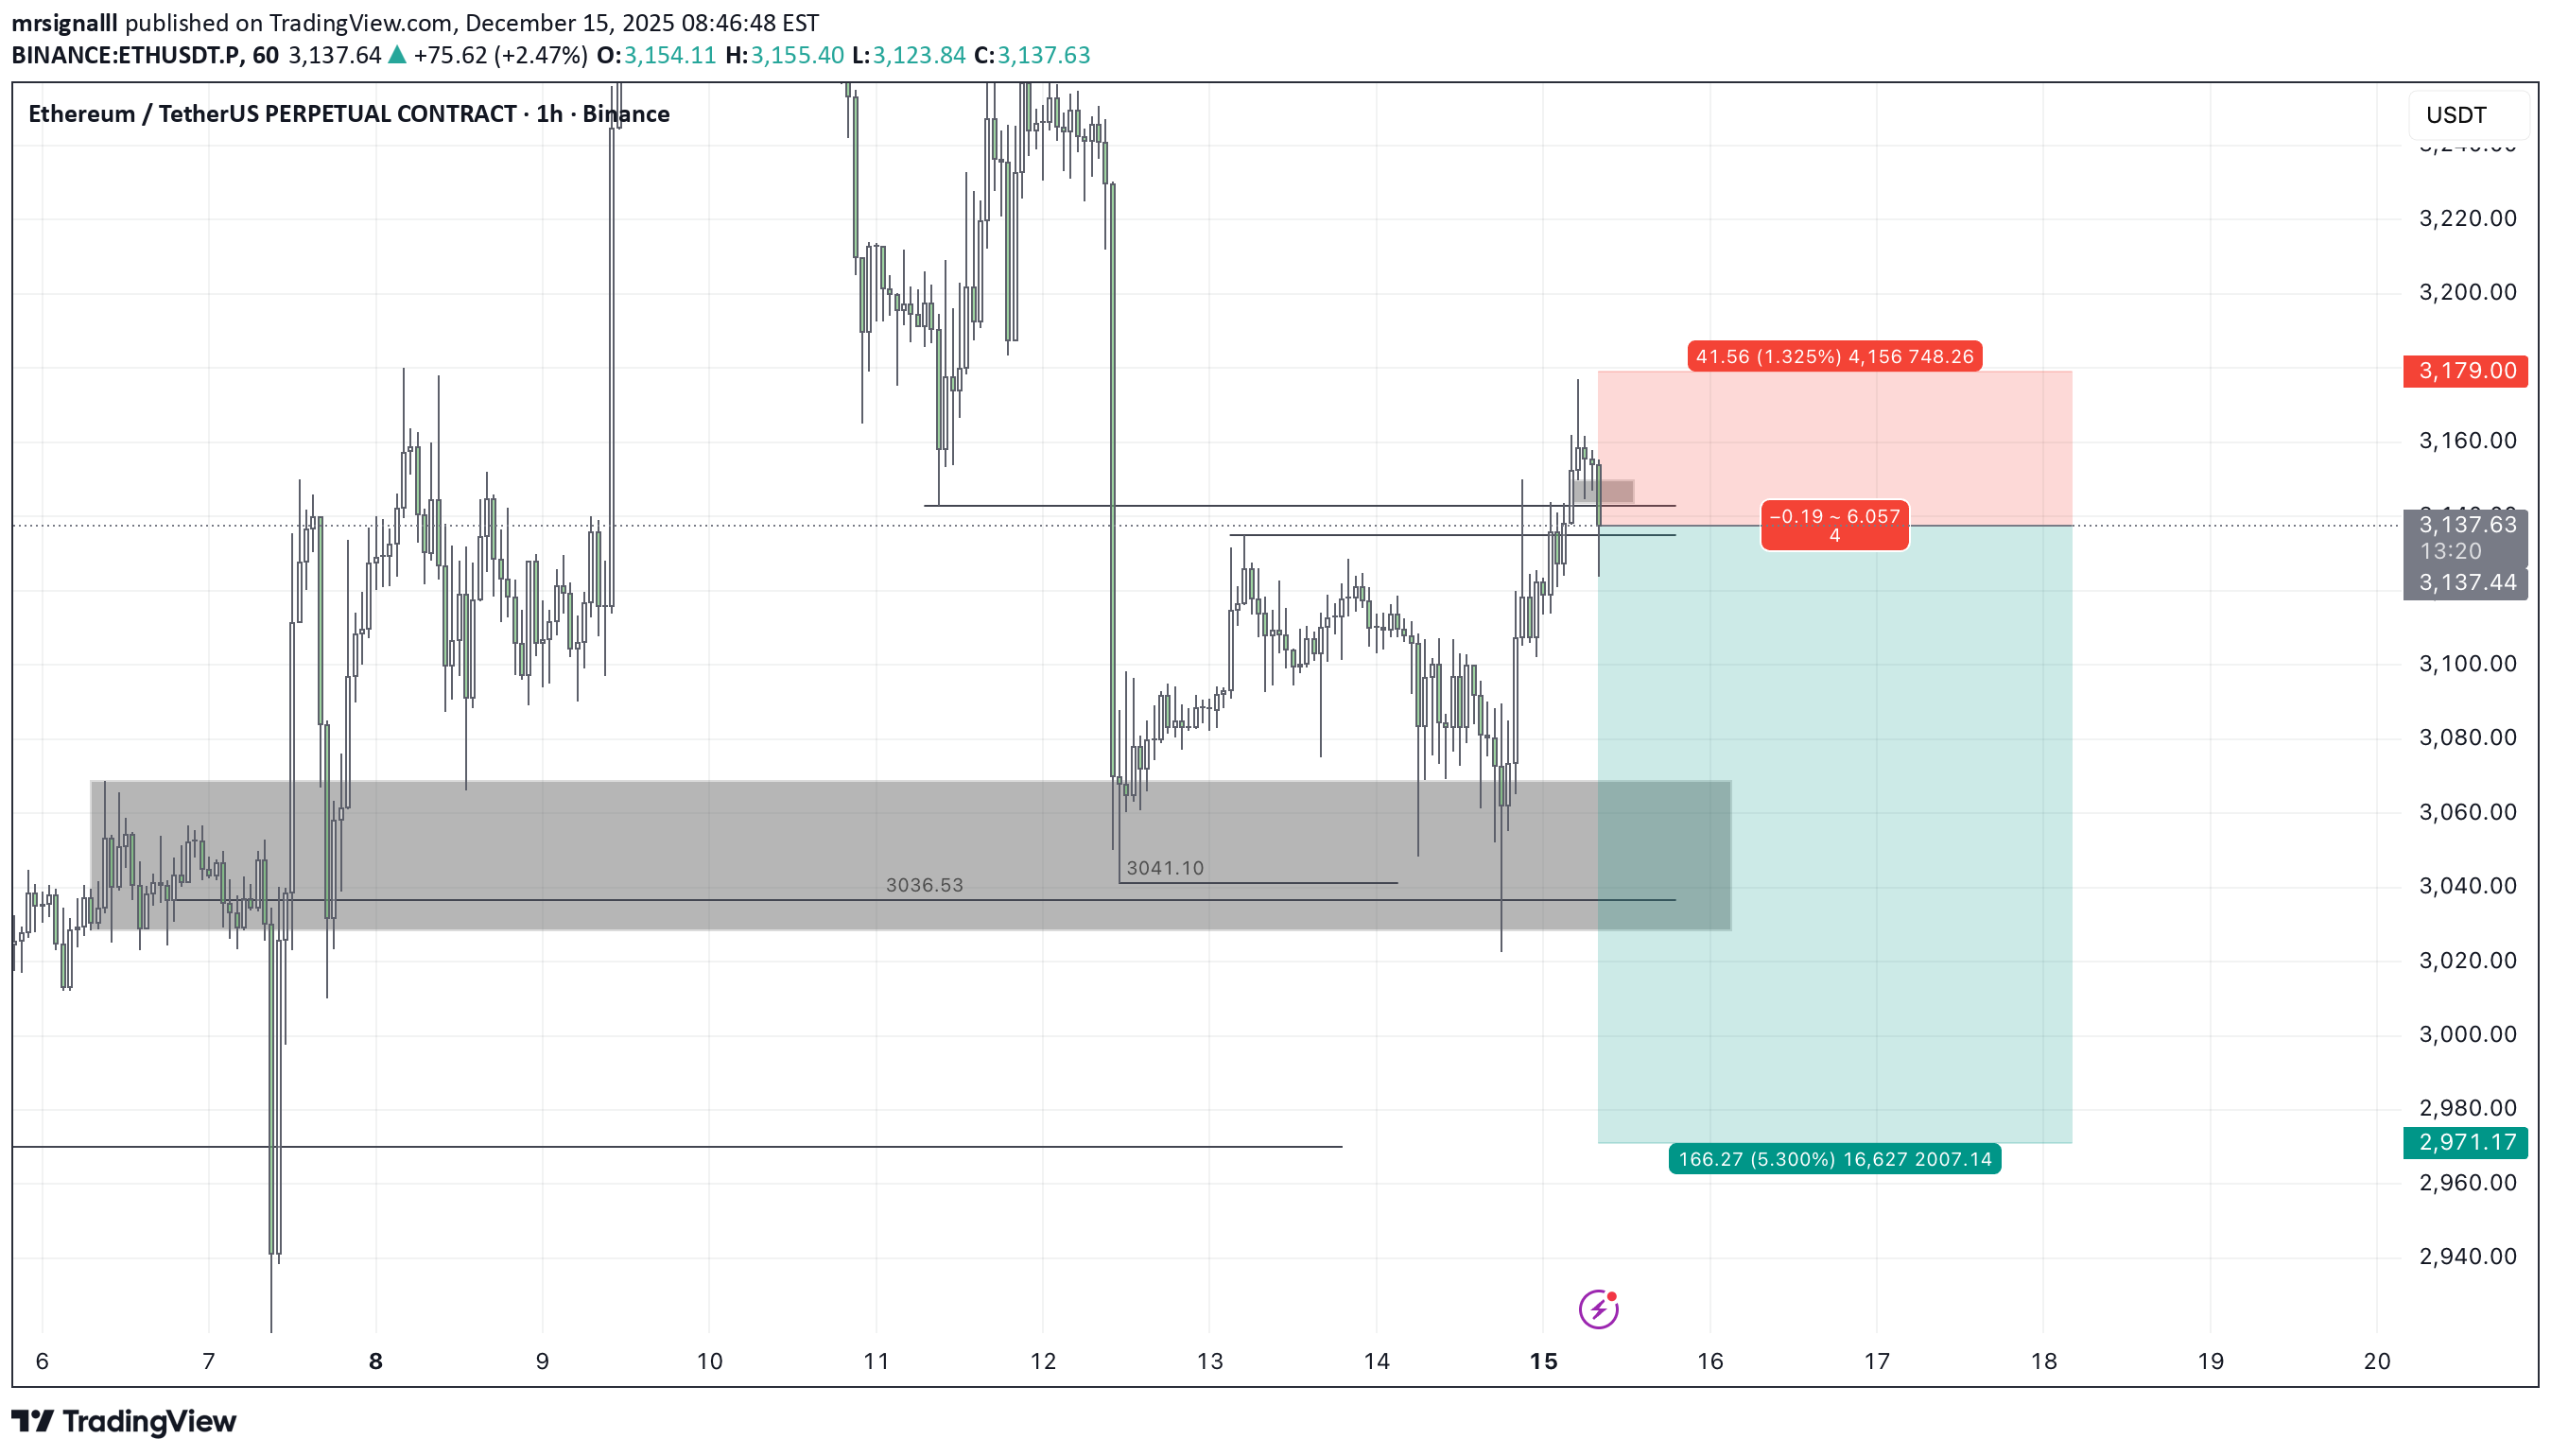
⚡⚡ #ETH/USDT ⚡⚡ Exchanges: Binance Futures Signal Type: Regular (SHORT) Leverage: Isolated (15X) Entry Targets: 1) 3137.44 Take-Profit Targets: 1) 3096.04 2) 3054.16 3) 3012.80 4) 2971 Stop Targets: 1) 3179#ETH/USDT All take-profit targets achieved 😎 Profit: 80% 📈 Period: 3 Hours 15 Minutes ⏰

jirapattinn
Elloit wave ETH 12/15/2025
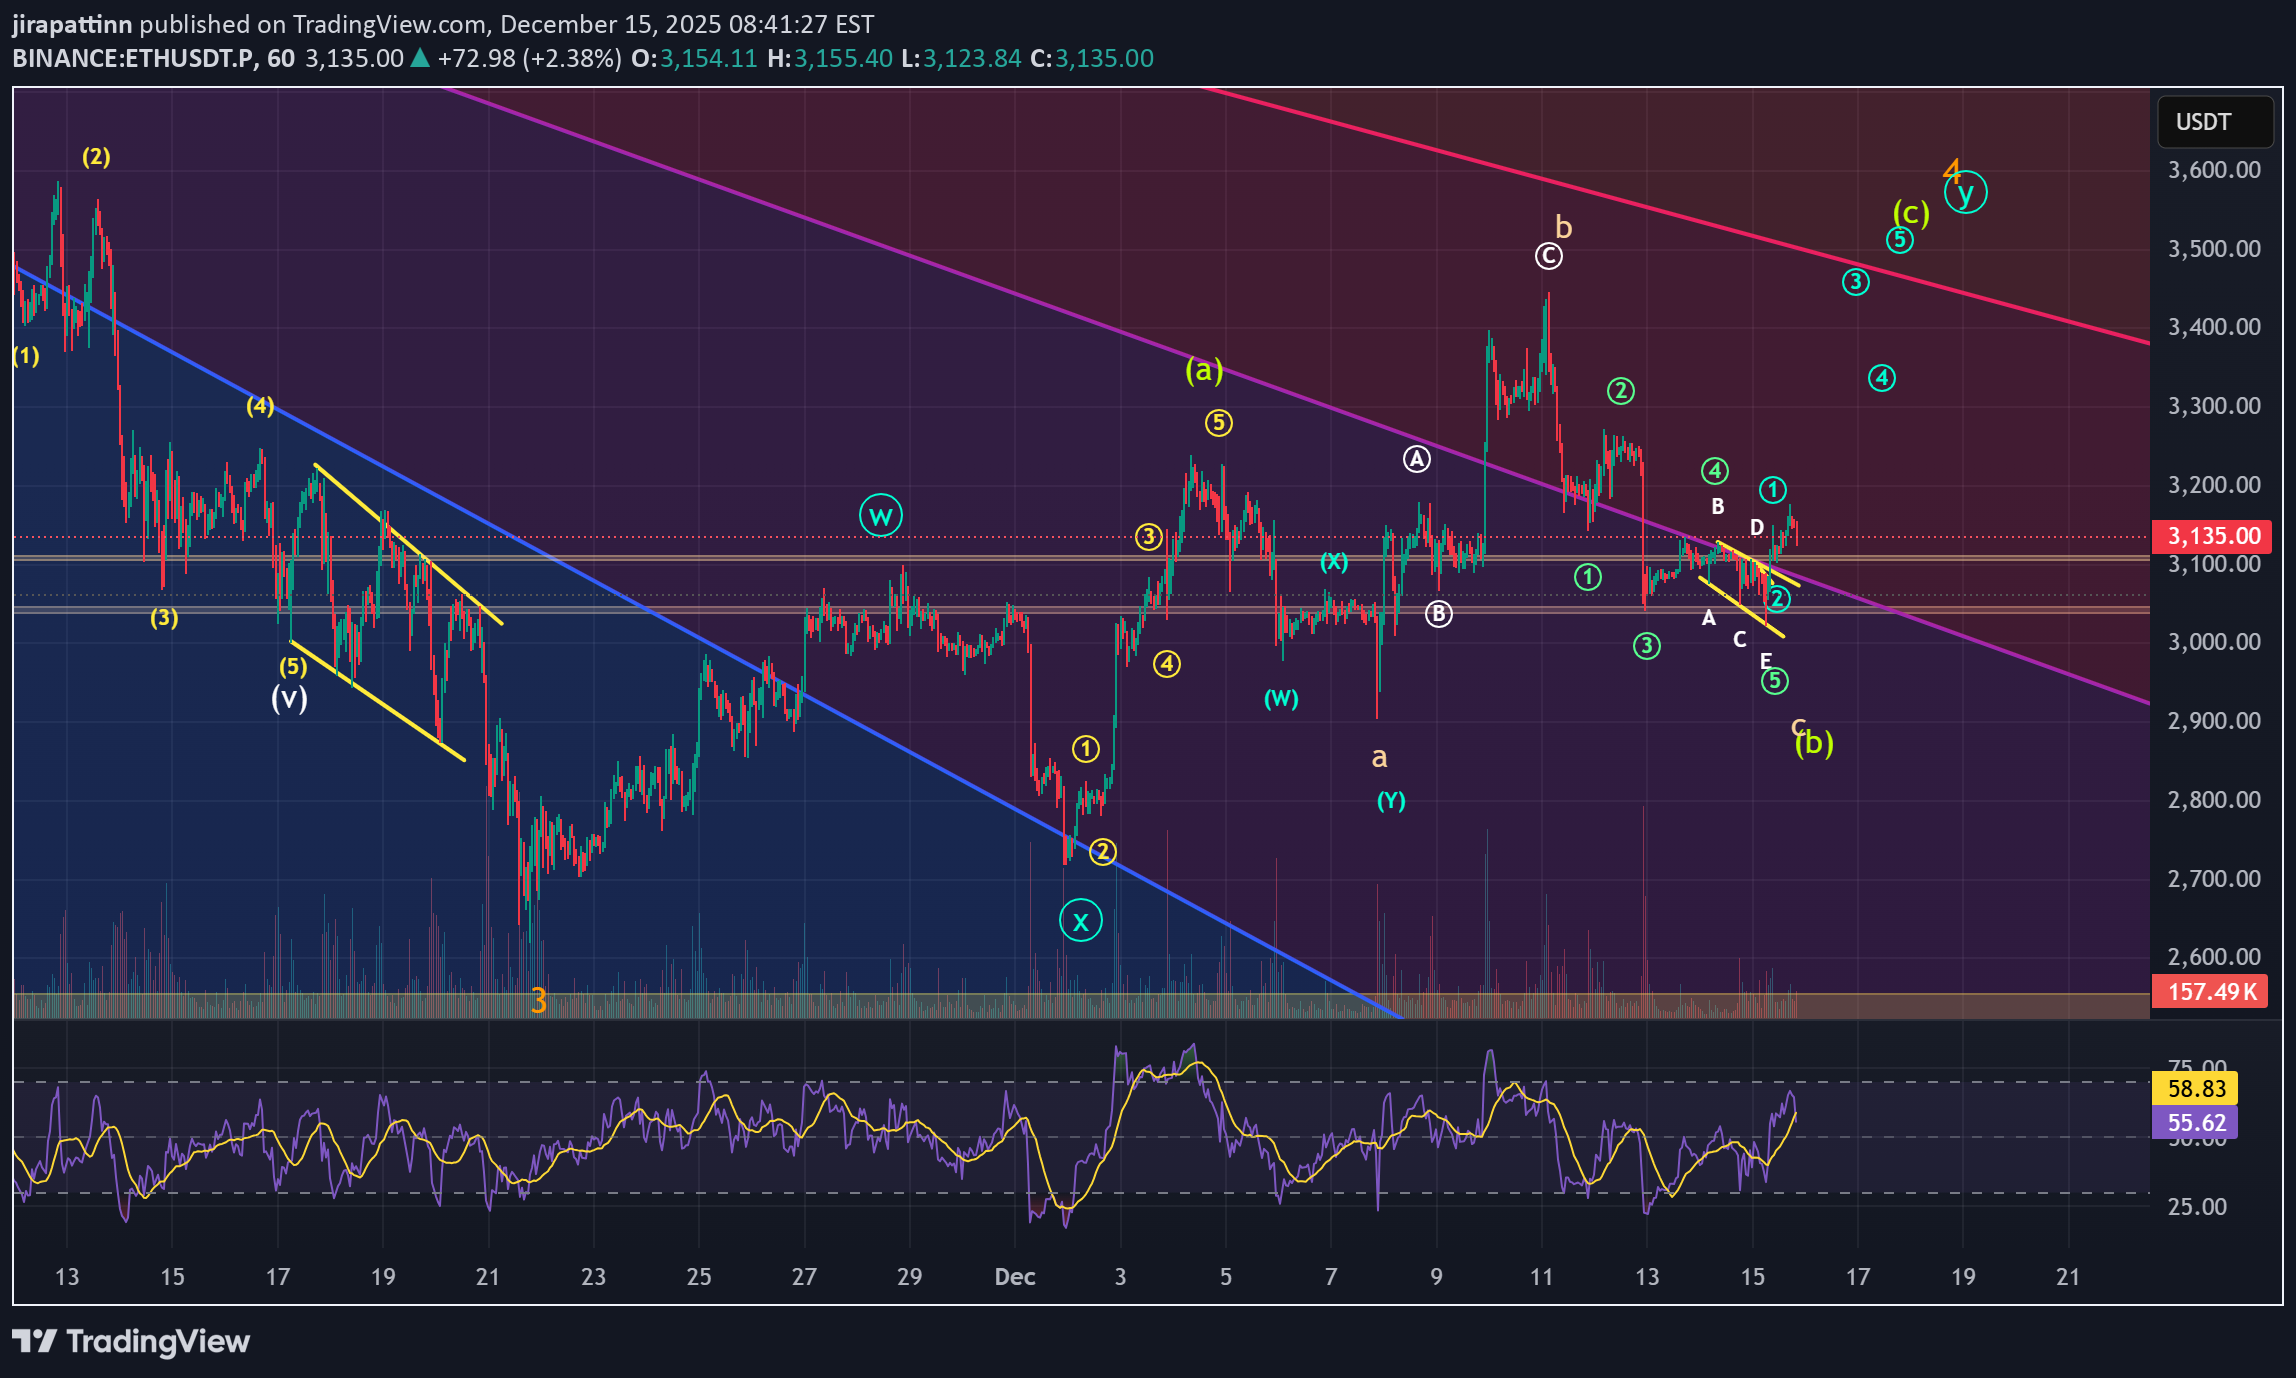
ETH has been forming a complex correction recently, which could represent either a larger wave (II) or a minor wave 4 within wave (I). This corrective structure is difficult to count precisely; however, as time passes, it appears that the correction has not yet finished. The recent downward pressure likely marks the end of wave (b) within the Ⓨ wave. This view is further supported by Gann resistance, leading me to expect that the correction may complete around the 3,450–3,500 level.I have overlook a possibility that the wave ④ is not end yet. So there is a wave 5 as we see, But I still expect the price to the tarket.
When context refuses to confirm
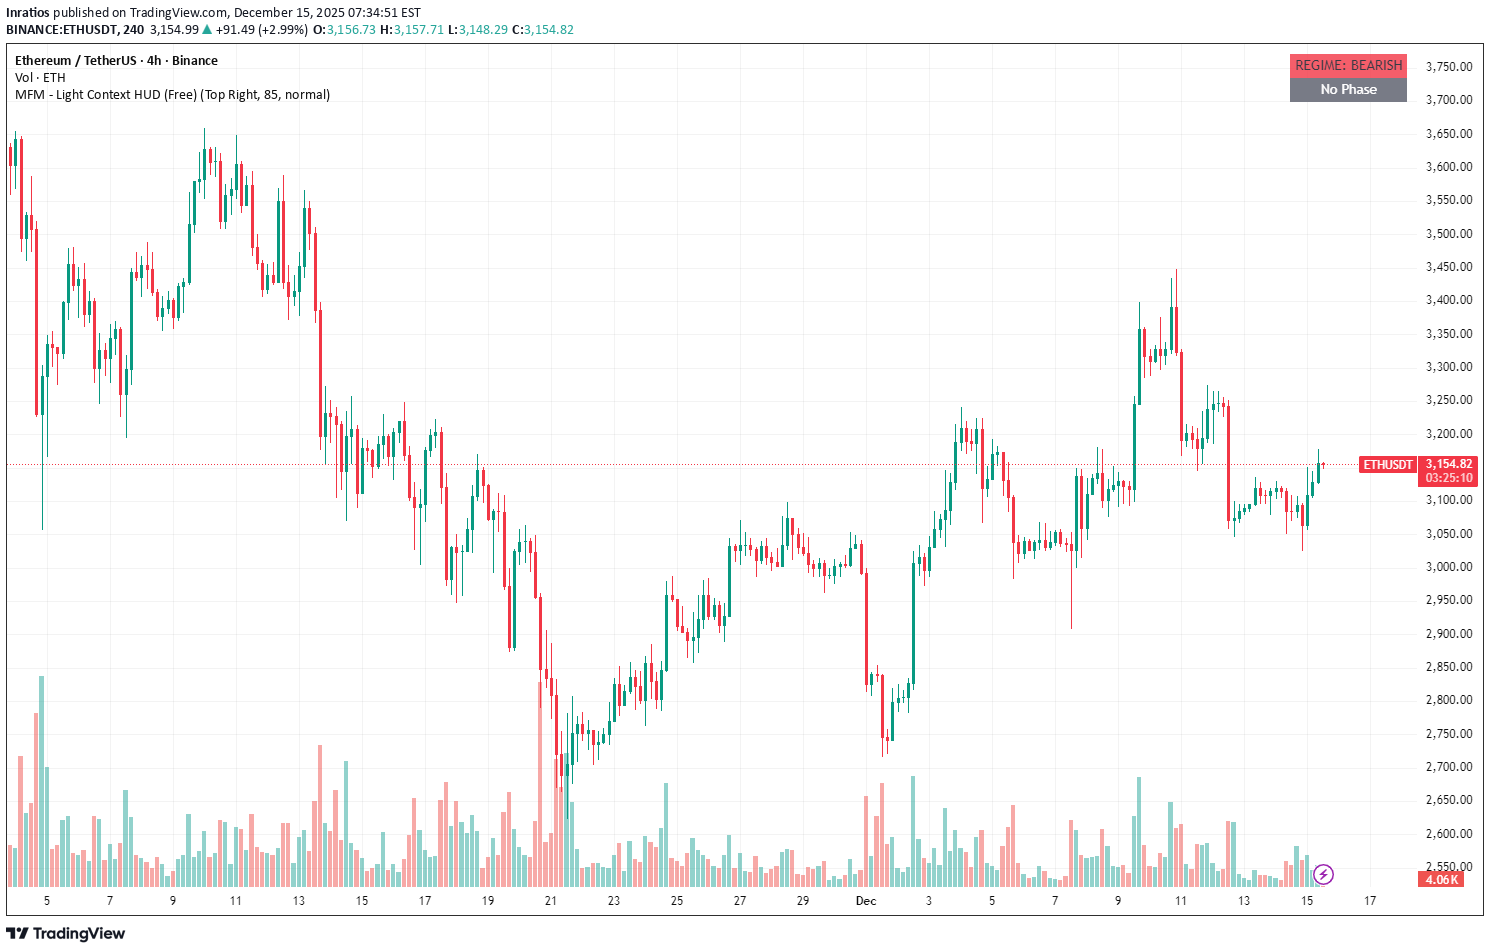
Price moves, reacts, and creates local structure, often triggering the urge to anticipate or “do something”. The MFM Free HUD does not comment on direction or entries. It only shows the broader market context. In this case, the environment remains bearish, with no structural phase in control. No phase doesn’t mean “nothing is happening”. It means conditions are unreliable for method-based decisions. Context before action.

SwallowAcademy
Ethereum (ETH): Looking To Break EMAs | Getting Ready For Pump
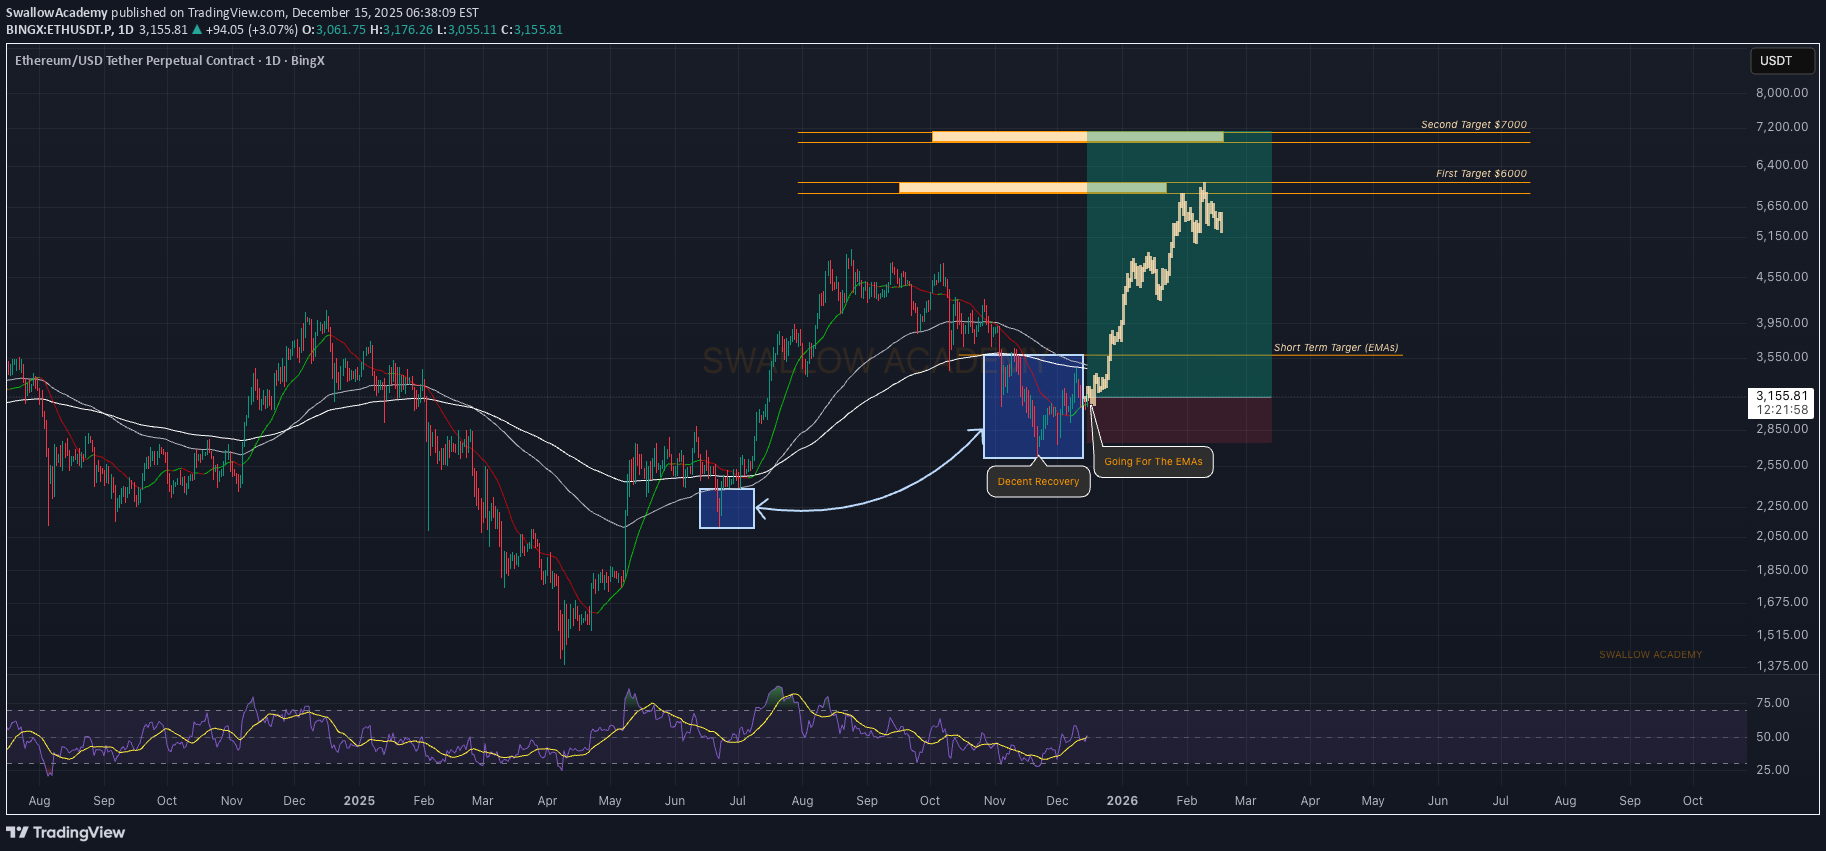
ETH is approaching the zone of EMAs, which is the major breakout point that we are looking for, in order to get that explosive movement to upper zones (just like last time we fell below EMAs). Key focus remains on that zone, while we are also keeping an eye not to form any new local low, which would endanger our game plan here. Swallow Academy
Disclaimer
Any content and materials included in Sahmeto's website and official communication channels are a compilation of personal opinions and analyses and are not binding. They do not constitute any recommendation for buying, selling, entering or exiting the stock market and cryptocurrency market. Also, all news and analyses included in the website and channels are merely republished information from official and unofficial domestic and foreign sources, and it is obvious that users of the said content are responsible for following up and ensuring the authenticity and accuracy of the materials. Therefore, while disclaiming responsibility, it is declared that the responsibility for any decision-making, action, and potential profit and loss in the capital market and cryptocurrency market lies with the trader.