
Nyraen
@t_Nyraen

What symbols does the trader recommend buying?
Purchase History
پیام های تریدر
Filter
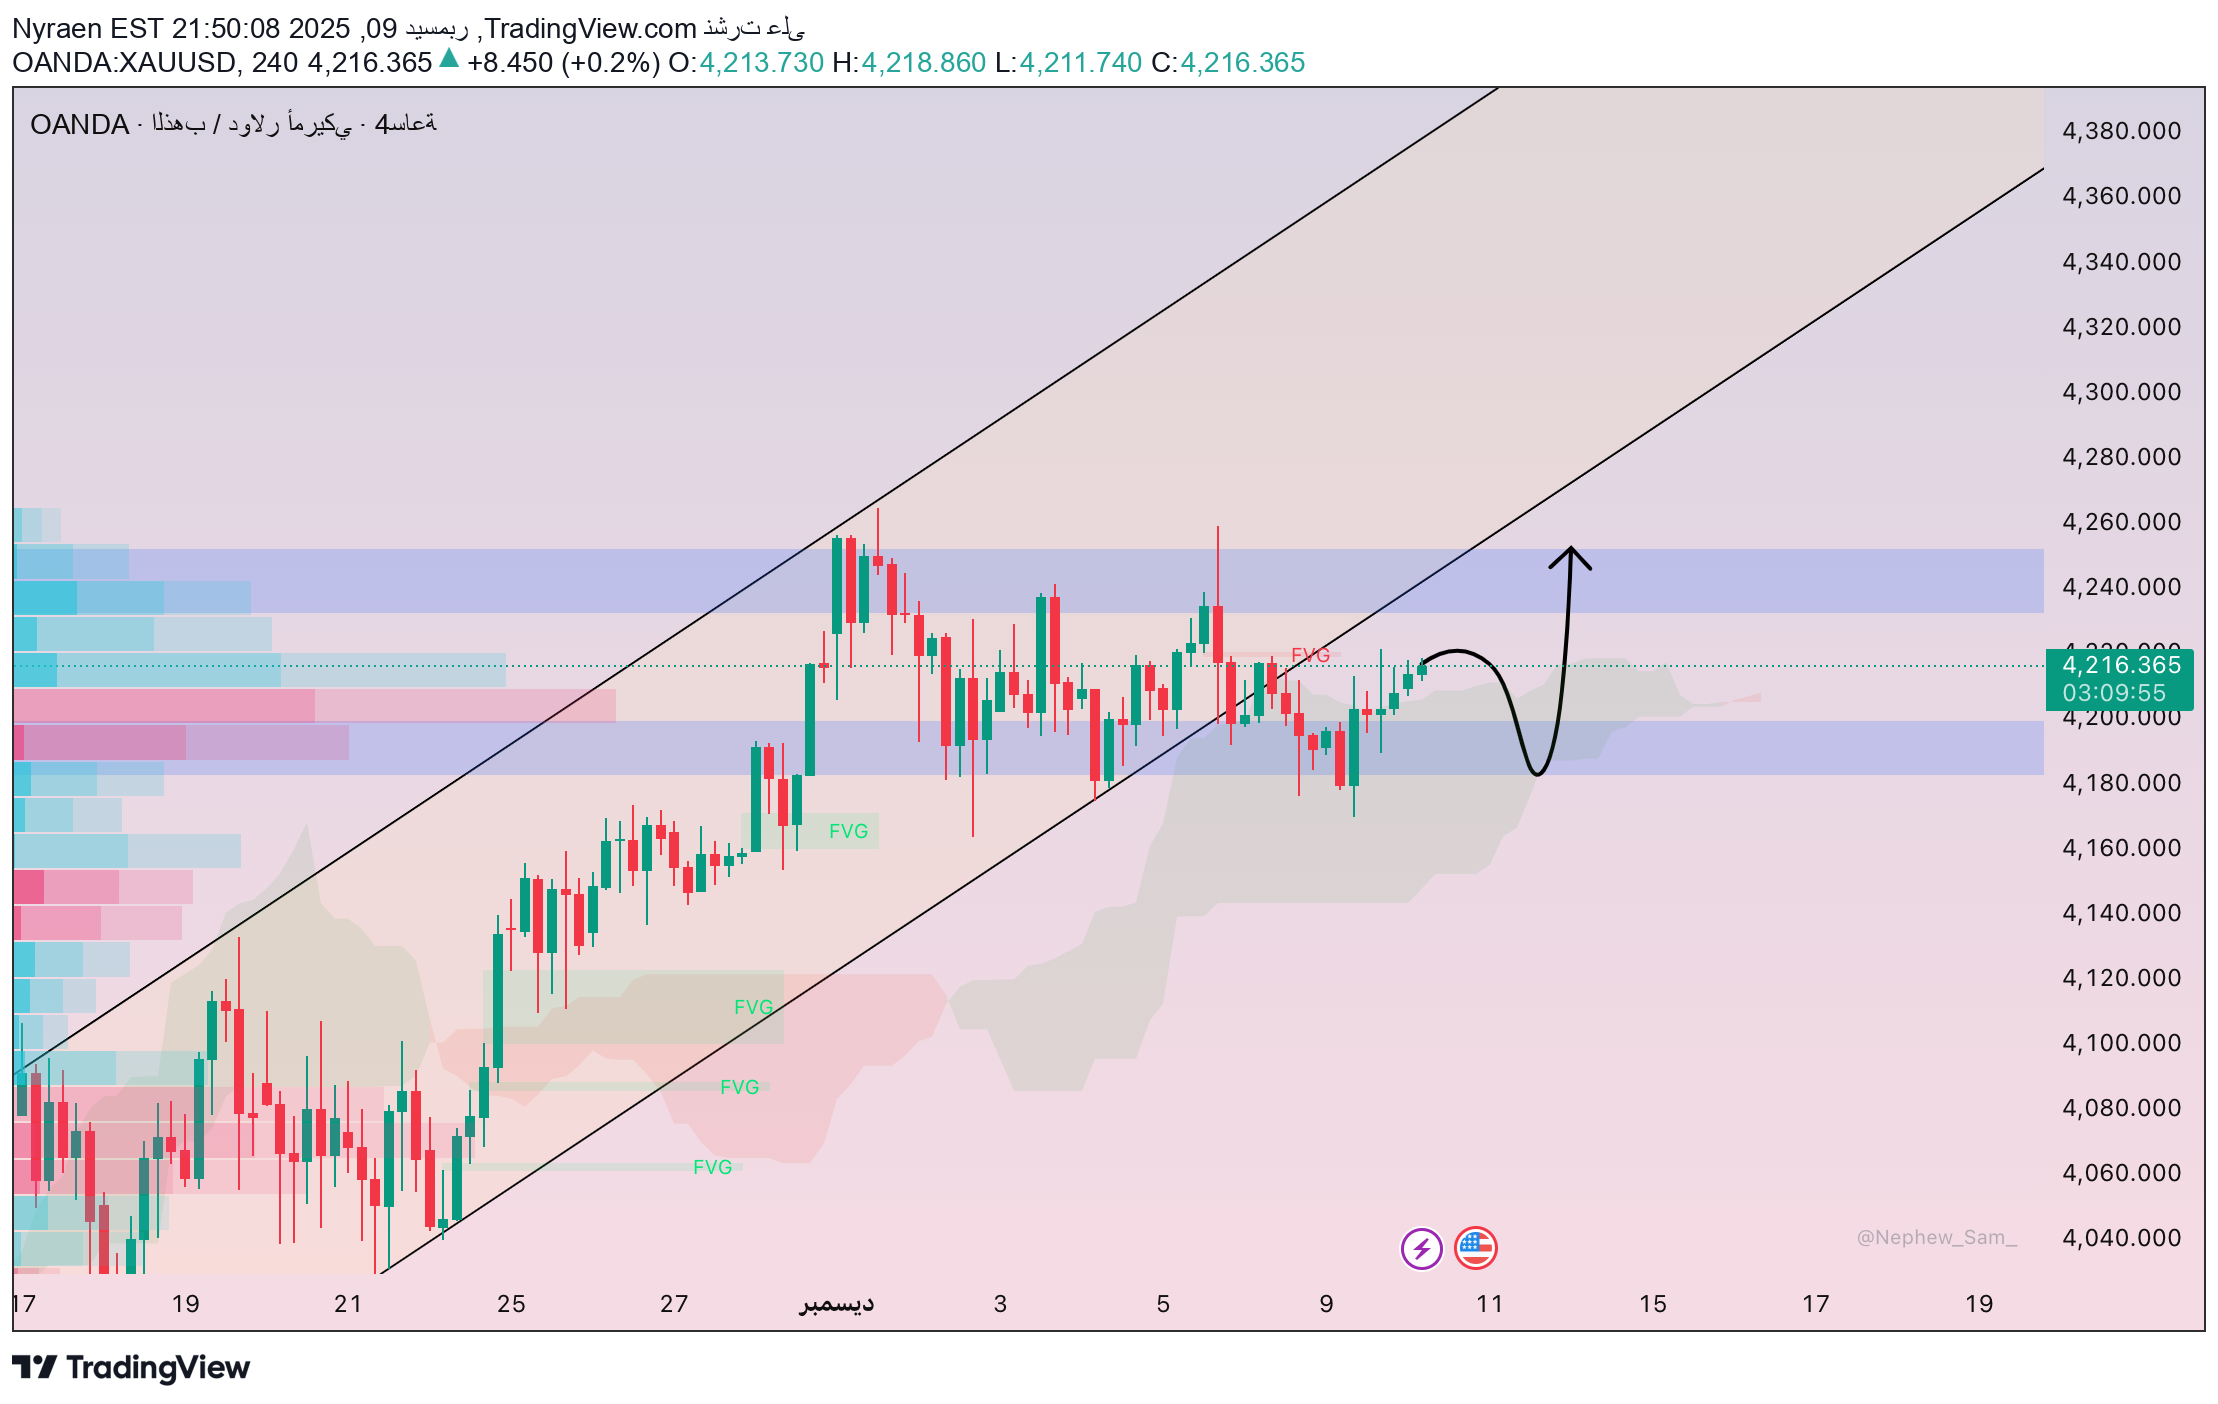
Gold Builds a Base After Breakout Before Next Rally
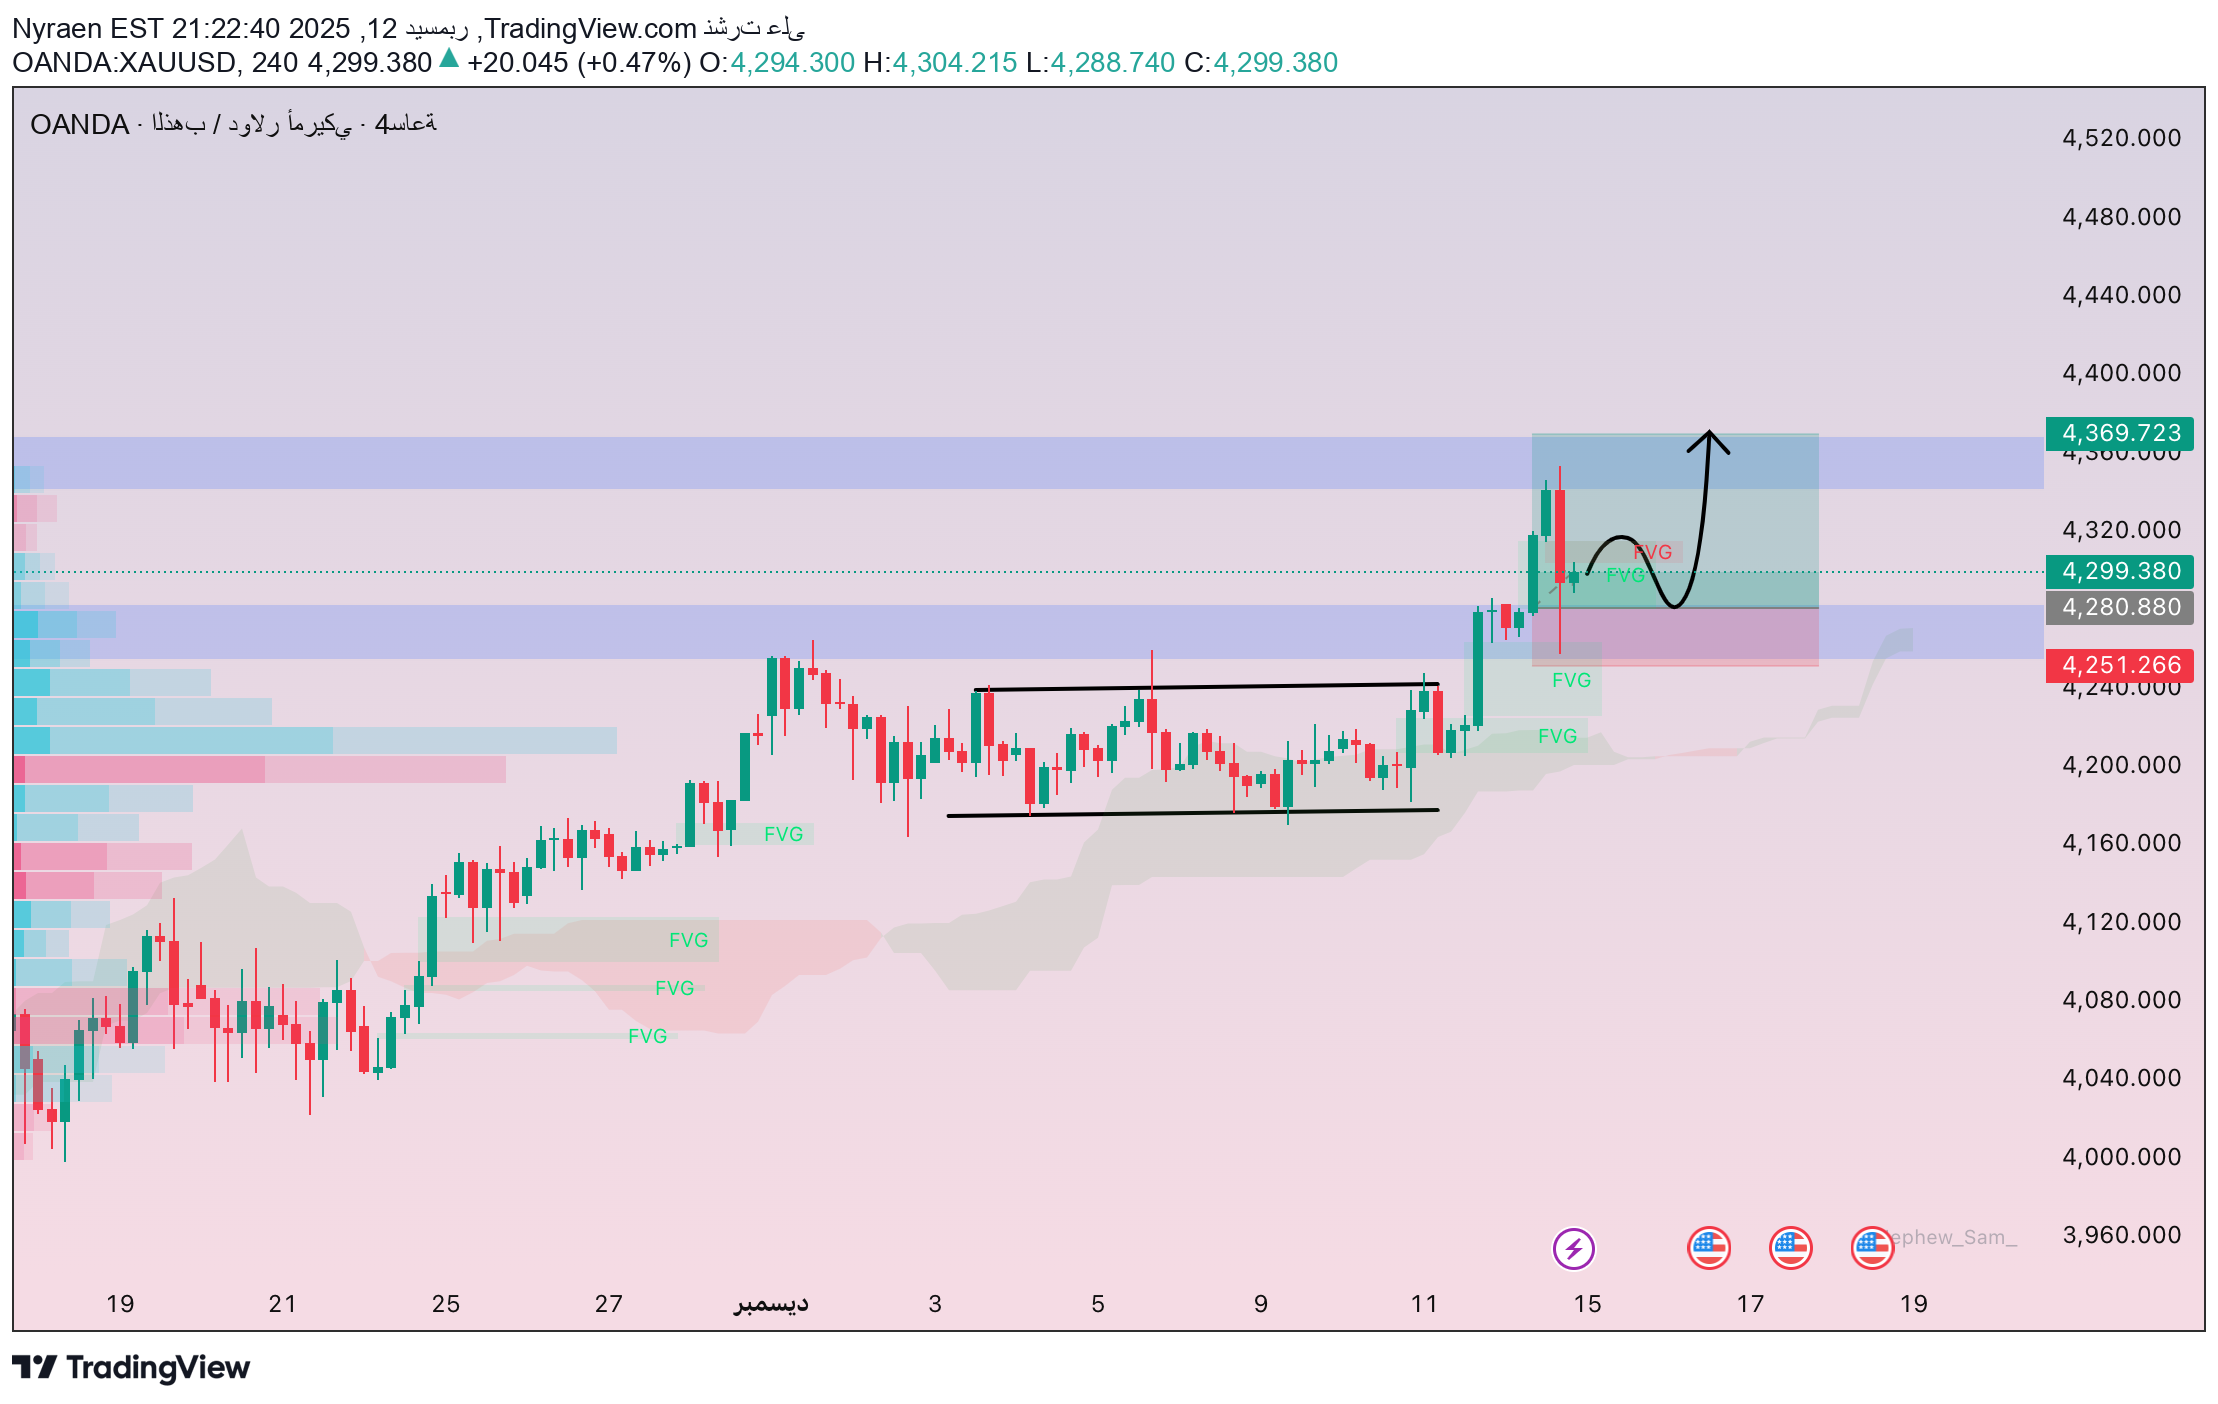
On the four-hour frame, gold's breach of the previous peak shows behavior closer to collecting liquidity than starting a disposal phase. Despite the rapid decline after the summit, the bullish structure was not broken, which confirms that the general trend still exists. Fundamentally, gold remains supported after the Fed's 0.25% rate cut, which pressured the dollar and pushed flows into precious metals. At the same time, the market is awaiting the US jobs data on December 16, without strong negative factors capable of changing the upward trend. Technically, the move towards 4,330 represented a clear liquidity clearing, followed by an orderly correction phase. Below the price there are successive FVG zones providing gradual support at 4,290–4,300, then 4,255–4,265, and finally the key protection zone 4,230–4,240. The Ichimoku indicator is still positive, and the price is stable above the cloud. The most likely scenario is for the price to return to test support areas before resuming the rise towards 4,330, with the possibility of extending to 4,360–4,380, and perhaps 4,400 if jobs data is supportive. The deep bearish scenario only becomes effective with a clear close below 4,245 on the four-hour frame.
BTC Consolidation Signals a Possible Final Dip
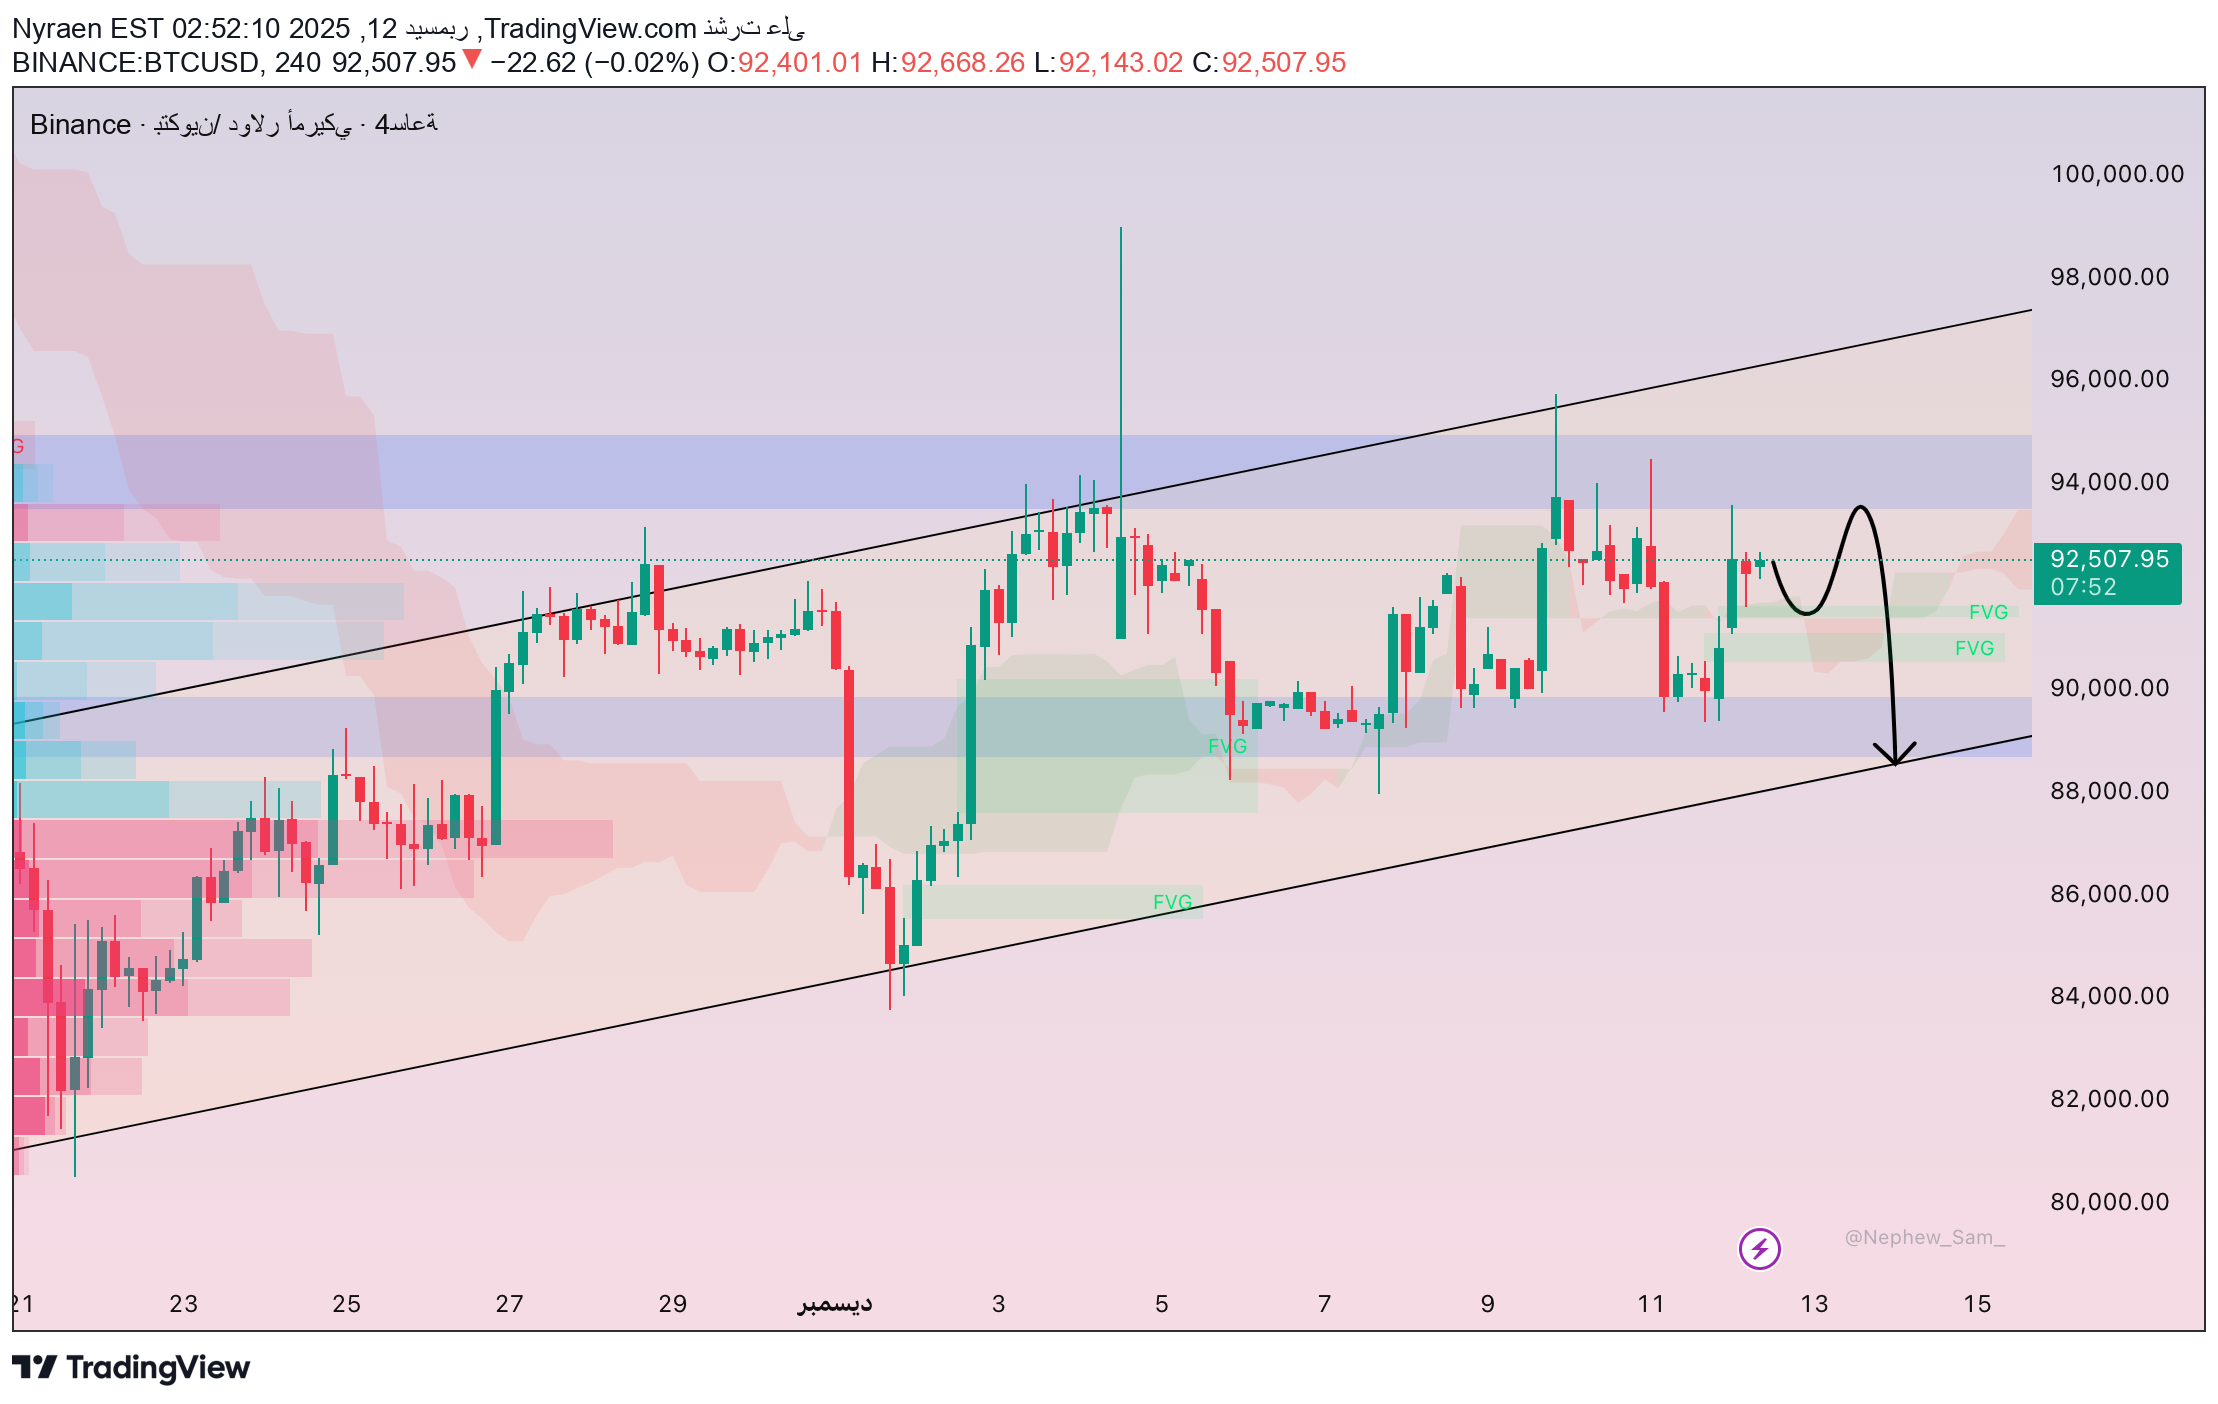
On the 4-hour chart, Bitcoin is moving within a narrow sideways range between 91,500 and 93,500, with the current move looking more like gathering liquidity than starting a new trend. Every attempt to rise near 92,000 is met with immediate selling that brings the price back into the range. Although the general economic environment supports high-risk assets, flows go more clearly towards gold and silver, which keeps Bitcoin’s movement merely a technical rebound after the recent decline. The price is holding above the Ask/FVG areas at 89,500–90,500 and 86,500–88,000, which represent key support. The most likely scenario is a final decline to raise more liquidity. Sideways trading may continue for a bit before the price returns towards 90,000 and then heads to test the deeper area at 88,000–86,500 in preparation for a stronger uptrend.
The Market Is Powering Up, Not Shifting Direction
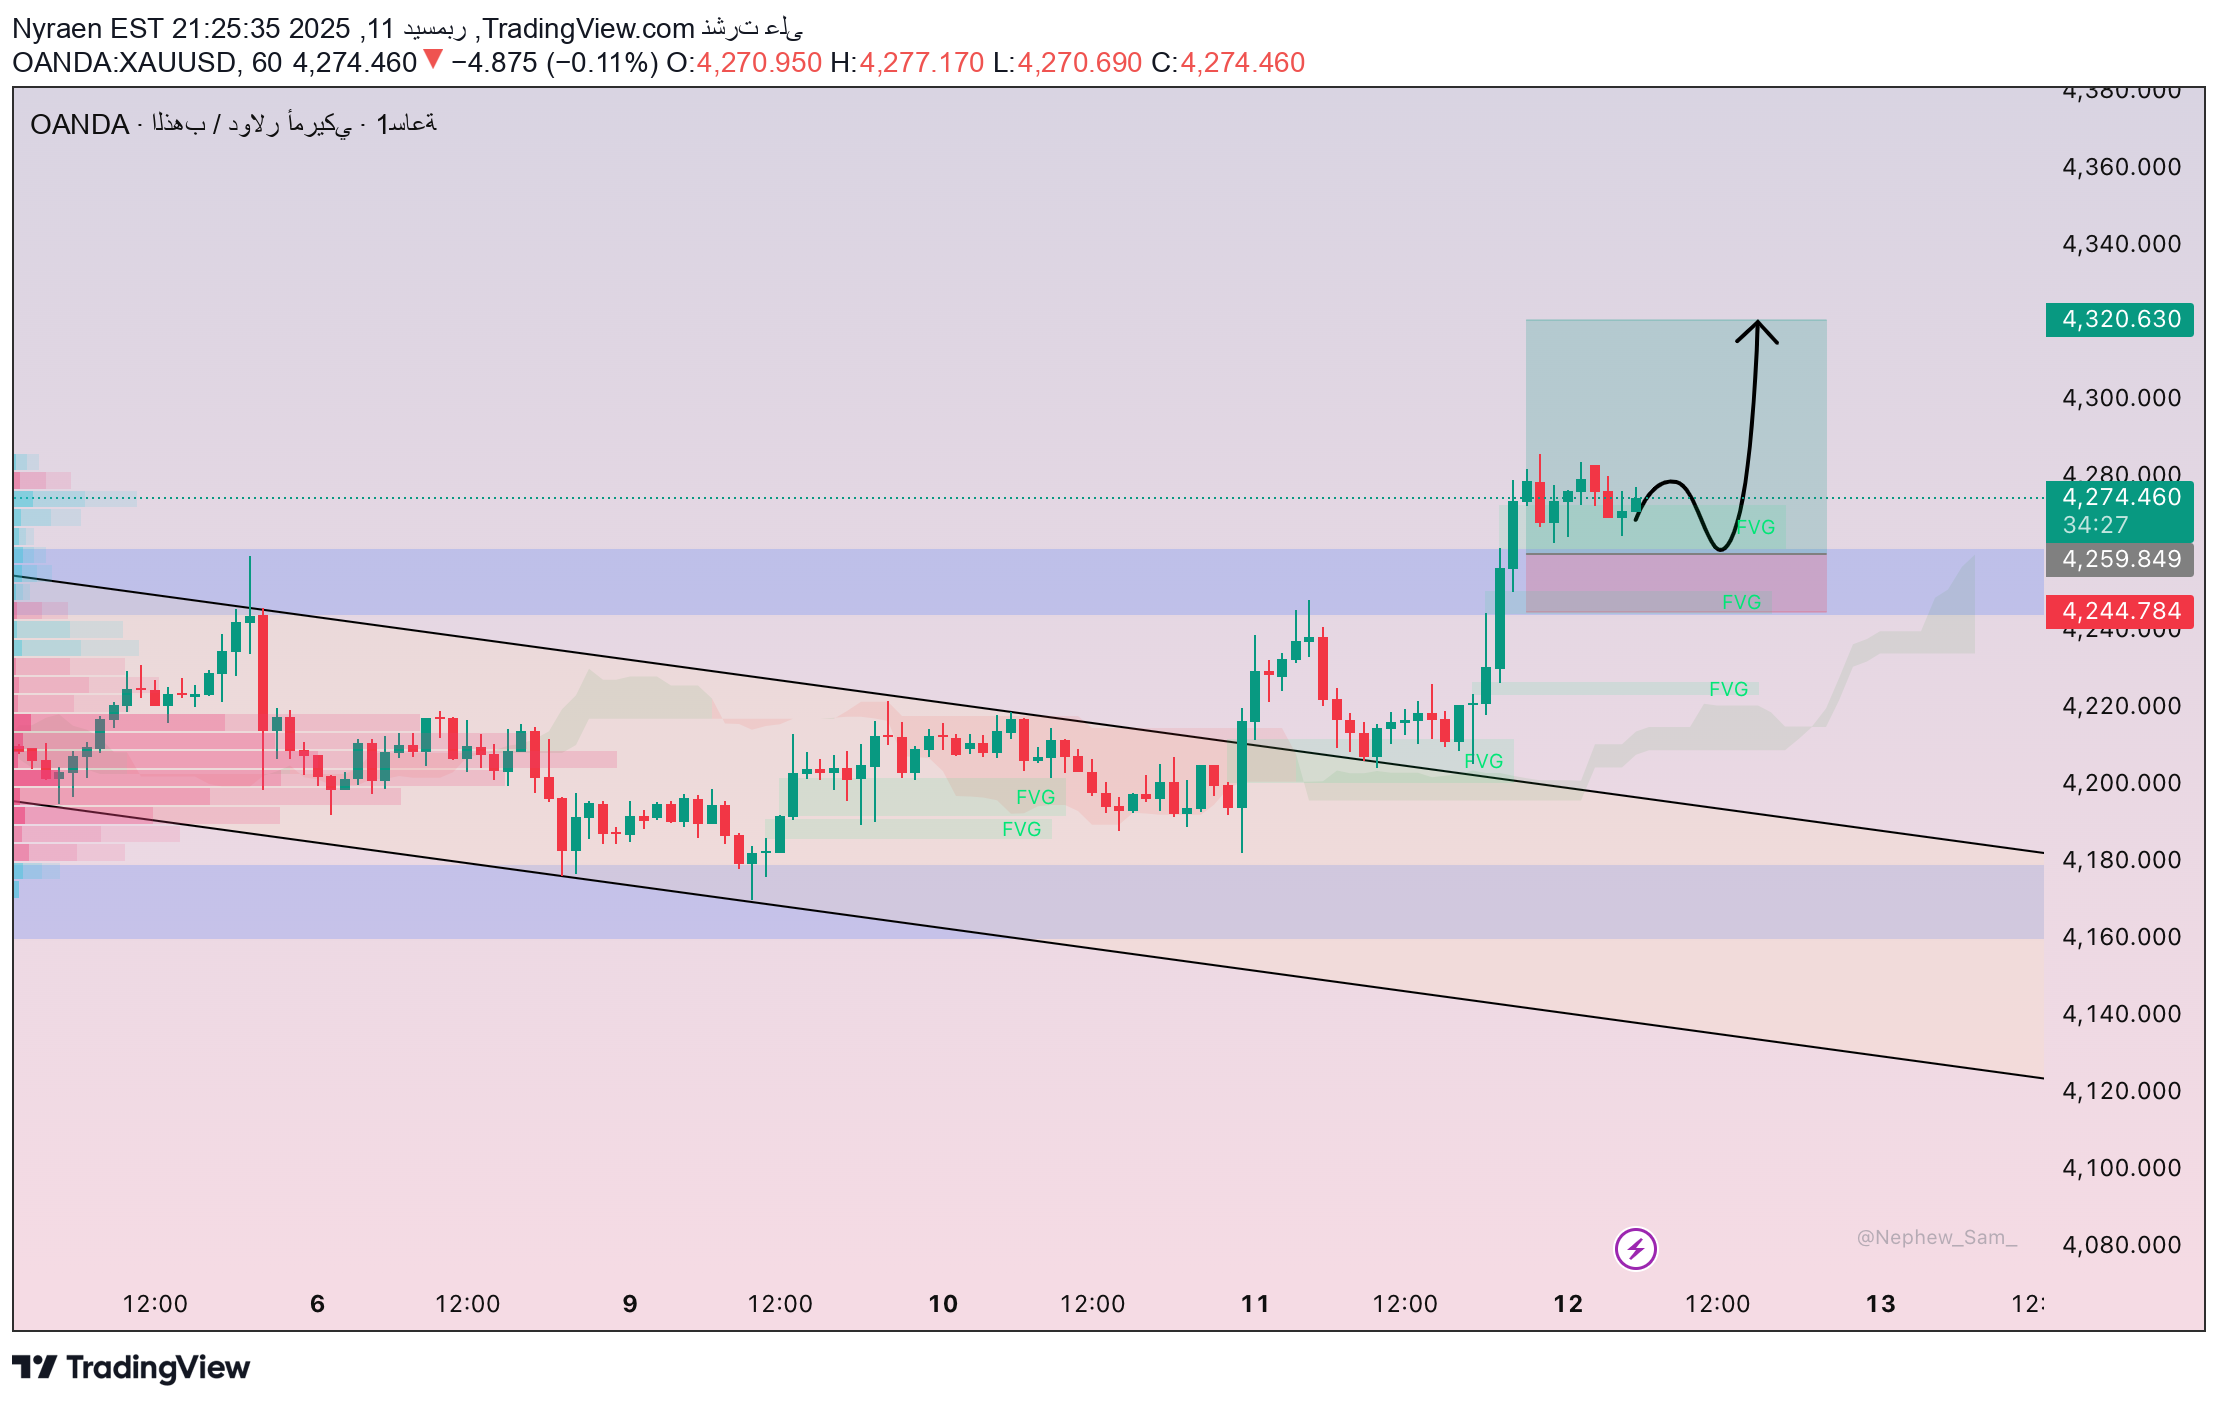
Macroeconomic conditions still support gold's bullish trend: the Fed has cut interest rates three times in a row, the dollar is gradually weakening, labor data shows a decline in momentum, and geopolitical tensions are boosting demand for safe havens. ETF flows have also calmed, indicating that the current corrections are merely a pause for breathing and not the beginning of a reversal. On the chart, the bullish structure is still evident with higher lows and continued filling of FVG areas — evidence of the continued dominance of institutional funds. The price is currently reacting within the range of 4,260–4,270 FVG, which increases the possibility of a further decline towards a better liquidity area. The 4,240–4,250 range is an ideal consolidation area, while 4,200–4,220 is the strongest support thanks to a large FVG confluence with the previous low. Basic scenario: Rejected near 4,275–4,280 and then retreats to 4,240–4,250 to gather strength. A good response there could push gold towards 4,290-4,310, with the possibility of reaching 4,330 if data like CPI or unemployment claims are supportive. The alternative scenario is to withdraw liquidity towards 4,200-4,220 before a strong rise.
سقوط إيثريوم (ETH) الكبير: هل حان وقت الشراء أم بداية الانهيار؟
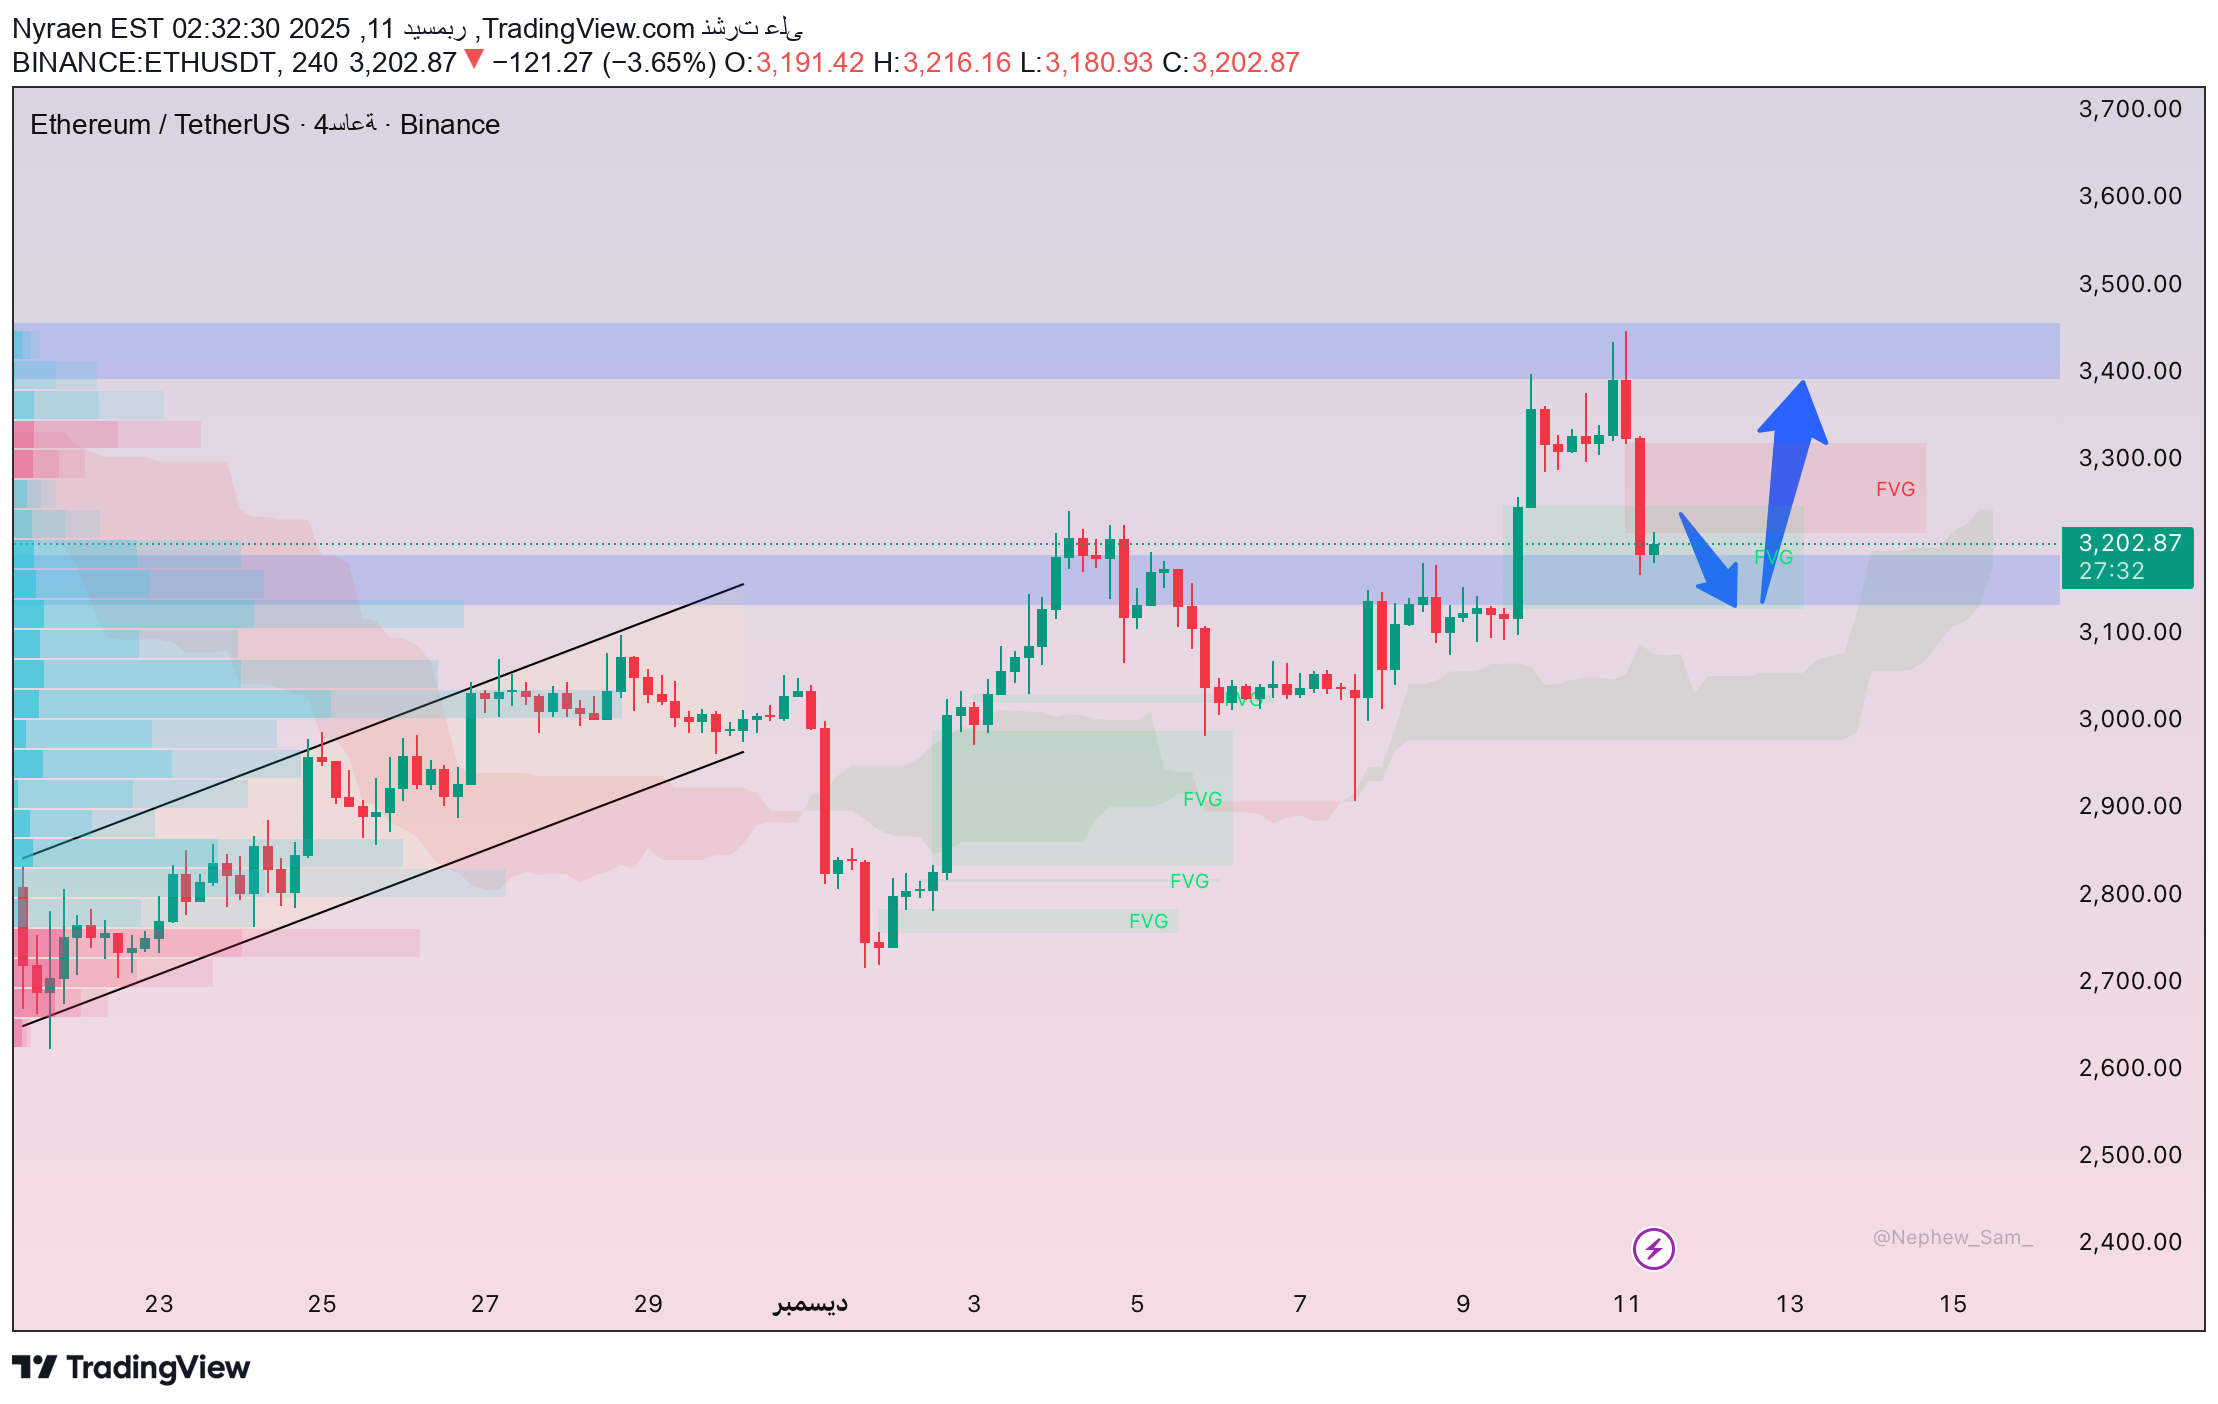
ETH saw a sharp decline from the 3,380–3,400 area to the FVG range at 3,180–3,200, where a clear bounce appeared indicative of a liquidity drawdown, i.e. a deep downward movement to collect orders before a bounce from an important demand area. Above the price, the negative FVG zone between 3,300–3,360 remains a strong barrier, showing frequent rejections and clear selling activity, and the volume profile indicates weak liquidity in this range. Although the general structure remains bullish thanks to higher lows, ETH enters a deeper correction phase after the pullback movement. The 3,180–3,200 area is turning into a critical pivot — breaking it could change the short-term trend to bearish and push the price towards the 3,000–3,100 range with high volume.
تذبذب الذهب قرب 4200 بانتظار قرار الفيدرالي
Gold is moving in a sensitive phase as the state of technical pressure increases and the markets await the Federal Reserve meeting. Volume Profile analysis indicates strong resistance at the $4,220 level, where large trading volumes were previously concentrated and clear selling pressure appeared. In contrast, the 4,180 and 4,200 areas represent effective support as buyers continue to enter at these levels. The Fair Value Gaps surrounding these areas have not yet been closed, giving the price an opportunity to return and test before a new trend is formed. In the short term, gold is likely to remain confined between $4,180 and $4,220, with the upper bounds acting as a strong ceiling and the lower bound as a reliable retracement zone. In the longer term, the Federal Reserve’s confirmation of the start of interest cuts may push gold towards the 4,280-4,300 range, while any hawkish tone may lead to an additional correction before the rise resumes.
اتریوم در انتظار فدرال رزرو؛ آیا ETH در دامنه 3080 تا 3130 گیر میکند؟
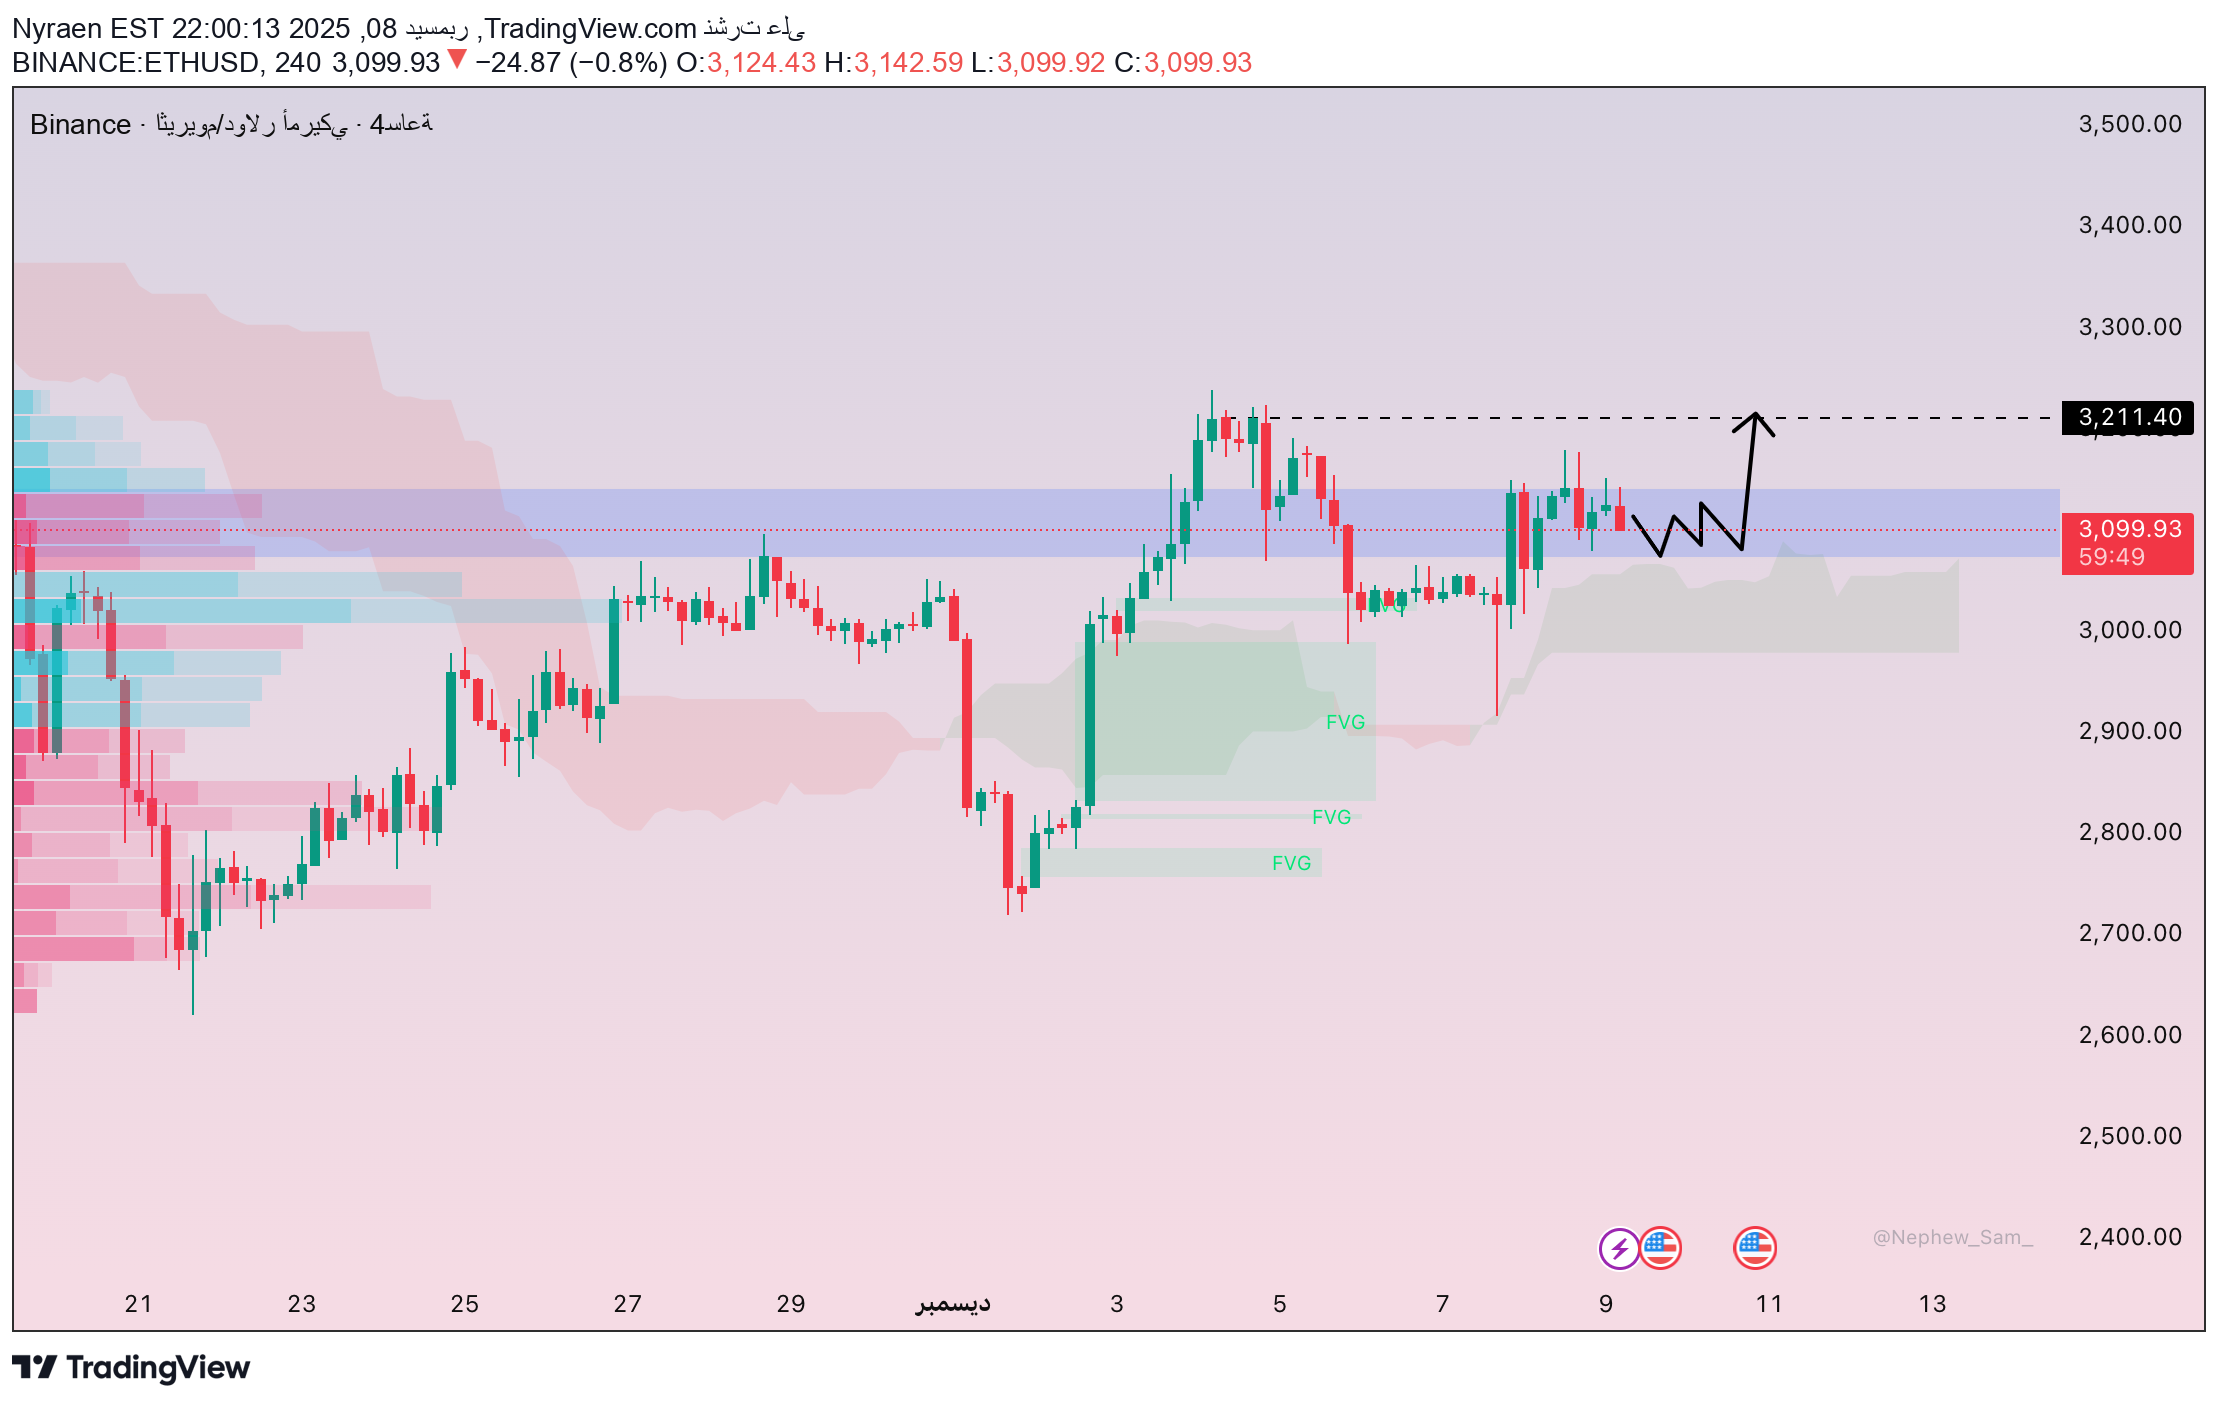
ETH on the 4-hour chart is trading in a range of 3,080–3,130 after a strong bounce from 2,750–2,800, indicating a consolidation phase rather than a continuation of the rise. The current area corresponds to a previous high volume area, while a flat Ichimoku cloud appears to reflect market indecision. The price did not make new highs, and the 2,980–3,050 gap may attract the price to fall and test it. A clear break above 3,150–3,200 is required to confirm a new uptrend.
سولانا بلا زخم صاعد واضح رغم الارتداد الأخير
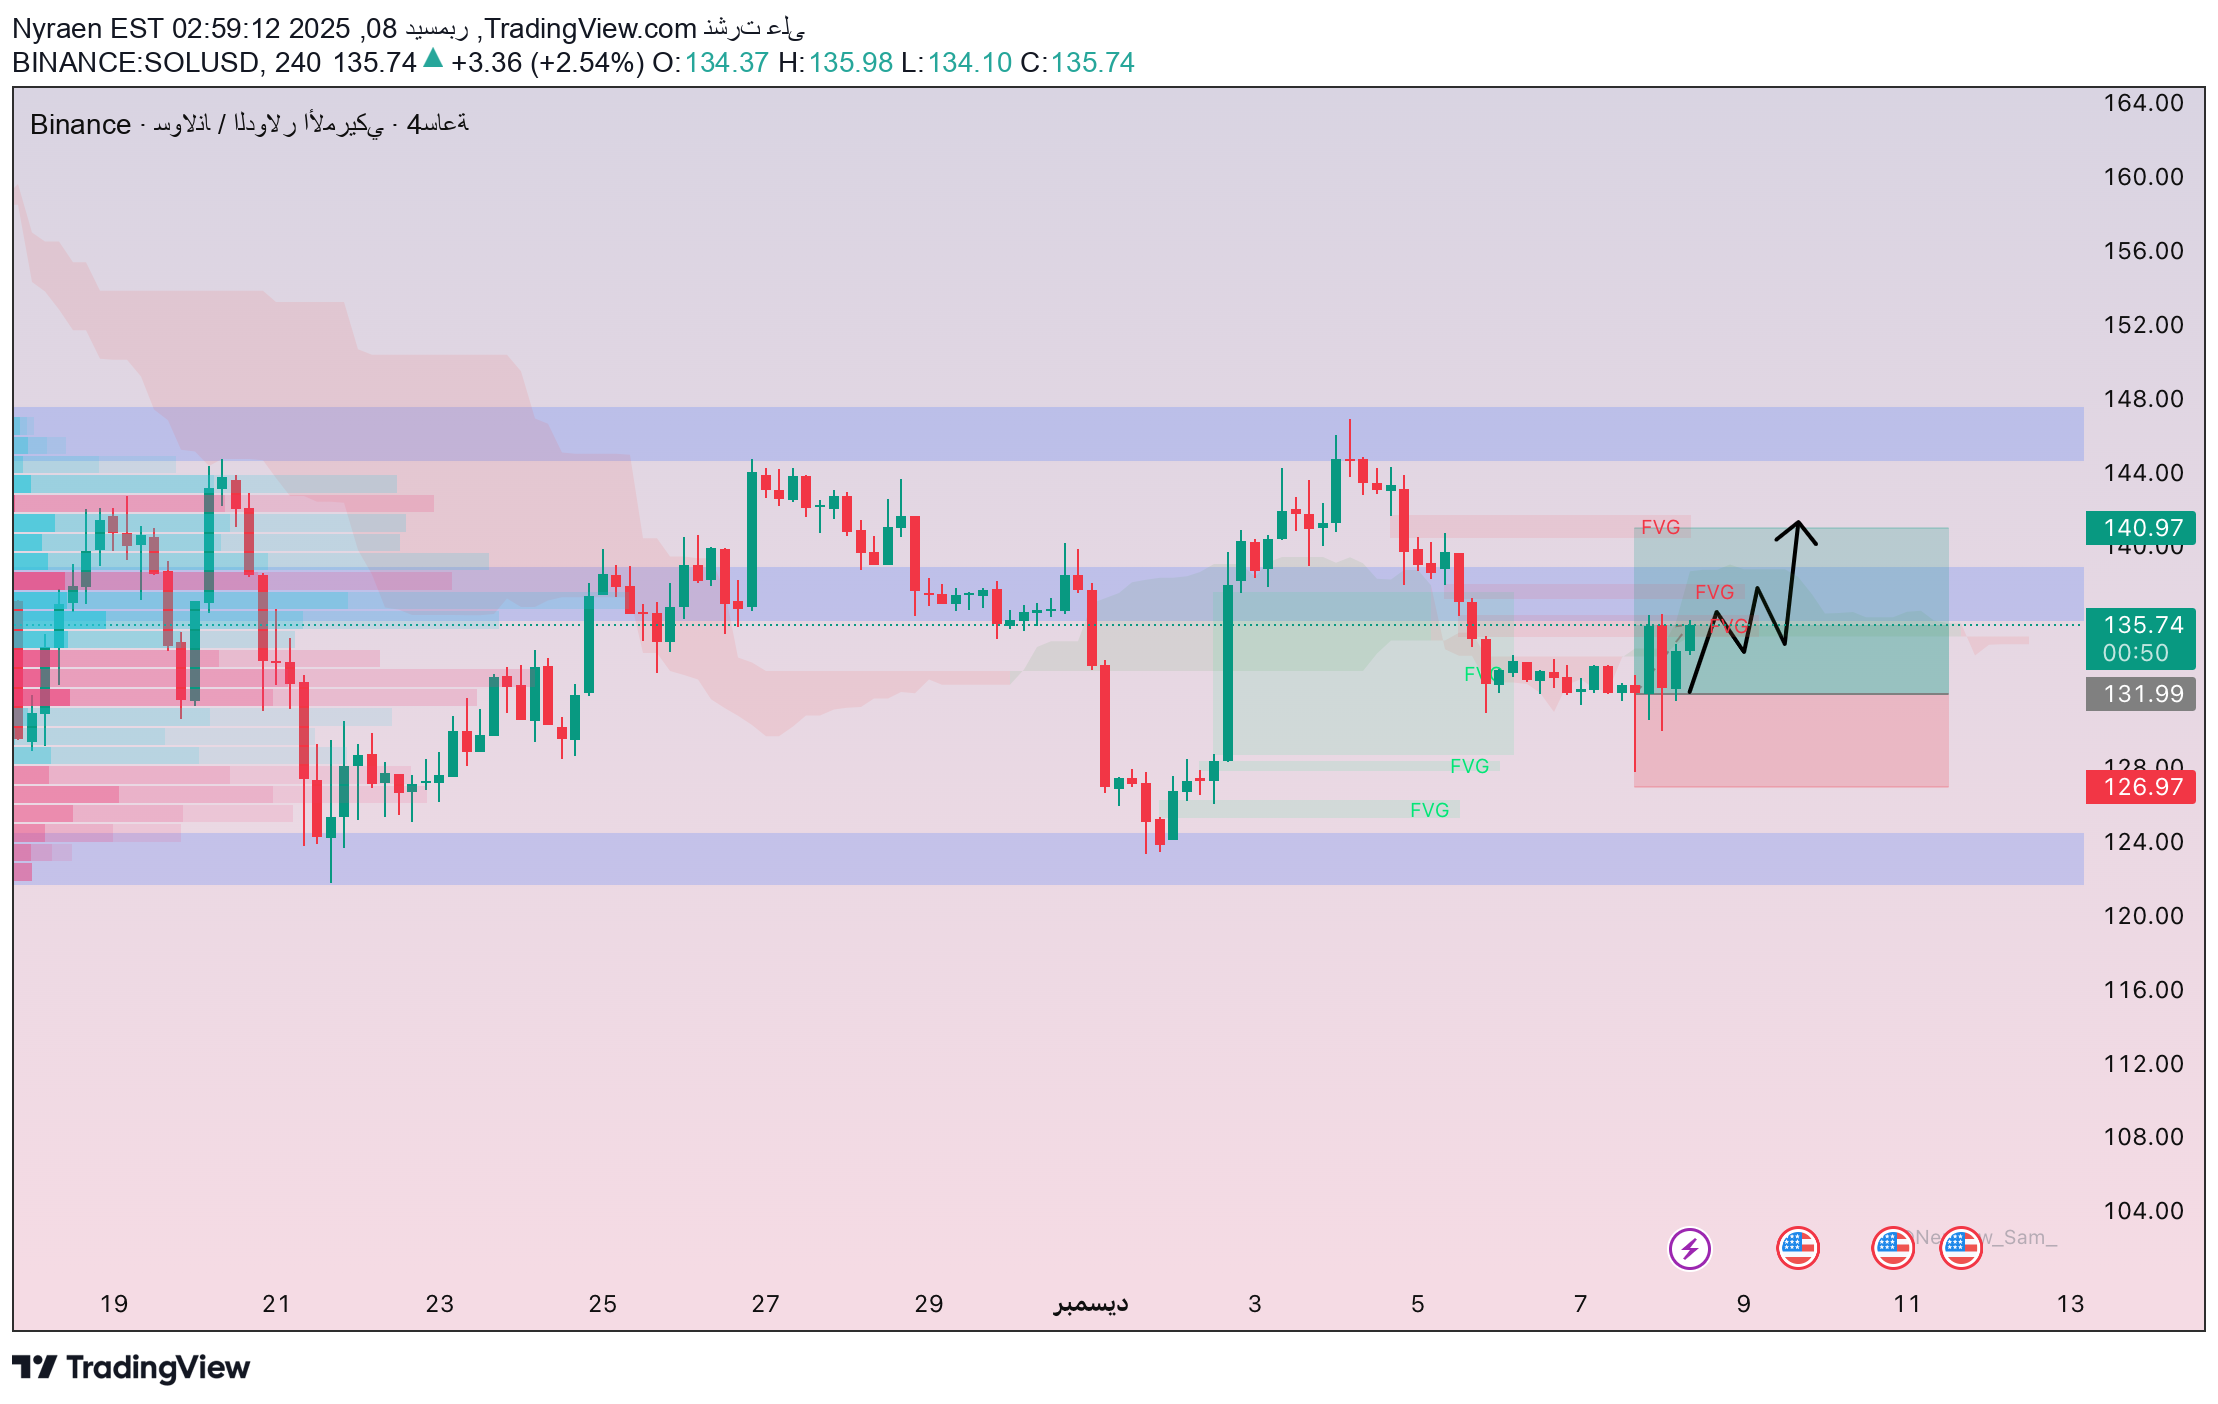
In the 4-hour frame, the SOL pair shows only limited rebound movement, as the price is still stuck below the FVG resistance area between 138 and 142. Short rallies on the way expose weak real demand, while the Ichimoku cloud with several supply zones above the price forms a barrier preventing any effective upside attempt, reducing the chances of a breakout. The behavior of the volume also indicates that what is happening is a technical correction and nothing more; Activity improves slightly at the lows and then declines as the price rises, which means that the buying is defensive and not a new influx. If SOL does not exceed the level of 142, it makes sense for prices to return to fill the FVG located between 128 and 123.
بیتکوین زیر فشار سنگین: آیا ریزش کوتاهمدت آغاز شده است؟
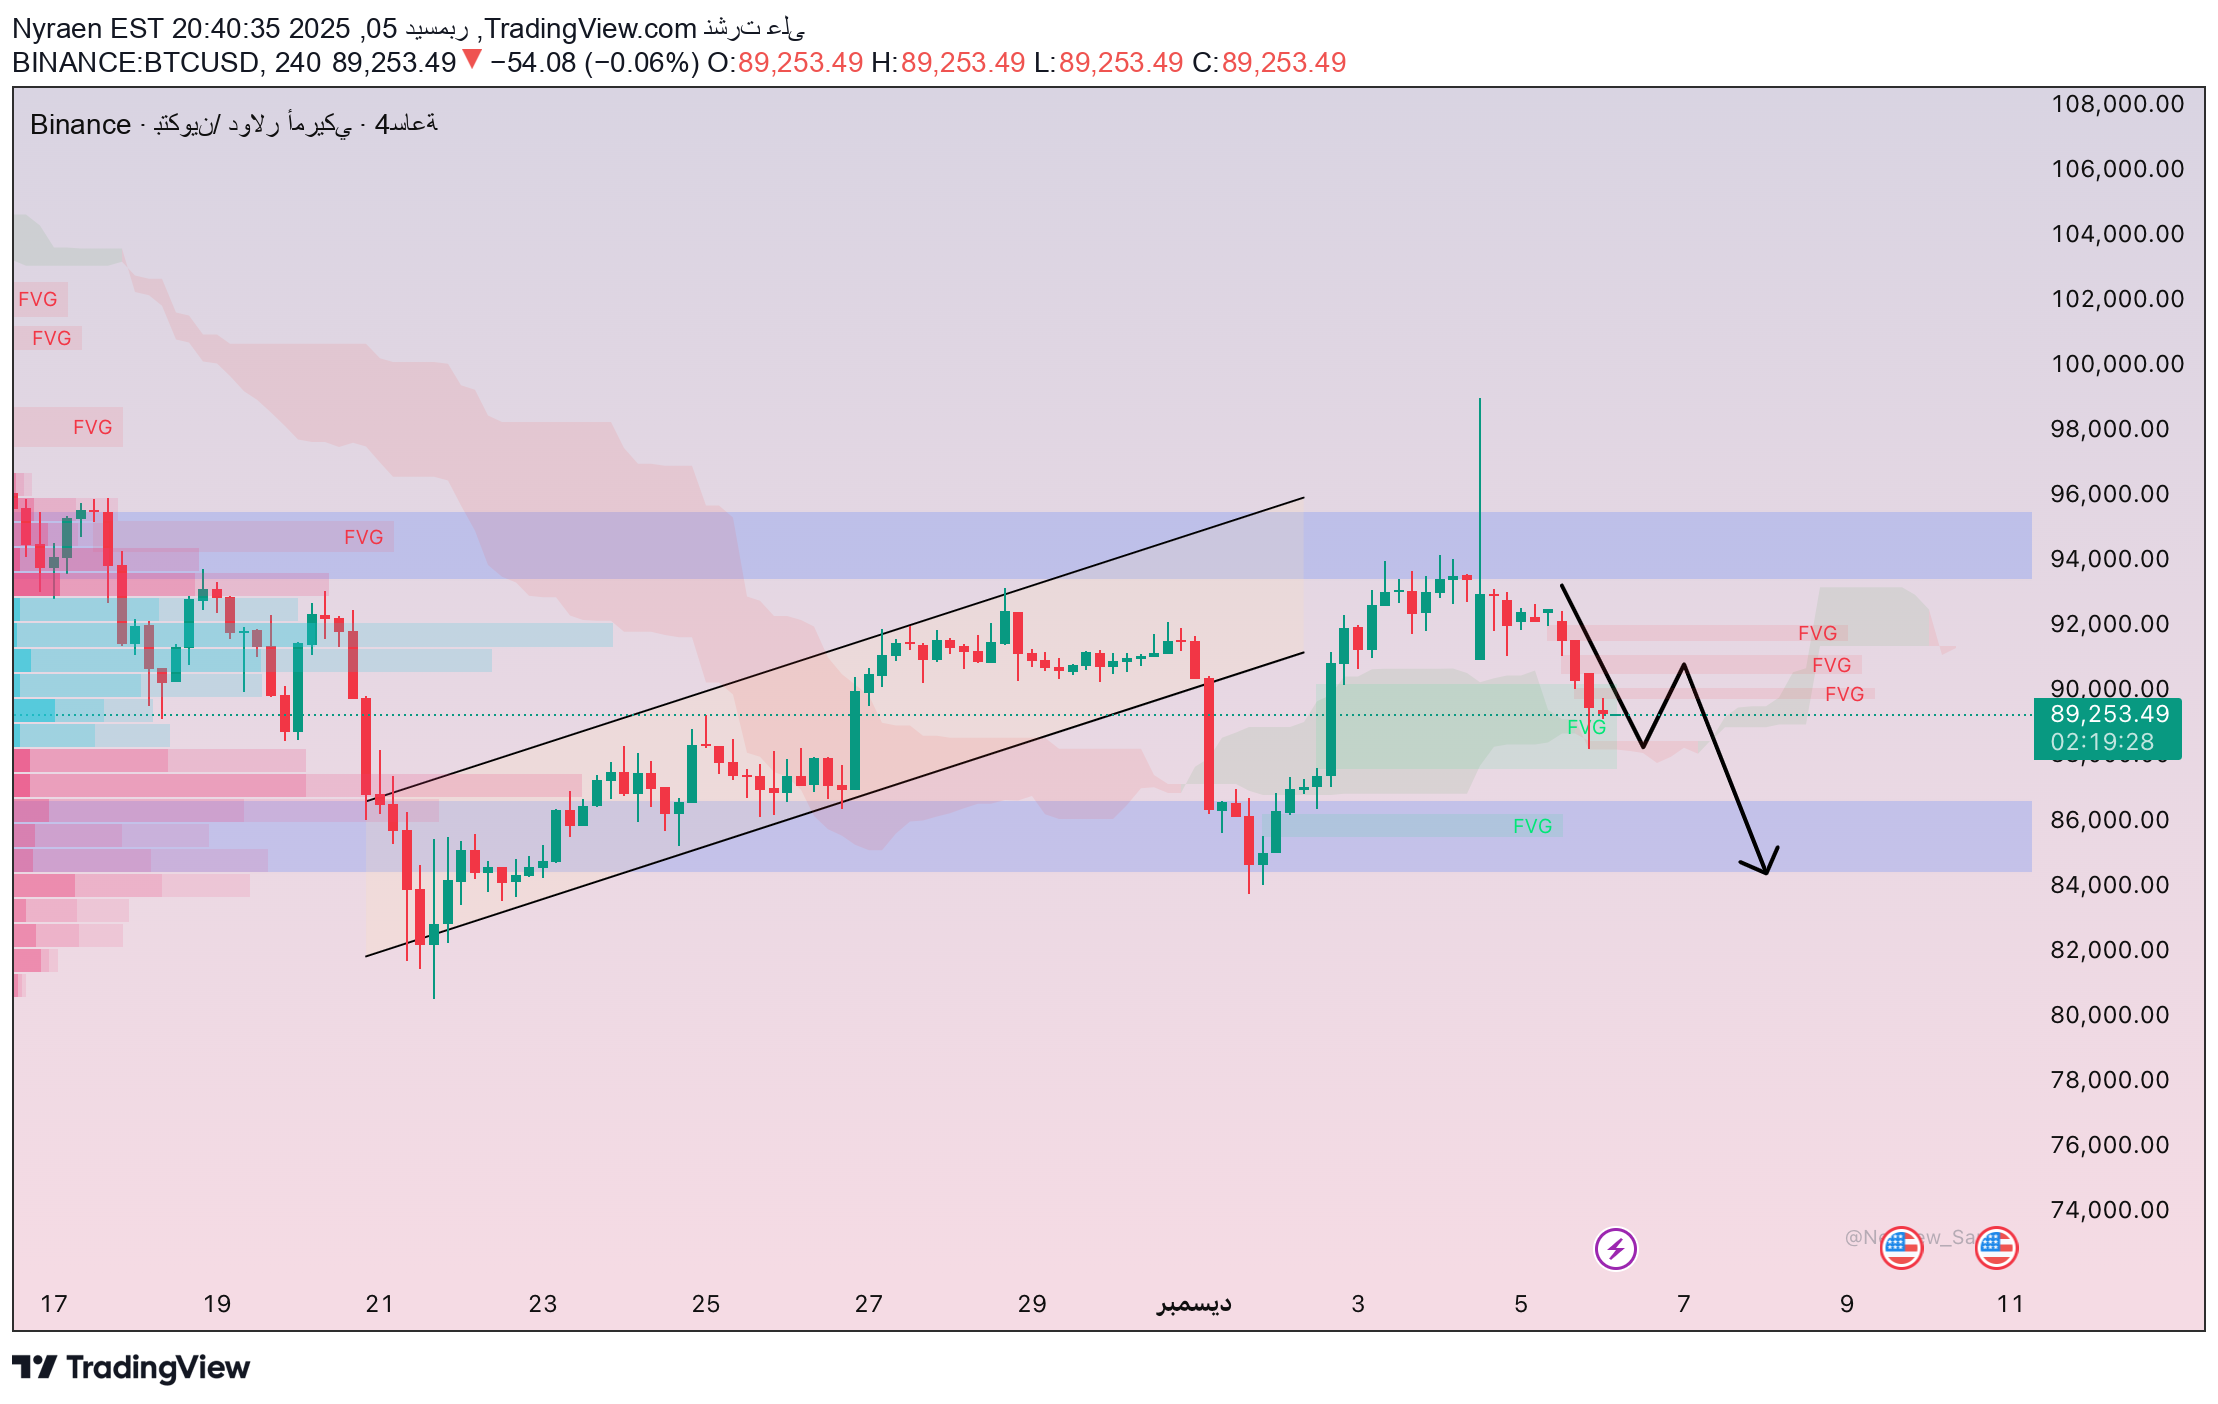
After failing to hold above the $94,000 area, Bitcoin headed for a clear correction, falling towards the $88,500–89,000 demand area after breaking the recent FVG area. This move reflects that buyers are still there, but their power is not enough to change the current structure. The formation of a lower high and a new low confirms the beginning of a short-term downtrend, while the red Ichimoku cloud forms a strong resistance density between $90,500 and $92,000. Buying volumes appear much weaker than the sell side, indicating sellers are in control. On the economic level, the rise in the dollar index and US bond yields are increasing pressure on digital assets. Waiting for NFP and PCE data also prompts traders to be cautious, a period when Bitcoin often sees a tendency for a slight pullback before major news releases.
صعود إيثريوم متوقف؟ مفترق طرق حاسم قرب 3220 دولارًا!
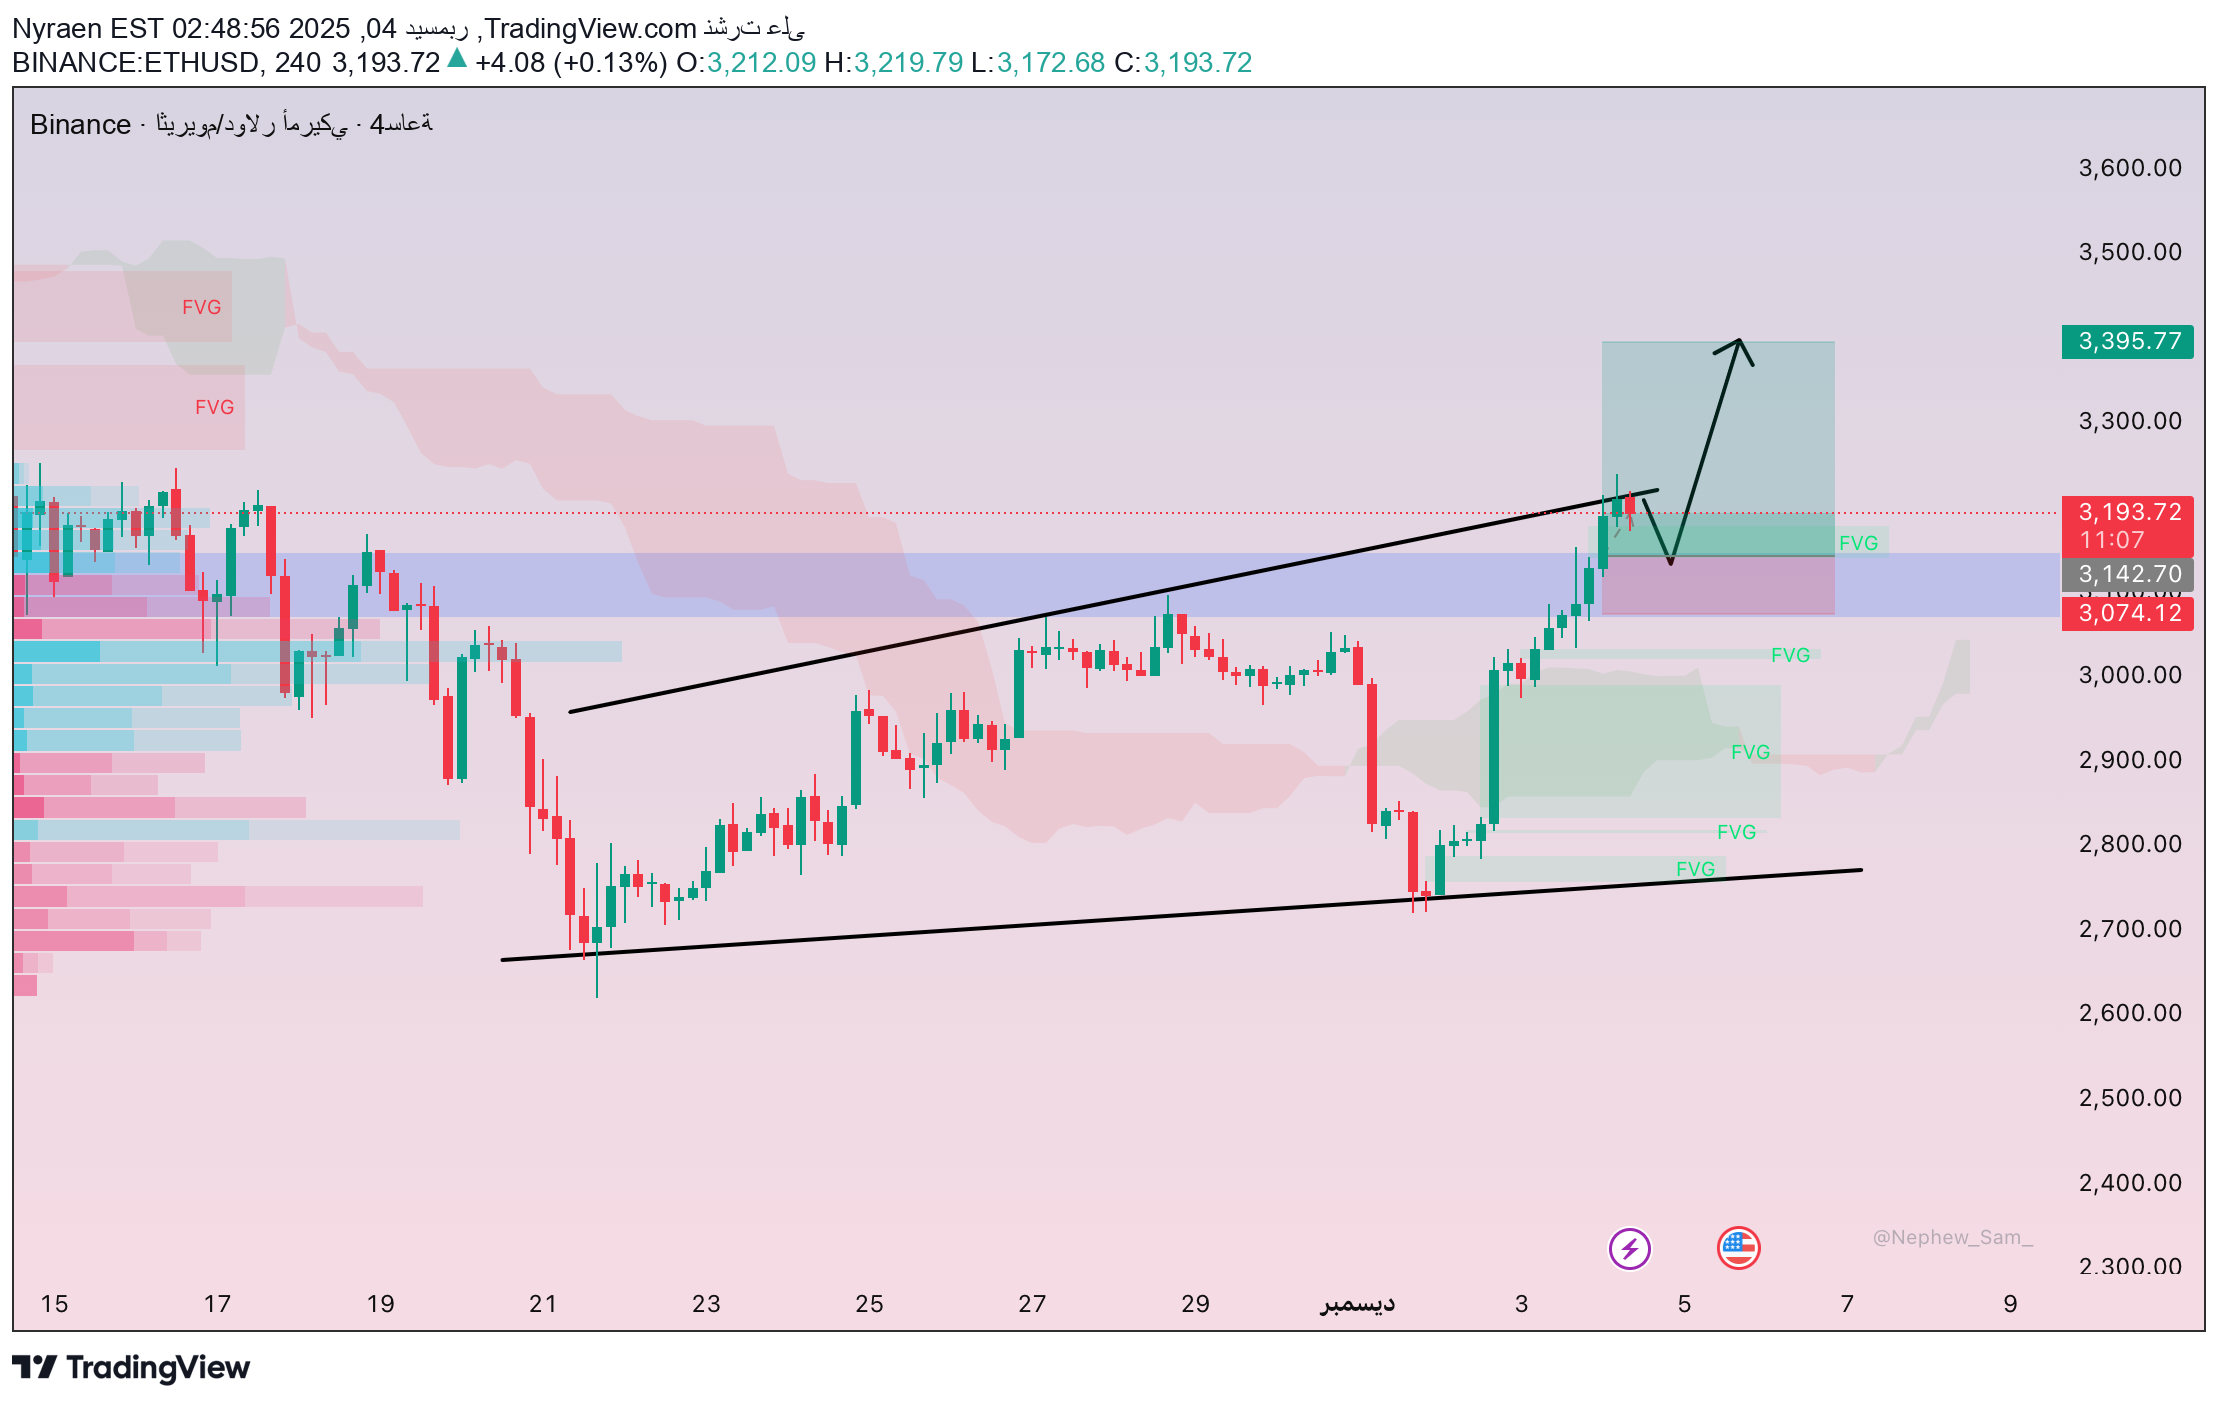
ETH rose strongly from the 2,770–2,820 area, but the upward movement began to weaken when the price entered the FVG area between 3,190 and 3,220, an area from which the price has bounced several times in the past due to clear selling pressure. Although the uptrend remains intact, the price is far from the Ichimoku cloud, a situation that often results in a correction to restore balance. There are also unfilled FVG areas below the price, making it more likely that the market will return to them before any new extension. The decline in trading volume near 3,200 compared to the previous rise indicates a slowdown in momentum. This scenario makes the possibility of a short correction move closer than following the rise directly.
ریزش شدید اتریوم: آیا کف قیمتی جدید در راه است؟ (تحلیل فنی و عوامل فشار)
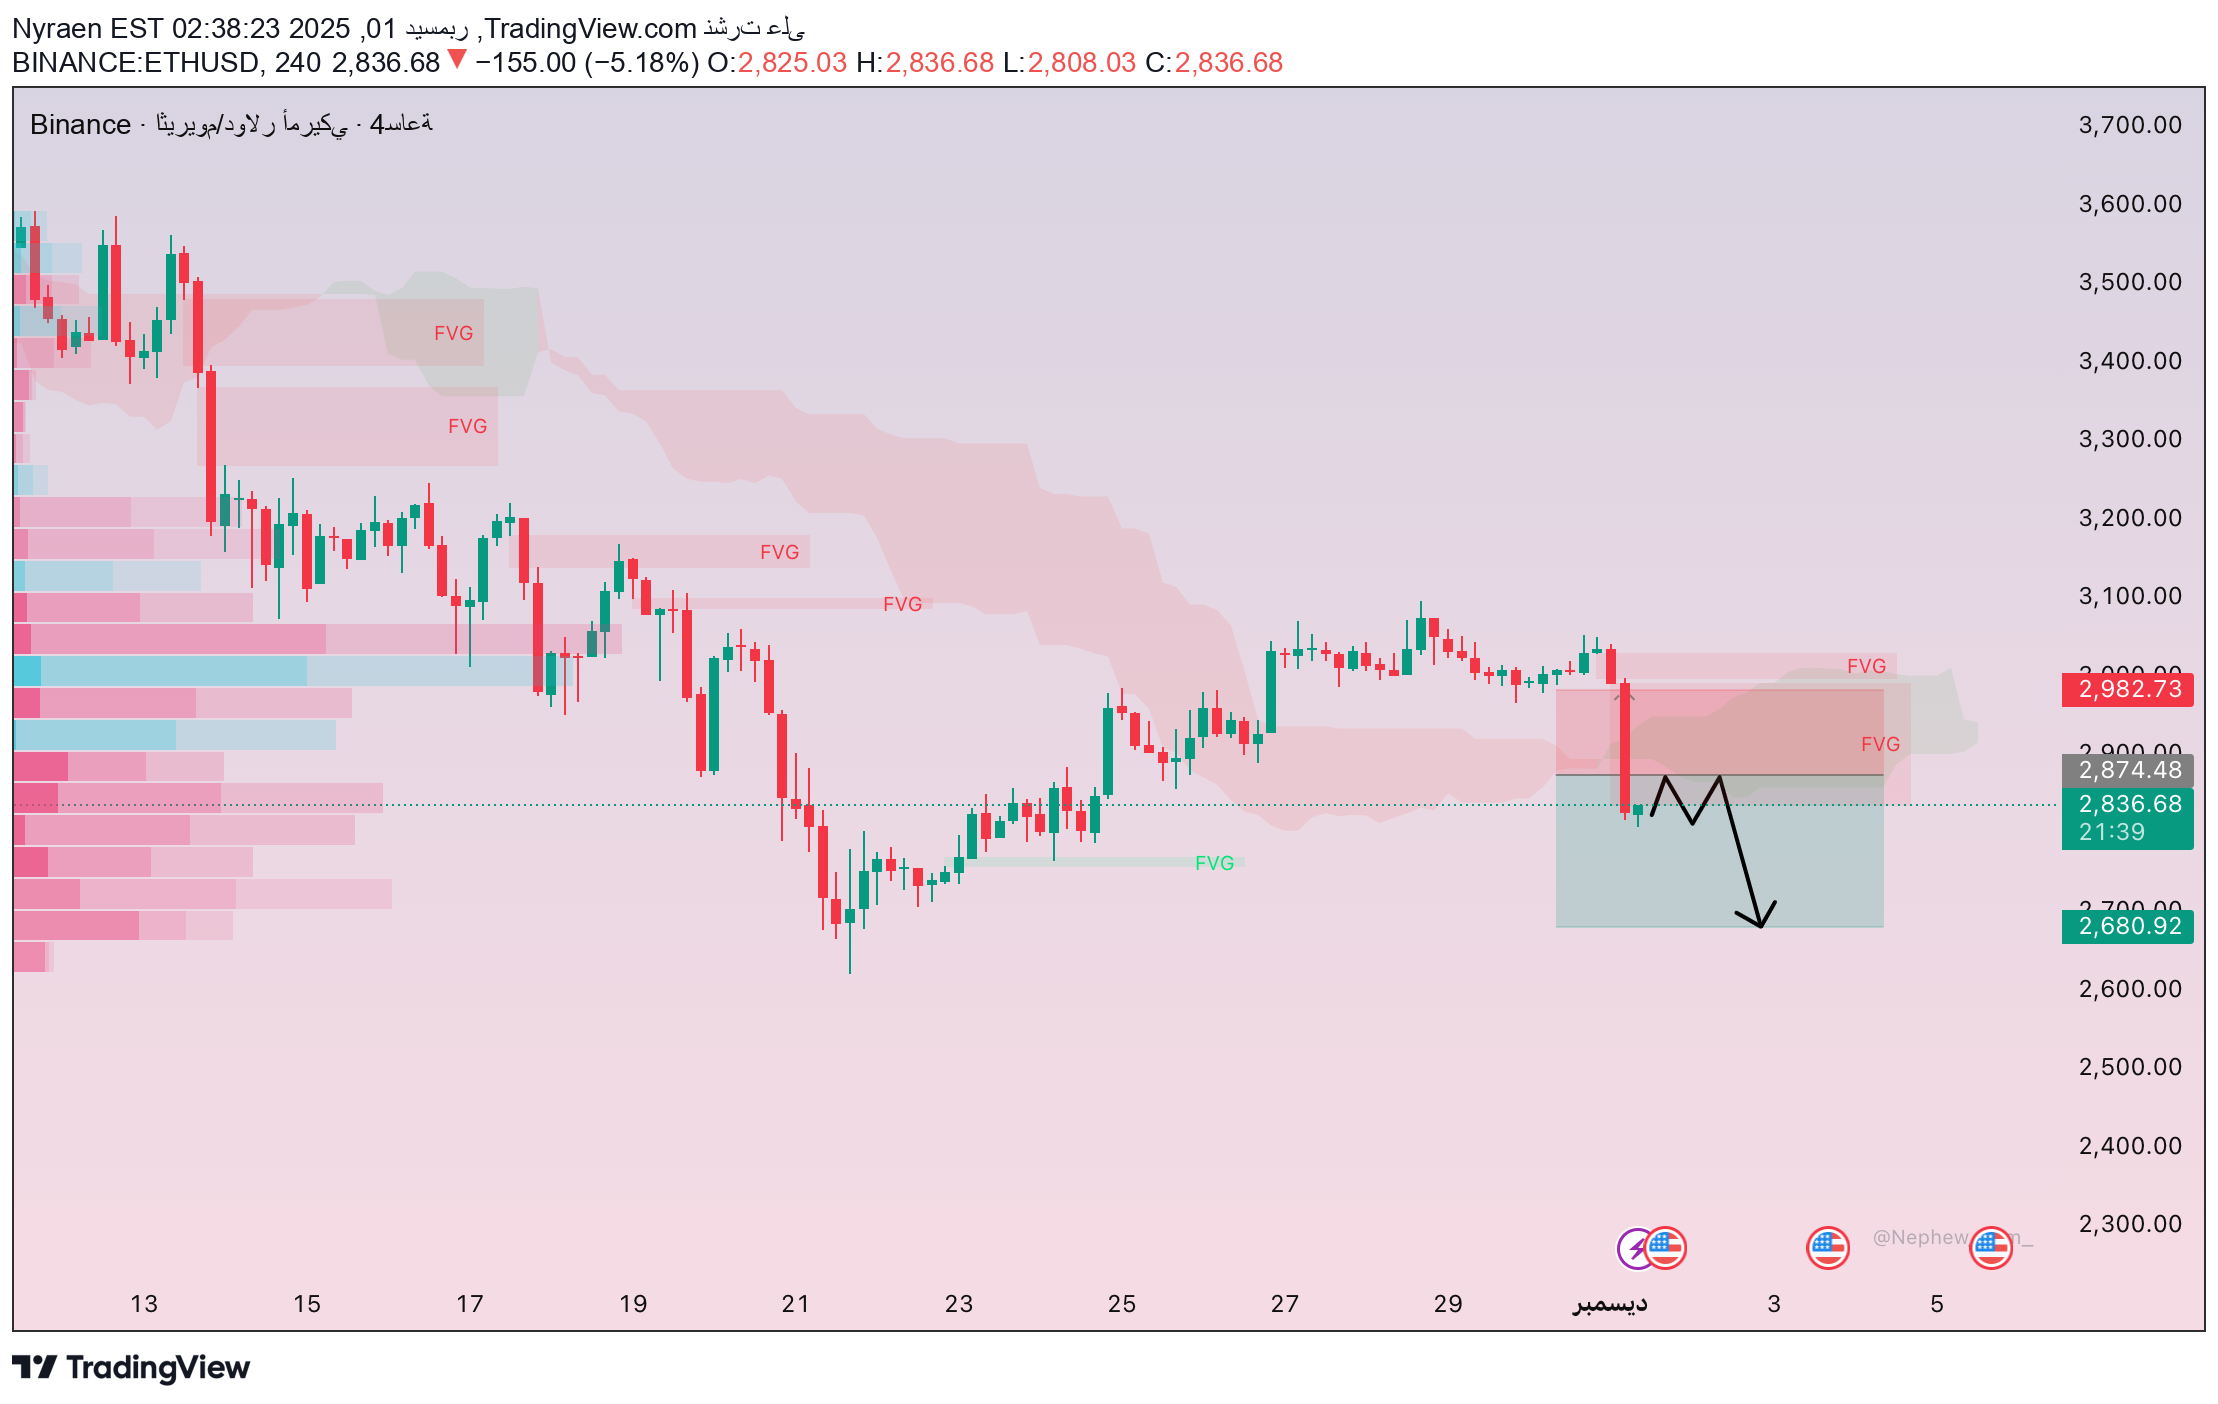
The ETH sharp bearish candle on the 4-hour frame فور registered its touch with the 3100–3030 supply zone, clearly indicating the superiority of the selling pressure. The sequence of falling peaks is still in place, and the clear break of the 2900 level with an increase in trading volume confirms that the decline is real and not just a quick corrective movement. The price is currently testing the 2850–2820 support, but the buying momentum is weak. The 2750–2780 area has greater liquidity and is considered a suitable level for rebalancing if the downward movement continues. External factors also contribute to the pressure: rising US bond yields, the possibility of a continuation of the Fed's tight monetary policy, negative news from the SEC, and whale transfers of currencies to exchanges. The most likely expectation is for the decline to extend towards 2780-2750 before a clear rebound appears, while breaching the 3030 level with a 4-hour closing may change the short-term picture.
Disclaimer
Any content and materials included in Sahmeto's website and official communication channels are a compilation of personal opinions and analyses and are not binding. They do not constitute any recommendation for buying, selling, entering or exiting the stock market and cryptocurrency market. Also, all news and analyses included in the website and channels are merely republished information from official and unofficial domestic and foreign sources, and it is obvious that users of the said content are responsible for following up and ensuring the authenticity and accuracy of the materials. Therefore, while disclaiming responsibility, it is declared that the responsibility for any decision-making, action, and potential profit and loss in the capital market and cryptocurrency market lies with the trader.